
Generating Temporal Network Paths from Hospital Data
John Michael Finney and Laura Madrid Marquez
National Institute for Health Research Oxford Biomedical Research Centre, University of Oxford, Oxford, U.K.
Oxford University Hospitals NHS Trust, John Radcliffe Hospital, Oxford, U.K.
Nuffield Department of Medicine, University of Oxford, Oxford, U.K.
Keywords: Graph Database, Temporal Networks, Neo4j, Cypher, Electronic Medical Records.
Abstract: Using data from electronic medical records we were able to rapidly generate temporal network data. This
data can then be loaded into a modern graph database and used to generate a temporal graph of the data.
Using a specialist graph language for rapidly querying these graph databases, we are able to rapidly extract
temporal path information about patient to patient contact networks based on shared ward encounters. This
information can then be used to calculate various network statistics of interest that may be important for
clinical use.
1 INTRODUCTION
Construction of social networks of hospital patients
based on shared ward contacts or other potential
disease transmission vectors has the potential to
allow interesting analysis to be done which may
provide useful actionable results to infection control
professionals (Cusumano-Towner et al., 2013;
Walker et al., 2012).
Electronic medical records provide a rich source
of data which can be readily used to generate these
social networks for the study of infectious disease
transmission within hospitals (Cusumano-Towner et
al., 2013). As we have complete knowledge of
patient ward based movements, we are able to use
electronic records to construct the complete network
structure allowing us to measure directly various
properties of the network without having to resort to
various network approximation methods to guess at
missing data (Danon et al., 2011).
Traditional network statistics fail to capture the
dynamic process inherent in disease transmission
(Holme and Saramäki, 2012). More recently there
has been extensive work on temporal network
models which allow us to capture the dynamic
nature of networks and achieve more relevant results
(Holme and Saramäki, 2012; Valdano et al., 2015).
We need to make sure our models and methods are
appropriate for handling temporal network data.
Many important concepts within disease
transmission can be modelled using network
analysis (Holme and Saramäki, 2012). Concepts
such as contact tracing, network centrality and
reachability among others may provide important
information to clinical staff which can then be used
to make important decisions regarding patient care
(Masuda and Holme, 2013; Cooper et al., 1999).
Due to the large datasets and relatively dense
network structure of patient connections we are
interested in using new tools to allow us to calculate
these various measures easily using newer temporal
data models.
Here we present an implementation of a
temporal network model of shared ward contacts and
show examples of how this can be used to rapidly
calculate temporal network paths which can be used
to calculate network statistics, very rapidly on large
datasets using modern software tools, which may be
important for infection control purposes.
2 MATERIALS AND METHODS
2.1 Ethics
Data for this work was obtained from the Infections
in Oxfordshire Research Database (IORD) (Finney
et al., 2011), a linked data warehouse of anonymised
patient records. IORD has Research Ethics
Committee and Health Research Authority approval
as a generic infectious disease electronic research
database (14/SC/1069, ECC5-07(A)/2009).
Finney, J. and Marquez, L.
Generating Temporal Network Paths from Hospital Data.
DOI: 10.5220/0005669402630268
In Proceedings of the 9th International Joint Conference on Biomedical Engineering Systems and Technologies (BIOSTEC 2016) - Volume 5: HEALTHINF, pages 263-268
ISBN: 978-989-758-170-0
Copyright
c
2016 by SCITEPRESS – Science and Technology Publications, Lda. All rights reserved
263
The work described here represents the network
engine used in the IORD approved study,
“asymptomatic carriage candidate selection”.
2.2 Network Model
In order to model our data, we have used the same
methods as described in (Holme and Saramäki,
2012). We have timestamped (YYYY-MM-DD
hh:mm) all our relationships and our code takes
account of this when traversing the network.
Traditional network models often aggregate links
between nodes over a period of time and calculate
statistics based on this (Holme and Saramäki, 2012);
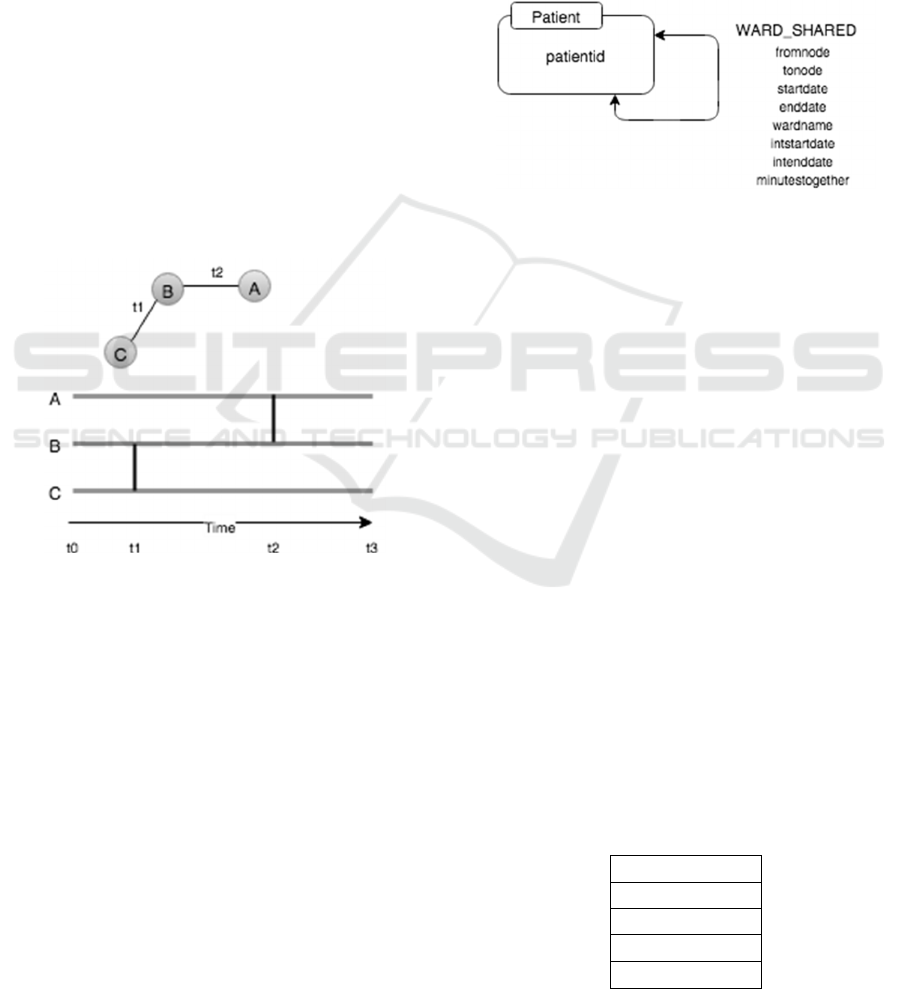
(Valdano et al., 2015). As can be seen from the
Figure 1 below, this aggregation over a period of
time does not reflect the true nature of the network.
As an example node A cannot ever reach node C as
following the temporal links between nodes never
allow this. The link between nodes A and B occurs
after the link between B and C never allowing the
connection of A and C.
Figure 1: We can easily see that if we start from node A,
we can never reach node C as the connection between the
intermediate link, B, and the final destination C happens
before the link from A to B.
In a more traditional static aggregated analysis
all the relationships within a time period would be
aggregated. In this example if we aggregate all
relationships from t0 to t1 we would then have a
path connecting all nodes at any point during this
time. In this very simple example the difference in
conclusions can be clearly seen.
For the purposes of our work we have
implemented our network using the property graph
(Sun et al., 2015) in Figure 2. The graph represents
the hospital patient to patient contact network, a
subset of a larger network model we are working on.
Each node in the graph represents a single
patient. The properties of the node represent various
demographics about the patient, which we are not
using in this example. All of this data can be used
later for studying the graph using any properties of
interest. Initially we are just concerned with our
patient and their contact with other patients based on
a shared ward space.
The edge connection from one patient to another
is a timestamped relationship representing the time
(YYYY-MM-DD hh:mm) and location the patients
came into contact in the hospital. This data is readily
extracted from IORD.
Figure 2: Here we have a simple property graph model
representing patient connections. Each Patient node
represents one unique patient in our data set. Patients are
linked with timestamped (YYYY-MM-DD hh:mm) edges
representing the date and time of contact, the place of
contact and the length of time, in minutes, the contact
occurred. This simple model provides enough information
for a range of temporal graph queries.
2.3 IORD Patient Data
In order to populate our models, we needed to
extract two sets of data. This data was generated
from IORD. The first set of data was a set of all
unique identifiers representing all inpatients in the
hospital between April 2008 and April 2011. The
fields for this data are listed in Table 1. This
represented 244331 unique individuals.
The second set of data described in Table 2,
represented the timestamped edges of the graph. The
represented patient to patient contacts based on
sharing the same ward at the same time. They
contained information over the same period and
represented 21284670 patient to patient contacts.
Table 1: nodeid is a unique identifier representing the
individual node. patientid is the unique id representing a
single patient with the birthdate and gender as given in the
fields, dob and gender.
Node Table
nodeid
patientid
dob
gender
HEALTHINF 2016 - 9th International Conference on Health Informatics
264

Table 2: Edgeid represents a unique value representing a
single overlapping time when two patients were in the
same ward at the same time. Startdate represents the time
the contact began with the endtime representing the end.
Wardname is the ward that they shared. Intstartdate and
intenddate are integer representations of the above dates to
make future graph traversal easier to handle. Minutes
together represents the length of time shared in the same
ward space in minutes and will be used in further analysis.
Edge Table
edgeid
fromnode
tonode
wardname
startdate
enddate
intstartdate
intenddate
minutestogether
Data was extracted from IORD, which is
contained in an MSSQL2014 database, and extracted
using TSQL.
2.4 Graph Database
Much of the electronic data within a hospital setting
is traditionally held in a relational database (Wyllie
and Davies, 2015). Although these databases work
extremely well and efficiently for relational models,
they perform poorly when trying to analyse data in a
network model structure (Rodriguez and Neubauer,
2010).
New types of NoSQL databases have emerged
over recent years to handle other types of non-
relational data (Ciglan et al., 2012). For our work we
use a specialist graph database, NEO4j, which
natively models data in a graph format and allows
for very rapid traversals. NEO4j allows one to easily
extract data from your normal relational database
and import it easily into a graph model.
2.5 Cypher Query Language
Once we have loaded our data into our NEO4j
model, we are able to then do temporal graph
traversals. The results of these traversals can then be
used either directly to calculate various properties of
the graph in question or the output can then be fed
into traditional tools to generate statistics of interest.
NEO4j uses a powerful declarative graph query
language called Cypher (Webber, 2012). This
language allows for extremely fast and expressive
queries across graph data models.
We implemented the following pseudo code in
neo4j:
Traverse paths between two nodes
Store results in "PATHS"
FOR EACH "PATH" in "PATHS"{
FOR EACH relationship in "PATH"{
IF relationship timestamp >
previous relationship timestamp
AND is within the range of
interest{
Keep this path and continue
checking.
}ELSE{
Discard this path.
}
}
Path complete. Keep this path.
}
Return all successful paths.
This pseudocode was implemented in neo4j
using the following to traverse the graph across a
temporal network.
MATCH path = allshortestpaths((
p:Patient{patientid:"11111"})
-[w:WARD_SHARE*..]->
(q:Patient{patientid:"22222"}))
with path,
EXTRACT(r in relationships(path) |
r.ward) as final with path,
final,
REDUCE(acc = [0,1], r in
relationships(path) |
CASE WHEN
r.intstartdate>acc[0] and
r.startdate>{some_date} and
r.startdate<{some_date}
THEN
[r.intstartdate, acc[1]*1]
ELSE
[r.intstartdate, acc[1]*0]
END
)[1] as test
where test=1
return path;
This cypher query calculates the paths between
two given nodes, 11111 and 22222. It tests each new
branch within an individual path to make sure that
the path represents a step forward in time. The end
result is a list of shortest paths between two nodes
based on the number of hops between nodes. All of
these paths all represent movements forward in time.
Using a java (Gosling, 2000) interface we were
able to connect the graph database to our relational
dataset to run multiple queries over many patients’
connections to calculate various temporal graph
paths of interest.
Generating Temporal Network Paths from Hospital Data
265
3 RESULTS
For the purposes of testing our graph database we
loaded 3 years of hospital admission, discharge and
transfer (ADT) data from IORD into NEO4j. We
used NEO4j enterprise version 2.21. This was run on
a Windows 2008 R2 server with 32GB ram and 16
cores.
The data from April 2008 to April 2011
consisted of 122 wards, 244331 unique patients and
21284670 shared ward contacts between these
patients.
This data was loaded into neo4j using the native
cypher loader. The 244331 nodes in the data set
loaded in 10.4 second using the following cypher
query:
Using periodic commit 500
Load csv with headers from
“file:f:neo4jnodes.csv” as row
Create (p:Patient)
Set p=row;
Create index on :Patient(patientid);
The 21284670 relationships in the data set was
loaded using the following query in 93 minutes.
Using periodic commit 500
Load csv with headers from
“file:f:neorjrelations.csv” as line
Match
(pa:Patient{patientid:line.patient1}
),
(pb:Patient{patientid:line.patient2}
)
Create (pa)-[:WARD_SHARE
{ward:line.ward,
startdate:line.joindate,
intstartdate:toInt(line.joinminute),
enddate:line.enddate,
intenddate:toInt(line.endminute),
minutestogether:toInt
(line.minutestogether),
fromnode:line.patienti1,
tonode:line.patient2}]
->(pb);
In order to test the speed of path generation for
different paths, we first retrieved all anonymous
identifiers for patients that had completed a C.diff
test during the period of our data set.
From this we initially chose March 1 2009 as our
initial index day. Paths were generated between all
patients on the index day that had a C.diff test as
well as all patients that had been tested for C.diff at
1,2,3,4,5,6,7,14,28,90,180 and 360 days. This was
repeated for the following days until March 31 2009.
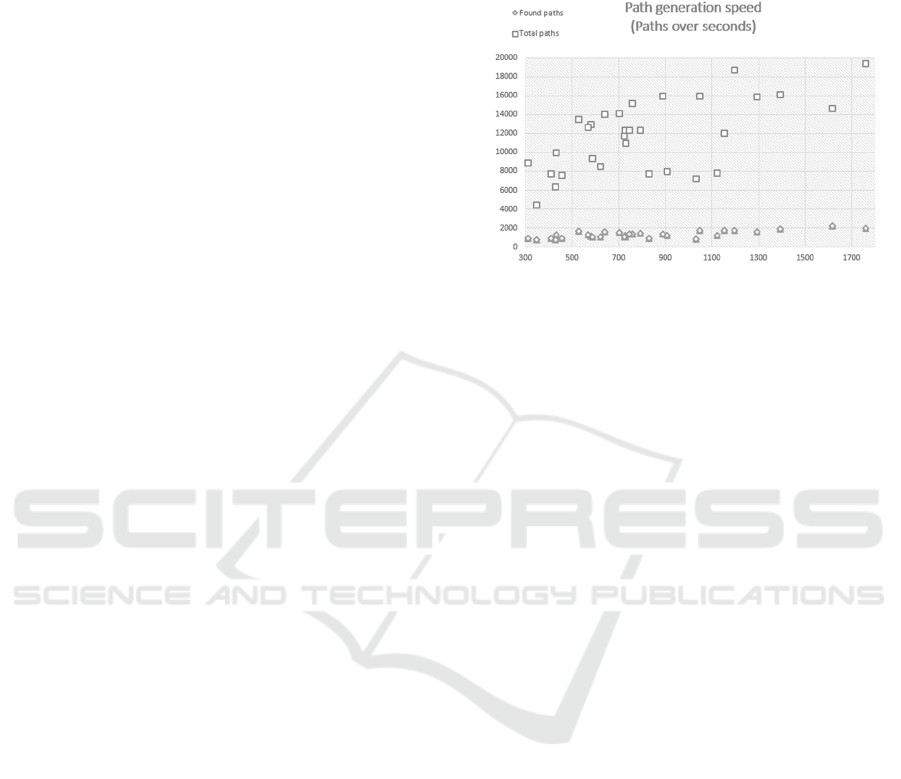
The results of the timings can be found in Figure 3.
This resulted in the search of 363823 potential
shortest paths between pairs of patients on different
days over a temporal network. The average time for
each path was 0.0717 (SD=0.0283) seconds.
Figure 3: This shows the timings for traversing all the
paths in the set of interest. The squares show the total
traversals for a given index day and the diamond shows
the successful traversals where a path was actually found.
4 DISCUSSION
So far we have shown that we are able to load large
patient to patient contact networks into a temporal
data model using NEO4j and then apply cypher
queries to efficiently extract paths between patients
very quickly.
On an individual basis, this information
potentially allows you to know all contacts rapidly
going backwards or forwards in time from a key
patient. Depending on the situation, it may provide a
rapid method of generating timely information for
relevant clinicians.
Once we start aggregating results from multiple
paths we can potentially start to find interesting
results. For example it is now trivial with a temporal
model to calculate a reachability ratio (Holme, 2005)
(Holme and Saramäki, 2012) of infection from one
ward (assuming person to person in ward contact is
the vector of transmission). This might provide
important information for deciding for example
which ward to place patients in order to minimise
the risk of infection reaching them from other wards.
It may also provide extra information to help decide
to close a ward or provide extra cleaning if the ward
has a high probability of spreading infection to other
parts of the hospital.
Other temporal network statistics can also
readily be calculated from aggregated path data
(Holme and Saramäki, 2012). Some examples are
centrality measures, diameter, latency and contact
networks.
HEALTHINF 2016 - 9th International Conference on Health Informatics
266

A number of studies of infectious disease have
reported on the importance of various centrality
measures to determine the most important nodes in
the network with regards to the disease in question
(Christley et al., 2005). With a temporal graph
model in place we can now readily calculate various
centrality measures of interest and then act
accordingly (Holme and Saramäki, 2012).
Recent studies have shown the importance of
using temporal network models for the SIR and
similar compartmental models (Holme and Masuda,
2015).
Traditional SIR models across networks link
pairs of individuals if there is a direct link during a
sampling period. When looking at the same data
through a temporal network it becomes obvious that
many paths in the model do not actually exist. The
end result can be completely different to the
traditional static aggregated model and can
potentially result in errors such as having a
reproductive number greater than 1 when in fact the
disease is actually dying out (Holme and Masuda,
2015).
Here with the framework we present we are able
to extract the required temporal data rapidly and
calculate various statistics as required.
5 CONCLUSIONS
Temporal graphs provide an important source of
statistical data. Several studies have suggested that
this data may provide information that may be
important for clinical use such as providing clues
about infection transmission (Holme and Saramäki,
2012); (Walker et al., 2012). However the extraction
of this data from hospital records has traditionally
been complicated and has required specialist tools
and knowledge to extract.
We have developed a simple way of using a
standard off the shelf graph database, connecting
this database to our local relational Infection
research database (IORD) and converting our data to
a temporal graph model which can then be used for
calculating various temporal graph statistics of
interest.
This work is important as it offers a way to
implement an important network algorithm which
can be used for infection control purposes that
would otherwise be hard to do and require specialist
tools and extensive custom programming.
We are currently using this model as the backend
for two research projects investigating various
aspects of infectious disease transmission within a
hospital setting.
In the future we hope to integrate further
algorithms into our work and potentially integrate
this into a live system.
ACKNOWLEDGEMENTS
The research was supported by the National Institute
for Health Research (NIHR) Oxford Biomedical
Research Centre based at Oxford University
Hospitals NHS Trust and University of Oxford.
REFERENCES
Cusumano-Towner, M., Li, D., Tuo, S., Krishnan, G. and
Maslove, D. (2013). A social network of hospital
acquired infection built from electronic medical
record data. Journal of the American Medical
Informatics Association, 20(3), pp.427-434.
Walker, A., Eyre, D., Wyllie, D., Dingle, K., Harding, R.,
O'Connor, L., Griffiths, D., Vaughan, A., Finney, J.,
Wilcox, M., Crook, D. and Peto, T. (2012).
Characterisation of Clostridium difficile Hospital
Ward Based Transmission Using Extensive
Epidemiological Data and Molecular Typing. PLoS
Med, 9(2), p.e1001172.
Danon, L., Ford, A., House, T., Jewell, C., Keeling, M.,
Roberts, G., Ross, J. and Vernon, M. (2011). Networks
and the Epidemiology of Infectious Disease.
Interdisciplinary Perspectives on Infectious Diseases,
2011, pp.1-28.
Barnes, S., Golden, B. and Wasil, E. (2010). A dynamic
patient network model of hospital-acquired infections.
Proceedings of the 2010 Winter Simulation
Conference.
Holme, P. and Saramäki, J. (2012). Temporal networks.
Physics Reports, 519(3), pp.97-125.
Valdano, E., Ferreri, L., Poletto, C., & Colizza, V. (2015).
Analytical computation of the epidemic threshold on
temporal networks. Physical Review X, 5(2), 021005.
Masuda, N. and Holme, P. (2013). Predicting and
controlling infectious disease epidemics using
temporal networks. F1000Prime Rep, 5.
Christley, R. (2005). Infection in Social Networks: Using
Network Analysis to Identify High-Risk Individuals.
American Journal of Epidemiology, 162(10), pp.1024-
1031.
Cooper, B., Medley, G. and Scott, G. (1999). Preliminary
analysis of the transmission dynamics of nosocomial
infections: stochastic and management effects. Journal
of Hospital Infection, 43(2), pp.131-147.
Sun, W., Fokoue, A., Srinivas, K., Kementsietsidis, A.,
Hu, G., & Xie, G. (2015, May). SQLGraph: An
Efficient Relational-Based Property Graph Store.
Generating Temporal Network Paths from Hospital Data
267

In Proceedings of the 2015 ACM SIGMOD
International Conference on Management of Data (pp.
1887-1901). ACM.
Finney, J., Walker, A., Peto, T. and Wyllie, D. (2011). An
efficient record linkage scheme using graphical
analysis for identifier error detection. BMC Med
Inform Decis Mak, 11(1), p.7.
Taxiarchis Botsis, C. (2010). Secondary Use of EHR:
Data Quality Issues and Informatics Opportunities.
Summit on Translational Bioinformatics, [online]
2010, p.1. Available at:
http://www.ncbi.nlm.nih.gov/pmc/articles/PMC30415
34/ [Accessed 9 Sep. 2015].
Ciglan, M., Averbuch, A. and Hluchy, L. (2012).
Benchmarking Traversal Operations over Graph
Databases. 2012 IEEE 28th International Conference
on Data Engineering Workshops.
Rodriguez, M. and Neubauer, P. (2010). The Graph
Traversal Pattern. [online] Arxiv.org. Available at:
http://arxiv.org/abs/1004.1001 [Accessed 9 Sep.
2015].
Jim Webber. 2012. A programmatic introduction to Neo4j.
In Proceedings of the 3rd annual conference on
Systems, programming, and applications: software for
humanity (SPLASH '12). ACM, New York, NY, USA,
217-218.
Gosling, J. (2000). The Java language specification.
Addison-Wesley Professional.
Holme, P. (2005). Network reachability of real-world
contact sequences.Physical Review E, 71(4), 046119.
Borgatti, S. P. (2005). Centrality and network flow. Social
networks, 27(1), 55-71.
Bell, D. C., Atkinson, J. S., & Carlson, J. W. (1999).
Centrality measures for disease transmission
networks. Social networks, 21(1), 1-21.
Christley, R. M., Pinchbeck, G. L., Bowers, R. G., Clancy,
D., French, N. P., Bennett, R., & Turner, J. (2005).
Infection in social networks: using network analysis to
identify high-risk individuals. American journal of
epidemiology, 162(10), 1024-1031.
Rocha, L. E., Liljeros, F., & Holme, P. (2011). Simulated
epidemics in an empirical spatiotemporal network of
50,185 sexual contacts. PLoS Comput Biol, 7(3),
e1001109.
Wyllie, D., & Davies, J. (2015). Role of data warehousing
in healthcare epidemiology. Journal of Hospital
Infection, 89(4), 267-270.
Easley, D., & Kleinberg, J. (2010). Networks, crowds, and
markets: Reasoning about a highly connected world.
Cambridge University Press.
Holme, P., & Masuda, N. (2015). The basic reproduction
number as a predictor for epidemic outbreaks in
temporal networks. PloS one, 10(3), e0120567.
HEALTHINF 2016 - 9th International Conference on Health Informatics
268
