
An Overset Mesh Approach for Valve Closure: An LVAD Application
Mohammed G. Al-Azawy
1,2
, A. Turan
1
and A. Revell
1
1
School of Mechanical, Aerospace and Civil Engineering, The University of Manchester, Manchester, U.K.
2
Mechanical Engineering Department, College of Engineering, Wasit University, Wasit, Iraq
Keywords:
Computational Fluid Dynamics (Cfd), Left Ventricular Assist Device (Lvad), Overset Mesh, Non-Newtonian
Flow, Turbulence Modelling.
Abstract:
A comprehensive Computational Fluid Dynamics (CFD) simulation of transient, non-Newtonian, and tur-
bulent blood flow through a positive displacement pump, left ventricular assist device (LVAD), is executed.
Non-Newtonian blood flow is conducted to investigate the flow through a pulsatile pump LVAD by using com-
mon blood viscosity model: Carreau. The numerical results of non-Newtonian fluid with a turbulence model,
Elliptic Blending Reynolds Stress Model (EB-RSM) are presented. The computational domain that has been
selected is a pulsatile pump, which includes valves and a moving pusher plate. An overset mesh zero gap
technique was employed to capture the cyclic motion of pusher plate and valves rotation to mimic the scenario
of a natural heart. The use of this technique to rotate the valves and ensure full valve closure presented a good
agreement results with the experimental data.
1 INTRODUCTION
Fluid mechanical studies inside artificial heart pumps
have been ongoing since the 1970s in an attempt to in-
vestigate and understand the flow behaviour of blood
inside the device in order to predict and mitigate the
blood damage caused by the device.
Artificial heart valves have been used widely in or-
der to assist or replace the natural damage valves. Pre-
viously, the researchers observed that serious prob-
lems associated with the flow around the valves such
as separated and secondary flow, high pressure and
large turbulence shear stress (Kiris et al., 1997; Sti-
jnen et al., 2004). The main causal risks associated
with heart devices, especially with the valves, are
thrombosis and haemolysis, both of which are directly
related to the flow field within the devices.
In simulating the blood flow inside the cardiovas-
cular systems, one of the important issues that needs
to be taken into account is how to treat the nature of
blood flow as a fluid in order to accurately predict and
evaluate the wall shear stress and strain rate. Local
haemodynamics are not only affected by the geome-
try of artificial heart assist devices, properties of flow
as pulsation or not, but also by the natural proper-
ties of blood. Therefore, in the current study, a non-
Newtonian Carreau model has been used to investi-
gate the blood flow within a left ventricular assist de-
vice (LVAD).
Outlet port
Inlet port
Aortic
valve
Mitral
valve
Pusher
plate
Figure 1: Model Geometry.
A study in 2004 by Yin et al. (Yin et al., 2004) was
performed experimental and numerical study to mea-
sure in vitro the procoagulant properties of platelets
induced by flow through Carbomedics bileaflet and
Bjork-Shiley monoleaflet mechanical heart valves in
a left ventricular assist device. A modified prothrom-
binase method was used to measure the platelet ac-
tivation states during circulation. Wilcox k −ω tur-
bulence model and platelet shear-stress histories were
used to simulate the CFD model of turbulent, transient
Al-Azawy, M., Turan, A. and Revell, A.
An Overset Mesh Approach for Valve Closure: An LVAD Application.
DOI: 10.5220/0005663901450151
In Proceedings of the 9th International Joint Conference on Biomedical Engineering Systems and Technologies (BIOSTEC 2016) - Volume 1: BIODEVICES, pages 145-151
ISBN: 978-989-758-170-0
Copyright
c
2016 by SCITEPRESS – Science and Technology Publications, Lda. All rights reserved
145
and non-Newtonian blood flow. The results from the
platelet activation states measurements showed that
the bileaflet MHV activated platelets at a rate more
than twice that observed with the monoleaflet MHV.
For simplicity, most numerical simulations as-
sumed the flow around the heart valves to be two di-
mensional (Bluestein et al., 2000) flow and fixed fully
open position such as (Medvitz et al., 2009). The
techniques that can be used for valve simulation is
discussed in this work. Kreider et al. (Kreider et al.,
2006) conducted an experimental work (planer parti-
cle image velocimetry) to analysis the flow field asso-
ciated with the Bjork-Shiley mechanical heart valve
of the 50cc Penn State ventricular assist device. The
authors noticed that there was longer duration wall
washing motion occurring at 45 degree. In most re-
cent study by the authors (Al-Azawy et al., 2016;
Al-Azawy et al., 2015), the valves were assumed
in the fully open position. The authors investigated
unsteady flow inside a 50cc LVAD Penn State, de-
sign V2. The authors tested the laminar and turbu-
lent flow to assess the sensitivity to a range of com-
monly used turbulence models. In this study, six tur-
bulence models have been used: shear stress transport
(SST) k −ω, transition SST, Spalart-Allmaras, k −ε,
Reynolds stress model (RSM), and laminar model.
The CFD model includes valves and a moving pusher
plate, the valves were simulated in their fully open po-
sition and a layering method was employed to move
the pusher plate and capture the cyclic motion. The
results were validated with the numerical and exper-
imental data and showed that the RSM provided the
best agreement with the experimental data over much
of the flow. In parallel with this work, the authors in
this study extended the investigation to use the over-
set mesh technique to rotate the valves and pusher
plate movement. The overset mesh zero gap approach
has been employed to incorporate full valve open-
ing/closing, instead of assuming full opening position
as illustrated in the previous work. The aim of this
study is to evaluate the impact of the overset mesh
approach on the flow around the valves.
2 NUMERICAL MODELLING
In the current study, a model of a ventricular assist de-
vice is constructed. The model to be investigated is a
50cc LVAD test rig V2 design, as described in previ-
ous studies (Medvitz, 2008; Al-Azawy et al., 2016).
This design includes Bjork-Sheily valves and pusher
plate. The valves were simulated without supported
struts for the sake of simplicity; see Figure 1, which
shows the mitral valve (23 mm) in its fully open posi-
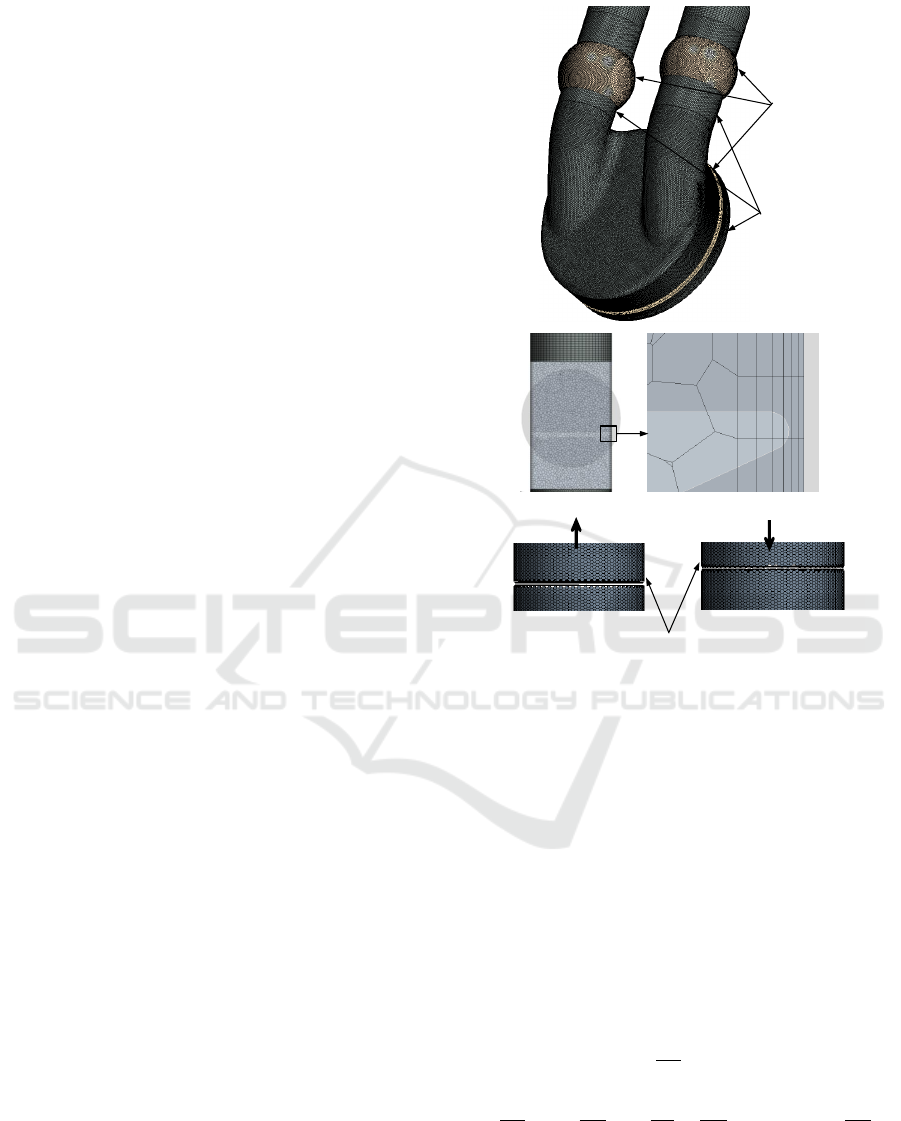
(a)
Overset
region
Background
region
(b)
Inactive cells in
the small gap
(c)
Figure 2: Snapshots of (a) mesh configuration showing the
overset and background regions, (b) the gap between the
background and valve showing the cells and (c) the space
after initialisation.
tion (70 deg) and the aortic valve (21 mm) in its fully
closed position (0 deg). The model was examined
under physiological operating conditions at 4.2 LPM
(litres per minute) and 86 BPM (beats per minute).
All the simulations employed unsteady compu-
tational flow for a full pumping cycle of the three-
dimensional analysis. The simulations were imple-
mented using a finite volume code STAR-CCM+
10.02, a commercially available CFD package (Star-
CCM, 2015), to solve the Navier-Stokes equations:
∂u
i
∂x
i
= 0 (1)
ρ
∂u
i
∂t
+ ρu
j
∂u
i
∂x
j
= −
∂p
∂x
i
+
∂
∂x
j
(µ(|S|) + µ
t
)
∂u
i
∂x
j
(2)
where u
i
is the velocity in i direction (i =
1,2,and3), u
i
= (u,v,w), correspond to the coordi-
nate system, x
i
= (x,y,z), respectively; p is the pres-
sure; and ρ is the density. In the current study we
BIODEVICES 2016 - 9th International Conference on Biomedical Electronics and Devices
146
0 0.2 0.4 0.6 0.8 1
0
5
10
15
-2
-1.5
-1
-0.5
0
0.5
1
1.5
2
2.5
3
Pusher plate movement
Mitral valve movement
Aortic valve movement
Pusher plate displacement(mm)
Fully opened
Fully closed
Valve movement (deg)
t/T
0
70
Figure 3: Valves and pusher plate movement.
have used the non-Newtonian Carreau models, µ(|S|)
is the blood viscosity that depends on the shear rate
magnitude,|S|=
p
2S
i j
S
i j
where S
i j
=
1
2
∂u
i
∂x
j
+
∂u
j
∂x
i
.
The turbulent viscosity, µ
t
, calculated via additional
transport equations representative of the turbulence.
The following expression has been given for the
Carreau model (Carreau, 1972; Johnston et al., 2004):
µ(|S|) = µ
∞
+ (µ
0
−µ
∞
)(1 + (λS)
2
)
(n−1)/2
(3)
where λ is the relaxation time constant (λ =
3.313s), n = 0.3568, µ
0
is the viscosity of blood at
zero shear rate (µ
0
= 0.056pa.s) and µ
∞
is the infinite
shear viscosity (µ
∞
= 0.00345pa.s).
The transport equations are solved by using a seg-
regated flow approach and the SIMPLE algorithm for
pressure-velocity coupling. A second order implicit
unsteady scheme is applied in time, while the spatial
discretisation utilises a second-order upwind scheme
along with a hybrid Gauss-LSQ method is used for
gradient reconstruction. In the present work, the to-
tal and static pressures were set according to in vitro
measurements which indicated a device mean static
pressure rise of 80 mm Hg (Medvitz, 2008). There-
fore, the total and static pressures were set to zero at
the inlet and 80 mm Hg at the outlet respectively.
3 DESCRIPTION OF THE
VALVES AND PUSHER PLATE
MOVEMENT
In positive displacement pump problems, in order to
acquire the desired scenario for the diastolic and sys-
tolic phases, it is necessary to model the valve closure
and the pusher plate movement to maintain unidirec-
tional flow. The times of the valve closing and open-
ing are short compared to the duration of diastole and
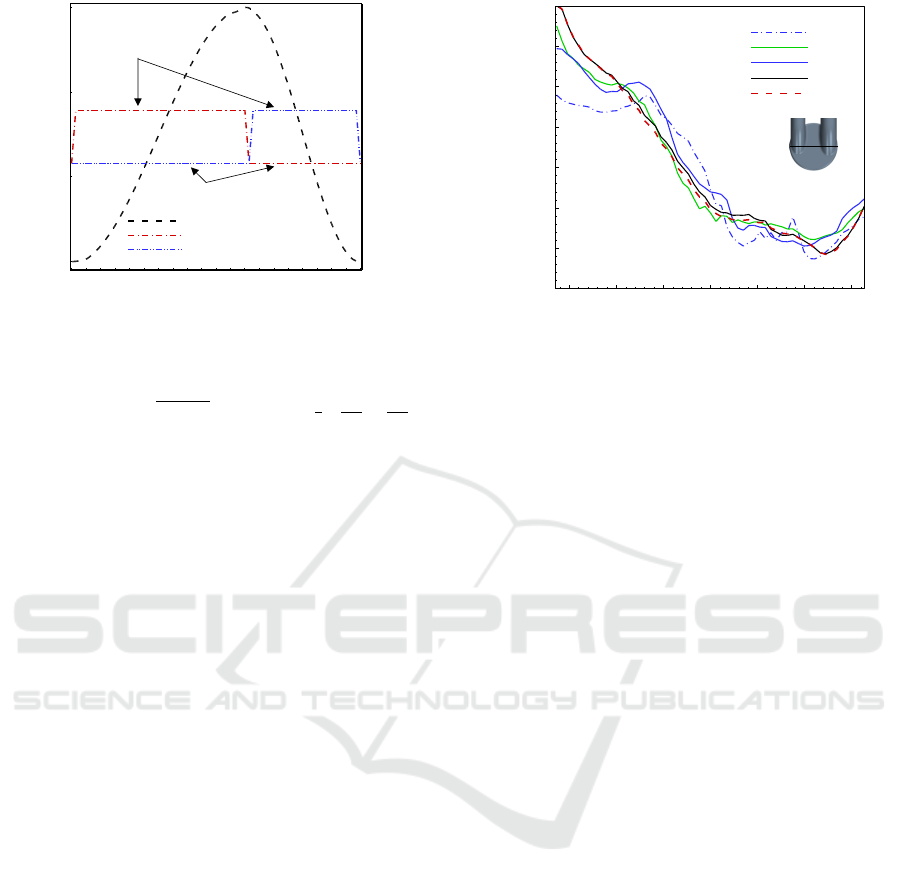
Position(m)
Y-velocity (m/s)
-0.03 -0.02 -0.01 0 0.01 0.02 0.03
-0.3
-0.2
-0.1
0
0.1
0.2
0.3
0.4
MO1
MO2
MO3
MO4
MO5
Figure 4: Time-averaged y-velocity located on the plane
z/z
c
= 0.53 along a horizontal centreline at time t/T =
0.614.
systole phase. Therefore, in previous study by (Al-
Azawy et al., 2016) the mitral and aortic valves were
fixed in the fully open position during the pump cycle
and to mimic the closed valve as in a natural heart.
Further to this, an interface was fixed above the valves
and introducing it as a wall on one occasion and as
an open interface on another, depending on the cycle
phase. However, there are various methods to model
the valves; either a dynamic mesh, immersed bound-
ary (Peskin, 2002) or a binary flow model (where the
flow is either fully closed or fully open). A variable
viscosity model was implemented by Medvitz (Med-
vitz et al., 2007) to model the valve closing, as used
by Avrahami (Avrahami, 2003) and Stijnen (Stijnen,
2004). In the present study the authors extended the
investigation and used the overset mesh technique to
model the valve rotation, as the authors believe this
will give more accurate results and more insight anal-
ysis for shear stress and strain rate near the valves.
The overset mesh technique (Chimera) has been
successfully used to simulate the flow among the
moving regions with zero gap between the moving
and stationary zones. The overset mesh zero gap in-
terface method has been employed to simulate the
pusher plate movement inside the chamber and valve
rotation with full closure of the valve, as shown in
Figure 2a, which illustrates the background and over-
set regions. In the background zone, where the ac-
tive cells are found, the regular discretised governing
equations are solved, while in the overset mesh, which
contains the inactive or passive cells (these cells will
be active during the movement) no equation is solved.
The inactive cells that separate active and passive are
called the acceptor cells and the active cells along the
interface with the inactive cells are called donor cells.
The interpolation is used to express variable values at
acceptor cells via variable values at donor cells (Star-
An Overset Mesh Approach for Valve Closure: An LVAD Application
147
CCM, 2015).
The closing and opening time of the valves was
short, taking approximately 10 ms (Medvitz, 2008).
Figure 3 illustrates the movements of the pusher plate
and valves; during the diastole the flow enters after
opening the mitral valve as the pusher plate expands
to fill chamber. The mitral valve then closes at the
end of diastolic, whereas during the systole the aor-
tic valve will open and the pusher plate will pump
the flow towards the outlet port and the aortic valve
will close at the end of the systolic period. The cy-
cle is then repeated. The thickness of the chamber
was varied cyclically from a minimum of z/z
c
= 0.21
to a maximum of z/z
c
= 1, where z was the distance
from the front face of the chamber and the chamber
thickness z
c
was 18.8mm corresponding to a maxi-
mum volume of approximately 50cc.
The time of the diastolic phase is (0 ≤t < 0.43s)
while the time of the systolic phase is (0.43 ≤ t <
0.7s), with the velocity of the wall introduced as fol-
lows:
For the diastolic phase:
V
diastole
wall
= A
2π
T
sin
2π
T
t
(4)
For the systolic phase:
V
systole
wall
= A
2π
T
cos
2π
T
t
(5)
where V
wall
is the velocity of the moving wall, the
pusher plate is represented as a function of time, t
is the flow time (sec), A is the distance between the
moving wall and the mid-stroke position, and T is a
one-cycle period (T = 0.7s).
Cycle
0 1 2 3 4 5
0.1
0.2
0.3
0.4
0.5
0.6
0.7
0.8
0.9
1
Velocity (m/s)
0 1 2 3 4 5
0.1
0.2
0.3
0.4
0.5
0.6
0.7
0.8
0.9
1
Cycle
Velocity (m/s)
Figure 5: Evolution of velocity magnitude at point in the
chamber.
4 COMPUTATIONAL DETAILS
The following five computational meshes have
been used: MO1 (957,573), MO2 (1,511,511),
MO3 (2,944,787), MO4 (4,030,158), and MO5
(5,614,830). These meshes were created by
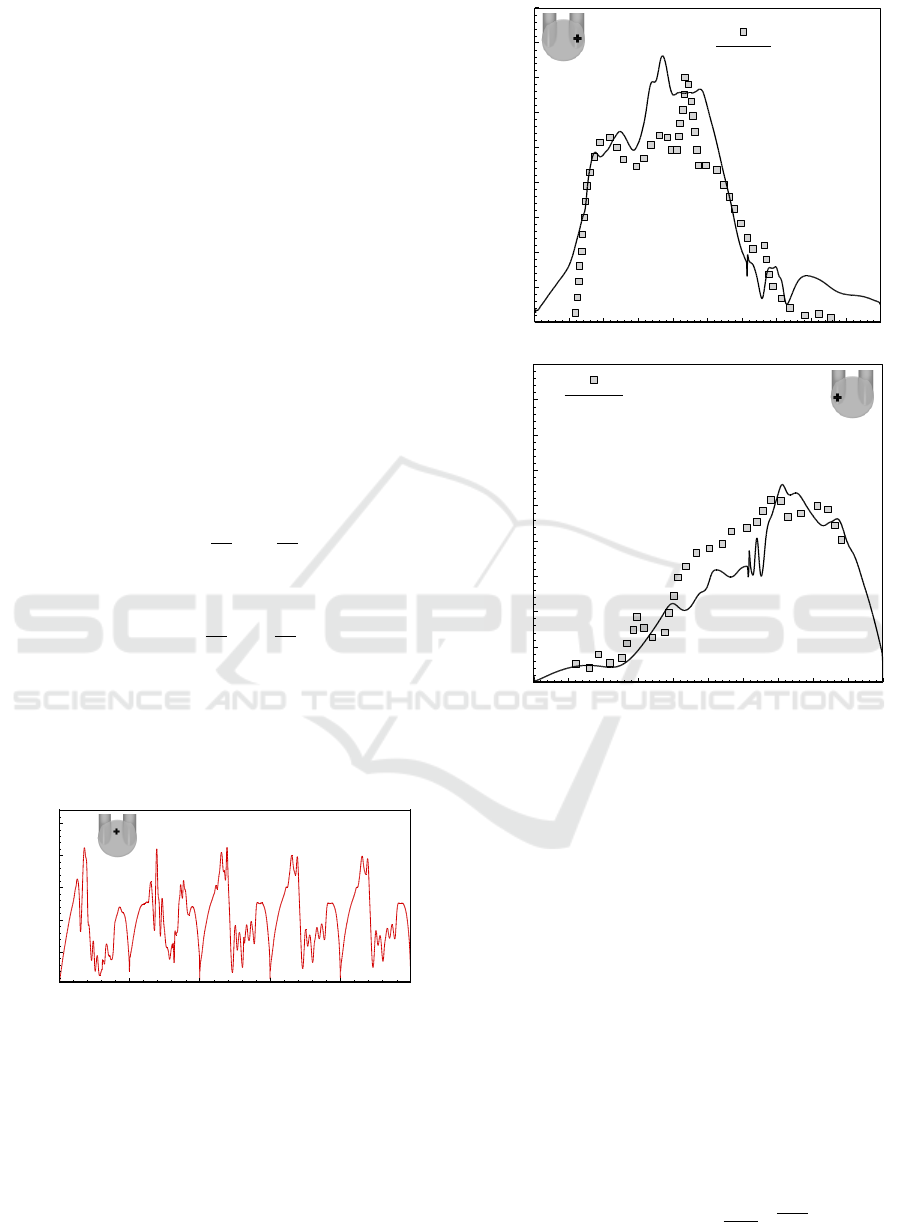
t/T
0 0.1 0.2 0.3 0.4 0.5 0.6 0.7 0.8 0.9 1
0 0.2 0.4 0.6 0.8
0
0.1
0.2
0.3
0.4
0.5
0.6
0.7
0.8
0.9
Experimental
EB-RSM : Carreau
V1
0 0.1 0.2 0.3 0.4 0 .5 0.6 0.7 0.8 0 .9 1
0 0.2 0.4 0.6 0.8
0
0.1
0.2
0.3
0.4
0.5
0.6
0.7
0.8
0.9
Experimental
EB-RSM : Carreau
(b)
Velocity (m/s)
t/T
Velocity (m/s)
(a)
Figure 6: Variation of velocity magnitude at (a) mitral port
and (b) aortic port.
using Pointwise CFD mesh generation software
(V16.04R4) from Pointwise Inc. (Pointwise, 2011)
and STAR-CCM+ 10.02 (StarCCM, 2015). Figure
2a shows the overset regions in an arbitrary posi-
tion. As alluded above, the overset mesh methodol-
ogy has been employed to simulate the valve closure.
To achieve that a small gap between the background
region and the valve should be left and the number of
cells should be fewer than four. In all present work
the number of cells is two and as a result the zero
gap algorithm will apply; Figure 2b. These cells and
the overset cells outside the background region will
be inactive during the simulation, as shown in Figure
2c, which illustrates the mesh after starting the sim-
ulation. Figure 4 depicts the variation of y-velocity
with mesh size for the EB-RSM model with the non-
Newtonian Carreau model. A near wall resolution
is assessed using the non-dimensional distance to the
first near-wall grid point, y
+
=
y
µ(|S|)
√
ρτ
w
; where y is
the distance from the first cell centre to the wall, ρ is
BIODEVICES 2016 - 9th International Conference on Biomedical Electronics and Devices
148
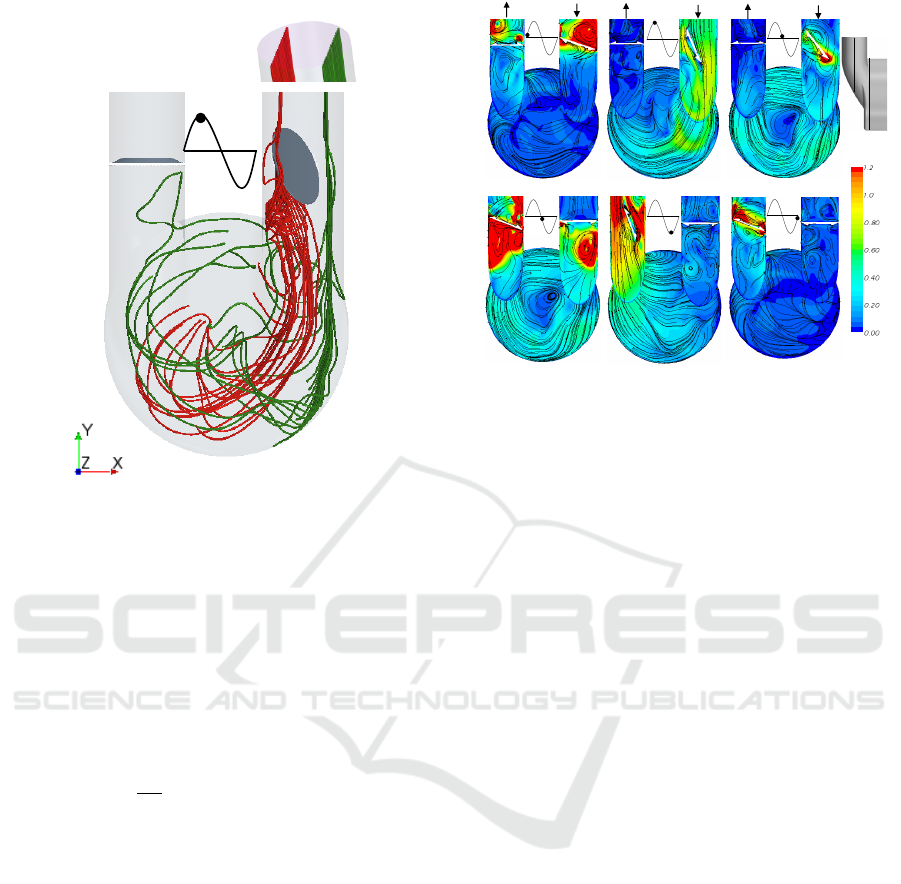
t/T=0.3
1 2
Figure 7: Snapshots of stream lines originated from line 1
and 2.
the density of blood, µ(|S|) is the blood viscosity, and
τ
w
is the wall shear stress; where a prism mesh with
six layers was used to resolve the boundary layer. In
all simulations this value was set to the recommended
value of y
+
≈1 for all locations inside the device. The
mesh MO4 is selected for the following simulations,
which is adequate to capture the properties of the flow
within the chamber and near the valves.
For transient simulations, the sensitivity to time
step was investigated. The Courant-Friedrichs-Lewy
number CFL =
U∆t
∆x
is employed during the simula-
tion, where U is the local cell velocity and ∆x is the
characteristic cell length scale. Generally, in the zone
of interest, CFL should be of the order of unity for
unsteady analysis. In the present study, different time
steps were tested with the same conditions, as a result,
the time step ∆t = 0.001s was found to be satisfac-
tory; resulting in a maximum CFL number of around
1 inside the chamber.
The numerical simulation was allowed to continue
until a time periodic flow was obtained, in order to ob-
tain a fully converged unsteady solution. In this study,
the simulation was run for 5 complete pump flow cy-
cles and the forth cycle has been chosen to extract the
data from the simulation. Figure 5 illustrates the his-
tory of velocity magnitude at point in the chamber.
t/T= 0.00428
t/T= 0.603
t/T= 0.314
t/T= 0.8
t/T= 0.619
t/T= 0.995
V1
V2
0 2 4 6 8
-1
-0.5
0
0.5
1
V1
V2
0 2 4 6 8
-1
-0.5
0
0.5
1
V1
V2
0 2 4 6 8
-1
-0.5
0
0.5
1
V1
V2
0 2 4 6 8
-1
-0.5
0
0.5
1
V1
V2
0 2 4 6 8
-1
-0.5
0
0.5
1
V1
V2
0 2 4 6 8
-1
-0.5
0
0.5
1
Velocity
(m/s)
Figure 8: Contour of velocity magnitude at centre of the
valves and z/z
c
= 0.21 from the front face of the chamber.
5 RESULTS AND DISCUSSION
5.1 Velocity Distribution
The setup of the current numerical simulation was
first validated by comparing the instantaneous flow
fields in the device against the available PIV exper-
imental data (Medvitz et al., 2009). The comparisons
include traces of instantaneous velocity magnitude at
extraction points in the chamber located at 25 percent
of the chamber’s radius from the wall on the plane
z/z
c
= 0.159 from the front face of the chamber.
Figure 6 depicts the comparison of velocity mag-
nitude at two points within the chamber; proximal to
the mitral port and to the aortic port as shown. The re-
sults from the EB-RSM turbulent model for the non-
Newtonian blood viscosity model are presented in this
figure. The RSM model has been chosen because it
accounts for more realistic transport, or history, of
three-dimensional effects as reported in our previous
study (Al-Azawy et al., 2016).
From the figure, it can be seen that there ia good
agreement with the experimental date, especially at
the beginning of the diastolic phase at the point prox-
imal to the mitral port, where the flow is injected
into the chamber over the moving valve (see Figure
6a). This is with the notable exception of the Car-
reau model at location t/T = 0.4 where the velocity
is higher. However, the simulation with valve rotation
gives better prediction than assuming a constant open
position. Again the velocity records a closer agree-
ment with the experimental data at the aortic port,
where the flow pumps towards the outlet port, during
the systole (Figure 6b).
An Overset Mesh Approach for Valve Closure: An LVAD Application
149
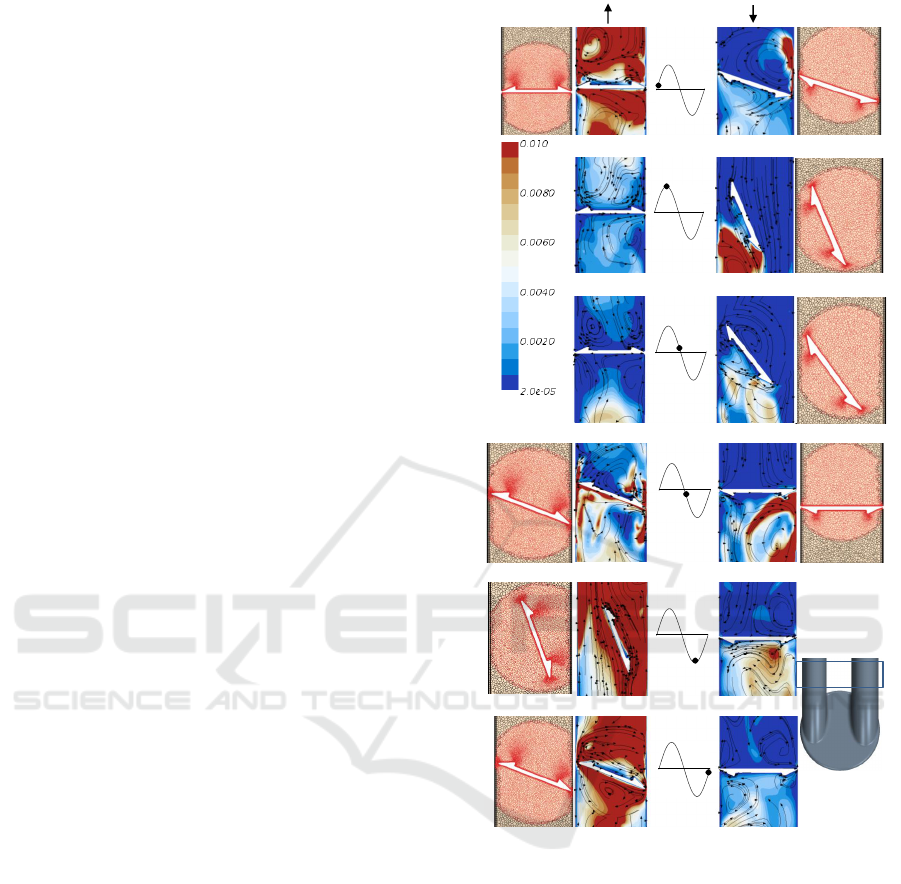
Figure 7 provides streamlines seeded from the in-
let surface towards the chamber through the mitral
valve. For the sake of clarity the streamlines origi-
nated from lines 1 and 2 in order to observe the com-
plexity of the flow behaviour behind the valve (see
line 1) and inside the chamber (see line 2).
Furthermore, to provide a more quantitative as-
sessment of the blood flow within the device, the ve-
locity contour through the valves and the chamber
with streamlines are provided in Figure 8.
5.2 Clinical Issues
Figure 9 displays the flow behaviour and turbulent
kinetic energy (TKE) at six points during the cycle,
corresponding to early, peak and late in diastole and
then systole. In this figure, the mesh configurations
are displayed with the valve rotation, where the black
mesh represents the background while the red mesh
represents the overset mesh. It is expected that the
flow behaviour and TKE would be highly sensitive to
valve rotation. In addition, this investigation is signif-
icant as the turbulence effects cause potential damage
to the blood cells. However, this is directly related
to the thrombus and haemolysis which are the main
causal risk associated with heart pumps.
6 CONCLUSIONS
Based on the validation with the experimental avail-
able data, it can be concluded that the overset mesh
zero gap technique can be used successfully for the
CFD simulation of blood pump. The present nu-
merical study was conducted to describe the non-
Newtonian, transient, and turbulent flow through an
LVAD, using an elliptic blending Reynolds stress
model. The overset mesh approach was employed for
both pusher plate movement and valve rotation within
the positive displacement pump. The zero gap tech-
nique was used to model the valve closure in order
to mimic the natural scenario of heart pump. The
TKE and velocity with streamlines were investigated
in various positions of valve during the rotation.
ACKNOWLEDGEMENTS
The financial support from the Higher Committee for
Education Development in Iraq and the University of
Wasit is gratefully acknowledged. The authors would
like to acknowledge the assistance given by IT Ser-
vices and the use of the Computational Shared Facil-
ity at The University of Manchester.
t/T= 0.00428
t/T= 0.603
t/T= 0.314
t/T= 0.8
t/T= 0.619
t/T= 0.995
V1
V2
0 2 4 6 8
-1
-0.5
0
0.5
1
V1
V2
0 2 4 6 8
-1
-0.5
0
0.5
1
V1
V2
0 2 4 6 8
-1
-0.5
0
0.5
1
V1
V2
0 2 4 6 8
-1
-0.5
0
0.5
1
V1
V2
0 2 4 6 8
-1
-0.5
0
0.5
1
V1
V2
0 2 4 6 8
-1
-0.5
0
0.5
1
TKE (m
2
/s
2
)
Figure 9: Snapshots of contour of turbulent kinetic energy
with mesh configuration.
REFERENCES
Al-Azawy, M. G., Turan, A., and Revell, A. (2015). Investi-
gating the Use of Turbulence Models for Flow Investi-
gations in a Positive Displacement Ventricular Assist
Device. 6th European Conference of the International
Federation for Medical and Biological Engineering,
45:395–398.
Al-Azawy, M. G., Turan, A., and Revell, A. (2016). Assess-
ment of turbulence models for pulsatile flow inside
a heart pump. Computer Methods in Biomechanics
and Biomedical Engineering, 19(3):271–285. PMID:
25816074.
Avrahami, I. (2003). The Effect of structure on the hemody-
namics of artificial heart pumps. PhD thesis, Tel-Aviv
University.
BIODEVICES 2016 - 9th International Conference on Biomedical Electronics and Devices
150

Bluestein, D., Rambod, E., and Gharib, M. (2000). Vortex
shedding as a mechanism for free emboli formation
in mechanical heart valves. Journal of biomechanical
engineering, 122(2):125–134.
Carreau, P. J. (1972). Rheological Equations from Molecu-
lar Network Theories. Journal of Rheology, 16(1):99–
127.
Johnston, B. M., Johnston, P. R., Corney, S., and Kilpatrick,
D. (2004). Non-Newtonian blood flow in human right
coronary arteries: steady state simulations. Journal of
biomechanics, 37(5):709–20.
Kiris, C., Kwak, D., Rogers, S., and Chang, I. (1997). Com-
putational approach for probing the flow through arti-
ficial heart devices. Journal of biomechanical engi-
neering, 119(4):452–460.
Kreider, J. W., Manning, K. B., Oley, L. a., Fontaine, A. a.,
and Deutsch, S. (2006). The 50cc Penn State left
ventricular assist device: a parametric study of valve
orientation flow dynamics. ASAIO journal (Ameri-
can Society for Artificial Internal Organs : 1992),
52(2):123–31.
Medvitz, R. B. (2008). Development and Validation of a
Computational Fluid Dynamic Methodology for Pul-
satile Blood Pump Design and Prediction of Throm-
bus Potential. PhD thesis, Pennsylvania State Univer-
sity, University Park, PA.
Medvitz, R. B., Kreider, J. W., Manning, K. B., Fontaine,
A. A., Deutsch, S., and Paterson, E. G. (2007). De-
velopment and validation of a computational fluid dy-
namics methodology for simulation of pulsatile left
ventricular assist devices. ASAIO journal (Ameri-
can Society for Artificial Internal Organs : 1992),
53(2):122–131.
Medvitz, R. B., Reddy, V., Deutsch, S., Manning, K. B., and
Paterson, E. G. (2009). Validation of a CFD method-
ology for positive displacement LVAD analysis us-
ing PIV data. Journal of biomechanical engineering,
131(11):111009 1–9.
Peskin, C. S. (2002). The immersed boundary method. Acta
Numerica, 11:479–517.
Pointwise (2011). Pointwise, Inc. Release 16.04R4 .
StarCCM (2015). CD-Adapco User Guide, STAR-CCM+
Version 10.02 .
Stijnen, J., de Hart, J., Bovendeerd, P., and van de Vosse,
F. (2004). Evaluation of a fictitious domain method
for predicting dynamic response of mechanical heart
valves. Journal of Fluids and Structures, 19(6):835–
850.
Stijnen, J. M. A. (2004). Interaction between the mitral and
aortic heart valve an experimental and computational
study. PhD thesis, Eindhoven University.
Yin, W., Alemu, Y., Affeld, K., Jesty, J., and Bluestein, D.
(2004). Flow-induced platelet activation in bileaflet
and monoleaflet mechanical heart valves. Annals of
biomedical engineering, 32(8):1058–1066.
An Overset Mesh Approach for Valve Closure: An LVAD Application
151
