
Epileptic Seizure Prediction in Scalp EEG using One Dimensional
Local Binary Pattern based Features
Thasneem Fathima
1
, Paul Joseph K.
1
and M. Bedeeuzzaman
2
1
Dept. of Electrical Engineering, National Institute of Technology, Calicut, Kerala, 673601, India
2
Dept. of Applied Electronics and Instrumentation, MES College of Engineering, Kuttippuram, Kerala, 679573, India
Keywords: Epilepsy, Seizure Prediction, Electroencephalogram, Local Binary Pattern, Classifier.
Abstract: Seizure prediction will deeply improve the quality of life of epileptic patients. In this paper, a new method
of automatic seizure prediction is presented using one dimensional local binary pattern (1D-LBP) based
features in scalp electroencephalogram (EEG). In the feature extraction stage, the preictal and interictal
EEG signals were transformed to the 1D-LBP domain and histogram features were extracted. These features
were submitted to two different types of classifiers: linear discriminant analysis (LDA) and support vector
machine (SVM). In order to reduce the false prediction rate (FPR), a simple post processing stage was also
incorporated. The classification using SVM showed improvement over LDA in terms of sensitivity,
prediction time and FPR. The proposed method was evaluated using the scalp EEG recording from 13
patients with a total number of 47 seizures. It could achieve a sensitivity of 96.15%, an average prediction
time of 51.25 minutes with an FPR of 0.463.
1 INTRODUCTION
Epilepsy is a common neurological ailment that is
characterized by a sudden and recurrent brain
discharges termed “seizure.” These seizures reflect
the clinical signs of an excessive and hyper
synchronous activity of neurons in the brain (Fisher
et al., 2005). The disturbance of consciousness and
sudden loss of motor control often occur without any
warning. Experiences of staring, walking aimlessly
or loss of awareness may be harmless if they occur
at home. However, it can be life threatening if they
occur while the patient is driving, crossing a busy
street or swimming. Epileptic patients may have
some physiological changes prior to seizure onset.
These changes include changes in heart rate,
increase in cerebral oxygenation and blood oxygen
levels (Kerem and Gena 2005; Adelson et al., 1999;
Federico et al. 2005).
Recent studies show some changes in
Electroencephalogram (EEG) indicative of an
upcoming seizure and thereby give credence to the
idea of predicting seizures. The ability to herald
epileptic seizures far enough in advance would
reduce patients anxiety, alleviate the constraints in
everyday life and will improve the quality of life
and safety of epileptic patients (Winterhalder et al.,
2003). Knowing in advance that a seizure will occur
will be helpful in developing new treatment
strategies. It may lead to the design of more
effective drugs for the disruption of the brain’s
preparedness for an oncoming seizure. The
prediction will help many individuals whose
epilepsy cannot be controlled by medications, or
who are not in a position to undergo epilepsy
surgery. Also, long-term treatment with antiepileptic
drugs, which may cause cognitive or other
neurological side effects, could be reduced to a
targeted and short-acting intervention. The
medications could be replaced by electrical
stimulation or drug infusion activated only during
the pre-seizure period. The state just before the
occurrence of the seizure is termed as the ‘preictal
state’ and the normal state of a patient as the
‘interictal state’. Identifying the preictal states based
on EEG has been the goal of many research studies
on epileptic seizure prediction.
Based on the placement of electrodes the EEG
can be classified into two: scalp and intracranial. In
the scalp EEG, the electrodes are placed over the
scalp whereas in intracranial EEG, the electrodes are
placed inside the scalp. In this case, neurosurgeons
typically implant strip, grid or penetrating depth
electrodes under the dura mater. The signals
Fathima, T., K., P. and Bedeeuzzaman, M.
Epileptic Seizure Prediction in Scalp EEG using One Dimensional Local Binary Pattern based Features.
DOI: 10.5220/0005623000250033
In Proceedings of the 9th International Joint Conference on Biomedical Engineering Systems and Technologies (BIOSTEC 2016) - Volume 4: BIOSIGNALS, pages 25-33
ISBN: 978-989-758-170-0
Copyright
c
2016 by SCITEPRESS – Science and Technology Publications, Lda. All rights reserved
25

recorded from intracranial EEG are on a different
scale of activity than the brain activity recorded
from scalp EEG. Scalp electrodes provide the global
information, whereas the intracranial one provides
the local information from the brain structure
(Cosandier-Rimélé et al., 2007). Low voltage or
high frequency components that cannot be seen
easily in scalp EEG can be seen clearly in
intracranial EEG. Also the scalp EEG is susceptible
to different types of artifacts and noise compared to
intracranial.
Several linear and nonlinear measures have been
reported in the literature to predict seizures from
intracranial EEG time series. Wavelet-based
nonlinear similarity index (Ouyang et al., 2007),
cross correlation and lyapunov exponents (Mirowski
et al., 2009), autoregressive coefficients (Chisci et
al., 2010), time, frequency and wavelet domain
features (Soleimani-B et al., 2012), mean absolute
deviation and wavelet entropy (Bedeeuzzaman et al.,
2012), spike rate (Li et al. 2013), statistical
dispersion measures (Bedeeuzzaman et al., 2014),
dominant amplitude and frequency components
(Wang and Lyu, 2014) are among the features
implemented in intracranial EEG. To make the
prediction techniques more clinically applicable,
methods based on scalp EEG have also been a
subject of research. Different features used for the
seizure prediction using scalp EEG include non
linear similarity (Quen et al., 2001), phase space
similarity measures (Hively and Protopopescu,
2003), average spiking rate (Schad et al., 2008),
phase synchrony measures (James and Gupta, 2009),
wavelet coherence values (Chiang et al., 2011),
variational Gaussian mixture model (Zandi et al.,
2011; Zandi et al., 2013), statistical moments and
spectral information (Direito et al., 2011) and
spectral power (Bandarabadi et al., 2012).
Local binary pattern (LBP) has been extensively
used for texture analysis of 2D images because of its
discriminative power. One dimensional local binary
pattern (1D-LBP), which is derived from LBP, has
been successfully applied to voice activity in speech
signals that are non-stationary in nature (Chatlani &
Soraghan 2010). So, it can be considered as an
effective approach of feature extraction of EEG
signals, which are inherently non-stationary (Kaya et
al. 2014).
The aim of this study is to develop a new
algorithm for prediction of epileptic seizures with
maximum possible sensitivity and prediction time.
In this paper, an algorithm based on 1D-LBP is
proposed to extract features from interictal and
preictal scalp EEG signals. These features are used
for the prediction of epileptic seizures. The proposed
scheme consists of two stages: extraction of features
from EEG signals and classification using the
extracted features. In the first stage, features are
extracted from interictal and preictal EEG signals. In
the classification stage, these features are applied to
two different classifiers: linear discriminant analysis
(LDA) and support vector machine (SVM). The
proposed method is tested on the scalp EEG dataset,
which is obtained from Massachusetts Institute of
Technology. Data from 13 epileptic patients with a
total number of 47 seizures are used in the present
study. The seizure prediction performance is
assessed in terms of sensitivity, prediction time and
false prediction rate (FPR).
Section 2 provides the details of the dataset used
and the proposed feature extraction method using
1D-LBP. In section 3, the performance of the
proposed system is evaluated by means of the results
obtained with the scalp EEG dataset. This section
includes the performance comparison with the
reported works using the same database. The paper
ends in Section 4 with some concluding remarks.
2 MATERIALS AND METHODS
2.1 Data used
The scalp EEG database used to evaluate the
prediction algorithm was recorded from patients
undergoing medication withdrawal for epilepsy
surgery evaluation in Children’s Hospital Boston
(Shoeb, 2009; Goldberger et al., 2000; CHB-MIT
Scalp EEG Database, 2015). Signals were recorded
with a sampling frequency of 256 Hz and 16-bit
resolution using the international 10-20 system of
electrode placement scheme. The seizures
experienced by the patients were judged by experts
and indicated the start and end of each seizure in the
EEG. The EEG data of each patient were segmented
into records of typically one hour duration. The
records containing one or more seizures are called
seizure records and those without seizures are
labeled as non-seizure records. Most of the EEG
files contain 23 channels whereas a few contain 24
or 26 channels.
2.2 Local Binary Pattern
The local binary pattern(LBP) was introduced by
Ojala et al., (1996) for the texture analysis, defined
as gray scale invariant texture measure, derived from
comparison with the local neighborhood. LBP has
BIOSIGNALS 2016 - 9th International Conference on Bio-inspired Systems and Signal Processing
26
also been used for face recognition, dynamic texture
recognition and shape localization (Guo et al.,
2010).
An LBP code for each pixel in a two
dimensional image is produced by thresholding the
neighboring values with the value of the center
pixel. The definition of LBP is extended to include
all circular neighborhoods with any number of
pixels. In general, LBP is denoted as LBP
P,R
where
P is the number of neighbors involved and R is the
radius of the model (Fig. 1).
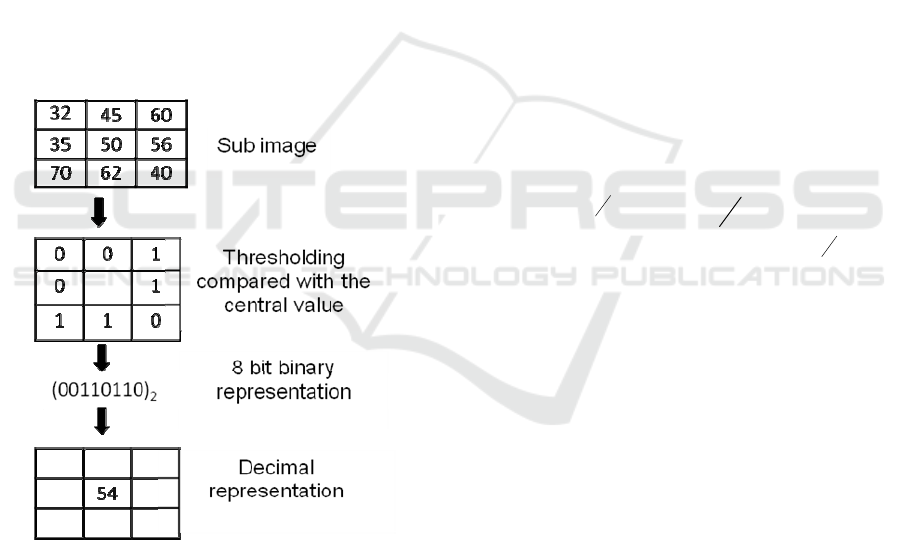
The basic version of LBP considers only eight
neighbors. As shown in Fig. 1, the LBP operator
labels each pixel, using the value of the center pixel
as a threshold value. Each pixel is assigned a value
1 if it is greater than or equal to the threshold value,
otherwise it takes 0. Thus the binary code is
produced using these values that gives the local
structural information around the given pixel. Each
pixel value is replaced with the decimal value
corresponding to this binary code (Chatlani and
Soraghan, 2010).
Figure 1: Calculation of LBP codes for a 3x3 sample
block. P=8, R=1.
Given a pixel in the image, an LBP is computed
comparing it with the local neighborhood.
() ()
i
zGv Gv=−
(1)
0
() ()2
P
i
i
LBP v S z
=
=
(2)
where the sign function S(.) is given by,
1, z 0
S(z)
0, z 0
≥
=
<
v
is the location of the center pixel,
i
v
is the
location of the
th
i
neighboring pixel,
(.)G
is the
pixel intensity value.
2.3 One Dimensional Local Binary
Pattern (1D-LBP)
1D-LBP was first introduced in (Chatlani and
Soraghan, 2010) for applying in speech signals
which are non stationary in nature. It is adapted from
the implementation steps in 2D LBP. The LBP code
for a neighborhood of sampled data is produced by
thresholding the neighboring samples against the
centre sample of a processing window. This
procedure is iteratively done across the entire signal
and a segment of the 1-D signal is alternatively
described by a sparser occurrence histogram of LBP
codes.
The 1-D LBP operating on a sample value
y[i] is
defined as
()
[]
[]
[]
[][][]
[]
<
≥
=
−+++
−−+
=
−
=
+
00
01
Where
21
2
2
][
1
2
0
2
, for y
, for y
yS
iyriyS
iy
P
riyS
iyLBP
P
r
P
r
r
P
(3)
Where P is the number of neighboring samples
thresholded around the centre sample from the
signal
][iy
of length N for
]2/:2/[ PNPi −=
. The sign function
[.]S
makes a P- bit binary code from these
differences. The decimal value of this binary code
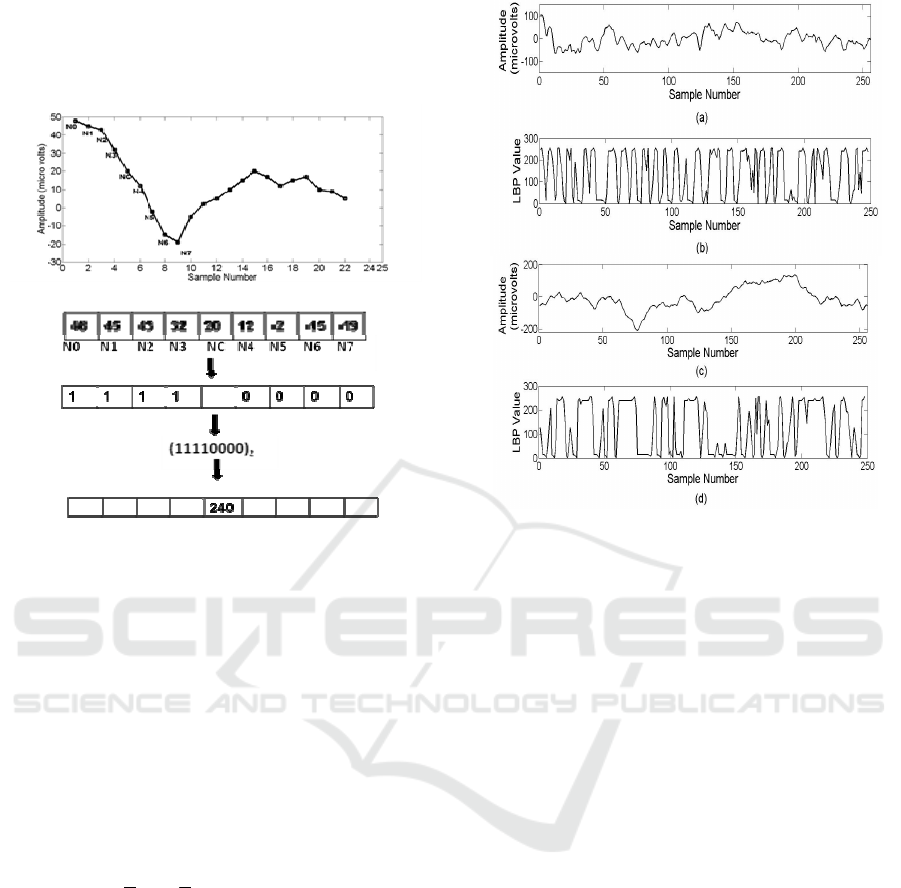
gives a unique LBP code. The 1D- LBP operator is
described step by step in Fig. 2 using a sample
segment of an EEG signal where P is set to 8. The
four neighboring samples taken before (N0, N1, N2,
N3) and after (N4, N5, N6, N7) are threshold against
the centre sample (NC). If the neighboring value is
greater than or equal to the center value, the
assigned value is 1, otherwise 0. Thus a binary code
of 11110000 is produced and the corresponding
decimal gives the LBP code 240. The LBP codes
represent the local structure information around the
given sample using the difference between the
sample and its neighbors. These differences cluster
near zero for constant or slowly varying signals
Epileptic Seizure Prediction in Scalp EEG using One Dimensional Local Binary Pattern based Features
27
whereas at peaks and troughs the differences will be
relatively large. At edges, the differences in some
directions will be larger than those from other
directions.
Figure 2: Computation of 1D local binary pattern.
LBP signal is formed by applying the above
procedure to all samples, which has values ranging
from 0 to 255. A segment of the interictal EEG
signal of 1 second duration of patient 1 is depicted in
Fig. 3 (a) and the corresponding LBP applied signal
is given in Fig. 3(b). Fig. 3(c) and Fig. 3 (d) shows
the values corresponding to one second of the
preictal EEG of first seizure of patient1.
The distribution of LBP can describe the local
patterns formed from
][iy
.
[]
()()
,
22
−≤≤
=
P
Ni
P
Pl
liyLBPH
δ
(4)
Where
nl ...2,1=
and
n
is the number of
histogram bins and
()
ji,δ
is the Kronecker delta
function. The occurrences of each LBP code are
plotted as a histogram. The numbers of occurrences
corresponding to 8 histogram bins are selected as the
features for classification between interictal and
preictal signals.
Figure 3: (a) A 1-second segment of interictal EEG signals
of patient 1. (b) Interictal signal transformed to LBP
domain, which has values ranging from 0 to 255. (c) A 1-
second segment of preictal EEG signal from the first
seizure of patient 1. (d) Preictal signal transformed to LBP
domain.
3 RESULTS
The purpose of this study is to extract the
representative features from EEG by utilizing the
potential of 1D-LBP for the prediction of epileptic
seizures. The EEG classification system using the
proposed 1D-LBP based feature extraction is
depicted in Fig. 4. The raw EEG signals were given
as the input to the classification system and the
output was the classified EEG pattern. The features
were extracted over the non overlapping frames of 1
minute length. Firstly the EEG signal in the time
domain is transformed into the LBP domain through
the process described in section 2.3.
The histogram of LBP codes is produced as an
alternative representation of the signal. The numbers
of occurrences of the LBP values in 8 histogram
bins are selected as the discriminating features. For
23 channels, this feature vector is of dimension 23x8
for each frame. In order to reduce the feature
dimension, averaging is done across the channels,
reducing the dimension to 1x8 for one frame.
Sample histogram features, averaged across 23
channels for patient1 for 1 minute data is given in
BIOSIGNALS 2016 - 9th International Conference on Bio-inspired Systems and Signal Processing
28
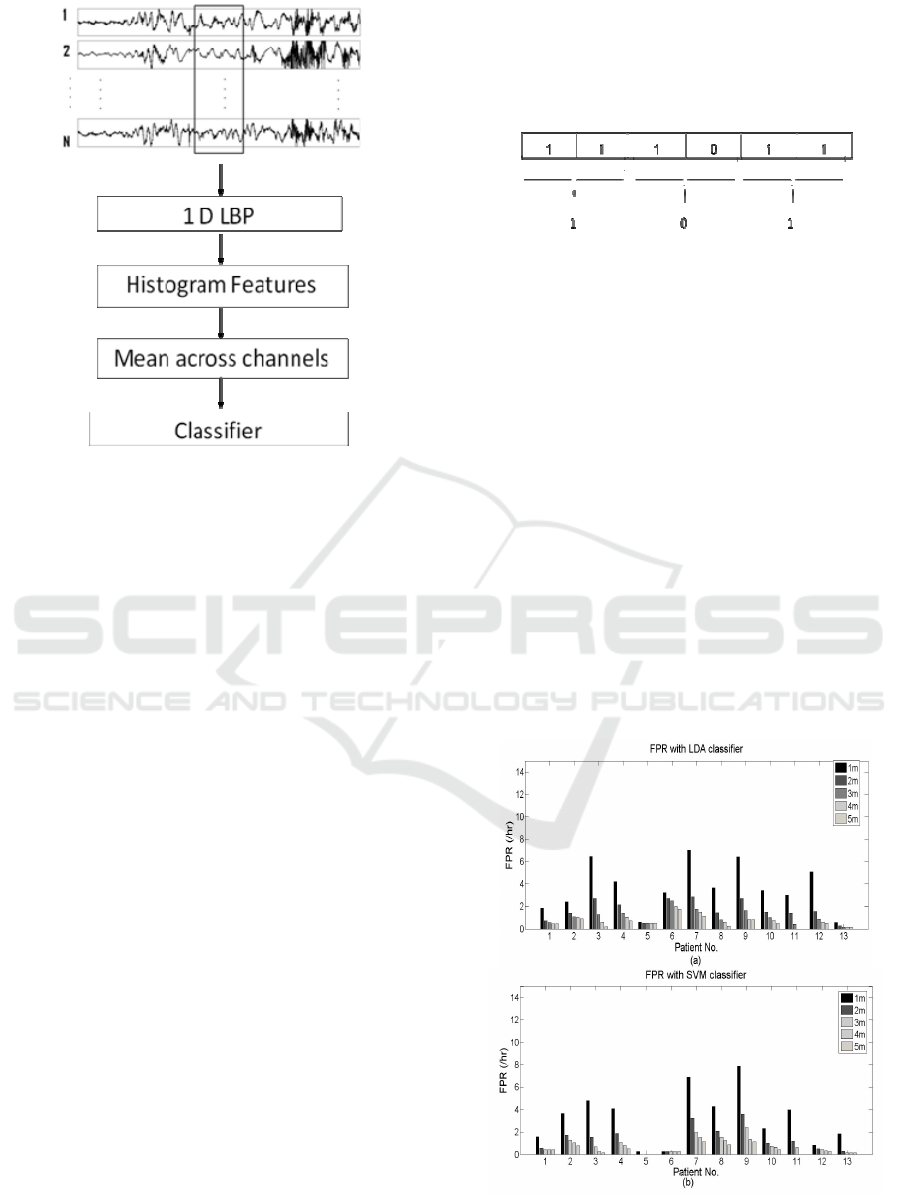
Figure 4: Schematic of the EEG classification system.
Table1. These values show a significant difference
in magnitude and were given as input to the
classifier.
In the classification stage, the 1D-LBP based
features are applied to a classifier, for the
classification between interictal and preictal EEG
signals. Here the performances of the proposed
method are evaluated using two different classifiers:
Linear Discriminant Analysis (LDA) and Support
Vector Machine (SVM).
Only those seizures with at least one hour
preictal data are considered for the study. In the case
of seizures occurring without much time gap, only
the first seizure is considered for the prediction.
Hence, the evaluation of the algorithm is done on
13 patients and 47 seizures that satisfy this
condition. The number of seizures used for training
and testing is given in Table 2. For example in the
case of patient number 5 (P5), 2 seizures are used
for training and 2 for testing. The one hour interval
preceding each seizure onset has been used to
produce training and test samples.
During classification, the labels ‘0’ and ‘1’ are
assigned for interictal and preictal data respectively.
Whenever a change from ‘0’ to ‘1’ occurs, the
prediction system will raise an alarm. If the alarm is
in the preictal period, it is considered as prediction
and if it is in the interictal period, taken as false
prediction. The one hour preictal period prior to
each seizure under test is considered to evaluate the
prediction. Prediction time is taken as the time gap
between the first alarm and the seizure onset. The
interictal data is tested to check whether it gives any
misclassification. A simple post processing stage has
also been incorporated to reduce the FPR. In the post
processing phase, consecutive ‘1’ labels are
searched for giving a ‘1’ in the output (Fig. 5).
Figure 5: Post processing scheme for 2- minute window:
Two consecutive ‘1’ labels give a ‘1’ in the output.
The performance of the prediction system is
analyzed in terms of sensitivity, prediction time and
FPR. Sensitivity and prediction time for each patient
using LDA classifier is given in Table 2. For patient
5, 2 seizures were used for testing and 2 for training.
The algorithm with a 1-minute window correctly
predicted the two tested seizures, thus exhibited
100% sensitivity. The average prediction time
(APT) of the 2 tested seizures for patient 5 is found
to be 59 minutes. As the algorithm using 1-minute
window predicted all the tested seizures of all the
patients, an average sensitivity of 100% achieved.
Also, the average APT with a 1-minute window
width was 57.08 minutes. FPRs of each patient for 1,
2, 3, 4 and 5 minute window widths are shown in
Fig. 6(a). Although the results are good in terms of
sensitivity and prediction time, the average FPR for
1 minute window width was 3.69, which is a bit high
Figure 6: (a) FPR for each patient for different window
widths using LDA classifier (b) FPR for each patient for
different window widths using SVM classifier.
Epileptic Seizure Prediction in Scalp EEG using One Dimensional Local Binary Pattern based Features
29

Table 1: Sample features extracted for one minute EEG of patient 1.
Class Bin1 Bin2 Bin3 Bin4 Bin5 Bin6 Bin7 Bin8
Preictal 5027 851 228 752 545 350 855 23
Interictal 4126 1038 259 961 759 392 1016 25
Table 2: Sensitivity and prediction time using 1D-LBP based features and LDA classifier for different window widths. SE-
Sensitivity, APT- Average prediction time, NS-Number of seizures.
Patient No.
NS for training
NS for testing
Window width in minutes
1 2 3 4 5
SE
(%)
APT
(min)
SE
(%)
APT
(min)
SE (%)
APT
(min)
SE
(%)
APT
(min)
SE
(%)
APT
(min)
P1 2 2 100 59 100 58 100 57 100 56 100 55
P2 1 1 100 58 100 56 100 54 100 52 100 50
P3 3 1 100 59 100 58 100 57 100 56 100 55
P4 1 1 100 59 100 58 100 57 100 56 100 55
P5 2 2 100 59 100 58 100 57 100 56 100 55
P6 5 4 100 59 100 46.5 100 42 100 41 50 53.3
P7 2 1 100 38 0 - 0 - 0 - 0 -
P8 2 2 100 59 100 58 100 57 100 56 100 37.5
P9 2 2 100 59 50 58 50 57 50 56 50 30
P10 2 1 100 58 100 56 100 54 100 48 100 45
P11 2 1 100 59 100 58 100 57 100 56 100 50
P12 2 1 100 59 100 58 100 57 100 56 100 55
P13 1 1 100 57 100 56 100 45 100 44 100 45
Average 100 57.08 88.46 56.41 88.46 54.00 88.46 52.45 84.61 50.25
Table 3: Sensitivity and average prediction time using 1D-LBP based features and SVM classifier for different window
widths. NS- Number of seizures, SE- Sensitivity, APT- Average prediction time.
Patient
No.
Window width in minutes
1 2 3 4 5
SE
(%)
APT
(min)
SE
(%)
APT
(min)
SE
(%)
APT
(min)
SE
(%)
APT
(min)
SE
(%)
APT
(min)
P1 100 59 100 58 100 52.5 100 52 100 50
P2 100 58 100 56 100 54 100 48 100 45
P3 100 59 100 58 100 57 100 56 100 55
P4 100 59 100 58 100 57 100 56 100 55
P5 100 59 100 58 100 57 100 56 100 55
P6 100 56.25 100 46.5 100 44.5 100 43.25 100 40
P7 100 59 100 58 100 57 100 56 100 55
P8 100 59 100 58 100 57 100 56 100 55
P9 100 46 50 58 50 57 50 44 50 20
P10 100 59 100 58 100 57 100 56 100 55
P11 100 59 100 58 100 57 100 56 100 50
P12 100 59 100 58 100 57 100 56 100 55
P13 100 57 100 56 100 45 100 44 100 45
Average 100 57.55 96.15 56.70 96.15 54.33 96.15 52.94 96.15 51.25
for seizure prediction. The FPR for each patient,
given in Fig. 6 (a), shows a decrease in FPR with
respect to the increase in window width. Sensitivity
and APT using the SVM classifier, given in Table 3,
show a slight increase compared to the method using
LDA classifier. The FPR using the SVM classifier
BIOSIGNALS 2016 - 9th International Conference on Bio-inspired Systems and Signal Processing
30

for each patient is given in Fig. 6(b) and shows a
small decrease compared to the other one.
Comparison of average sensitivity, average APT and
average FPR using LDA and SVM classifier is
depicted in Fig. 7. The SVM classifier shows
improvement in all the three parameters of
evaluation, compared to the LDA classifier.
4 DISCUSSION
A seizure prediction method based on 1D-LBP in
scalp EEG has been presented in this paper. The
comparison of prediction time and sensitivity
obtained using 5 minute window width and SVM
classifier with other methods using the same dataset
is given in Table 4. Wavelet coherence values were
used as features and tested on 7 patients from the
same dataset in (Chiang et al., 2011). They could
predict seizures of 4 patients out of 7, giving a
sensitivity of 57.14%, but it didn’t report the
prediction time and FPR. Another algorithm using
the variational Bayesian Gaussuan mixture model
for prediction was tested on 3 patients of the dataset
in (Zandi et al., 2011). Compared to this, the
proposed work which is experimented with 13
patients shows an improvement in sensitivity from
83.8% to 96.15%. Also, APT is increased from 19.8
to 51.25 minutes. But the FPR reported in (Zandi et
al., 2011) is 0.165 whereas in this work it is 0.463.
An increased window width may help to decrease
the FPR. But it will affect the sensitivity and
prediction time. Though the increased FPR obtained
in the proposed work can be ascribed to the
increased number of patients in contrast to the 3
patients used in (Zandi et al., 2013), this has to be
reduced to make the method useful for real life
situations.
Table 4: Comparison of results with other methods using
same dataset.
Method Feature
No. of
patients
analysed
APT
(minutes)
Sensitivity
(%)
(Chiang et
al. 2011)
Wavelet
coherence
values
7 - 57.14
(Zandi et al.
2013)
Gaussian
Mixture Model
3 19.8 83.8
Proposed
method
1D-LBP
Based
13 51.25 96.15
To the best of authors’ knowledge, the only work
reported in EEG signal analysis that used 1D-LBP is
(Kaya et al., 2014). This work was for the epileptic
seizure detection, a retrospective analysis of EEG
signals to find out the seizure that has already
happened. Whereas, in the proposed work 1D-LBP
is used for epileptic seizure prediction which
involves the analysis of EEG signals for an
oncoming seizure well before its occurrence.
Even though the proposed method is developed
for noninvasive scalp EEG, it may also be used for
the intracranial EEG recordings. As the artifacts and
noise will be less in the intracranial EEG, a better
performance can be anticipated when applied to
depth recording.
As the method presented in this paper used the
data for training and testing for the same patient, the
algorithm can predict only the seizures of a patient
whose prior database is already available. Therefore,
more studies should be performed by incorporating
new features to make a patient independent method.
Also the data used for this study was acquired from
patients under medical care in hospitals. So to
broaden the utility of the proposed method, it has to
be applied to the continuous data recorded during
routine daily activities.
Figure 7: Performance comparison of classifiers: LDA and SVM. (a) Average Sensitivity (b) Average APT (c) Average
FPR.
Epileptic Seizure Prediction in Scalp EEG using One Dimensional Local Binary Pattern based Features
31

5 CONCLUSIONS
A new patient specific seizure prediction algorithm
based on 1D-LBP in scalp EEG has been proposed
in this study. The idea is to classify between preictal
and interictal EEG using appropriate features. For
this purpose, histogram features are extracted from
the 1D-LBP applied signal. These features are
submitted to two different classifiers: LDA and
SVM. In order to reduce the false alarms, a simple
post processing is also incorporated. The
classification using SVM shows improvement over
LDA in terms of sensitivity, prediction time and
FPR. When this algorithm is applied to scalp EEG
recordings from 13 patients with a total number of
47 seizures, it could achieve a sensitivity of 96.15%,
an APT of 51.25 minutes with an FPR of 0.463.
Comparison with the previous works using the same
database shows improvement in terms of APT and
sensitivity.
REFERENCES
Adelson, P. D., Nemoto, E., Sheuer, M., Painter, M.,
Morqan, J., Yonas, H., 1999, ‘Noninvasive continuous
monitoring of cerebral oxygenation preictally using
near-infrared spectroscopy: A preliminary report’,
Epilepsia,vol. 40, pp. 1484-1489.
Bandarabadi, M., Teixeira, C. A., Direito, B., Dourado,
A., 2012, ‘Epileptic Seizure Prediction based on a
bivariate spectral power methodology’, Conf. Proc.
IEEE Eng. Med. Biol. Soc. 2012, 5943-5946.
Bedeeuzzaman, M., Fathima, T., Khan, Y. U., Farooq, O.,
2012. Mean absolute deviation and wavelet entropy
for seizure prediction. J. Med. Imag. Health. Inform. 2,
238-243.
Bedeeuzzaman, M., Fathima, T., Khan, Y. U., Farooq, O.,
2014. Seizure prediction using statistical dispersion
measures of intracranial EEG. Biomed. Signal.
Process. Control. 10, 338-341.
Chatlani, N., Soraghan, J. J., 2010. Local binary patterns
for 1-D signal processing. 18
th
Europian Signal
Process. Conf. Denmark, 95-99.
CHB-MIT Scalp EEG Database. Available from: < http://
physionet.org/physiobank/database/chbmit>. (10
February 2015).
Chiang, C-Y., Chang, N. F., Chen, T. C., Chen, H. H.,
Chen, L. G., 2011. Seizure Prediction Based on
Classification of EEG Synchronisation Patterns with
On-line Retraining and Post-Processing Scheme. Conf.
Proc. IEEE Eng. Med. Biol. Soc. 2011, 7564-7569.
Chisci, L., Mavino, A., Perferi, G., Sciandrone, M., Anile,
C., Colicchio, G., Fuqqetta, F., 2010. Real time
epileptic seizure prediction using AR models and
Support Vector Machine. IEEE Trans. on Biomedical
Eng. 57, 1124-1132.
Cosandier-Rimélé, D., Badier, J.M., Chauvel, P.,
Wendling, F., 2007. Modeling and interpretation of
scalp-EEG and depth-EEG signals during interictal
activity. Proc. 29th Annual Int. Conf. IEEE EMBS.
4277-4280.
Direito, B., Ventura, F., Teixeira, C., Dourado, A., 2011.
Optimized Feature Subsets for Epileptic Seizure
Prediction Studies. Conf. Proc. IEEE Eng. Med. Biol.
Soc. 2011 1636-1639.
Federico, P., Abbott, D. F., Briellmann, R. S., Harvey, A.
S., Jackson, G. D., 2005. Functional MRI of the pre-
ictal state. Brain.128, 1811-1817.
Fisher, R. S., Boas, W. E. , Blume, W., Elger, C., Genton,
P., Lee, P., Engel, J. Jr., 2005. Epileptic Seizures and
Epilepsy: Definitions Proposed by the International
League Against Epilepsy (ILAE) and the International
Bureau for Epilepsy (IBE). Epilepsia. 46, 470-472.
Goldberger, A. L., Amaral, L. A. N., Glass, L.,
Hausdorff, J. M., Ivanov, P. C., Mark, R. G., Mietus,
J. F., Moody, G. B., Peng, C.-K., Stanley, H. E. 2000.
Physiobank, physiotoolkit, and physionet:
Components of a new research resource for complex
physiologic signals. Circ. 101, e215-e220.
Guo, Z., Zhang, L., Zhang, D., 2010. A completed
modeling of local binary pattern operator for texture
classification. IEEE Trans. image process. 19, 1657-
1663.
Hively, L., Protopopescu, V., 2003. Channel-consistent
forewarning of epileptic events from scalp EEG. IEEE
Trans. Biomed. Eng. 50, 584-593.
James, C. J., Gupta, D., 2009. Seizure prediction for
epilepsy using a multi-stage phase synchrony based
system. Conf. Proc. IEEE Eng. Med. Biol. Soc. 2009,
25-28.
Kaya, Y., Uyar, M., Tekin, R., Yildirim, S., 2014. 1D-
local binary pattern based feature extraction for
classification of epileptic EEG signals. Appl.
Mathematics. Computation. 243, 209-219.
Kerem, D. H., Geva, A. B., 2005. Forecasting epilepsy
from the heart rate signal, Med. Biological Eng.
Computing. 43, 230-239.
Li, S., Zhou, W., Yuan, Q., Liu, Y., 2013. Seizure
Prediction Using Spike Rate of Intracranial EEG.
IEEE Trans. Neural Systems. Rehabilitation. Eng. 21,
880-886.
Mirowski P. W., Madhavan, D., LeCun, Y., Kuzniecky,
R., 2009. Classification of patterns of EEG
synchronization for seizure prediction. Clinical.
Neurophysiol. 120, 1927-1940.
Ojala, T., Pietikäinen, M., Harwood, D., 1996. A
comparative study of texture measures with
classification based on feature distributions. Pattern.
Recognit. 29, 51-59.
Ouyang, G., Li, X., Li, Y., Guan, X., 2007. Application of
wavelet-based similarity analysis to epileptic seizures
prediction. Computers. Biol. Med. 37, 430 – 437.
Quen, M. L. V, Martinerie, J., Navaro, V., Boon, P.,
D’Havé, M., Adam, C., Renault, B., Varela, F.
Baulac, M., 2001. Anticipation of epileptic seizures
from standard EEG recordings. Lancet, 357, 183-188.
BIOSIGNALS 2016 - 9th International Conference on Bio-inspired Systems and Signal Processing
32

Schad, A., Schindler, K., Schelter, B., Maiwald, T.,
Brandt, A., Timmer, J., Bonhage, A. S., 2008.
Application of a multivariate seizure detection and
prediction method to no-invasive and intracranial
long-term EEG recordings. Clin. Neurophys. 119, 197-
211.
Shoeb, A. Application of machine learning to epileptic
seizure onset detection and treatment. Ph. D.
dissertation, Massachusetts Inst. Techno. Cambridge,
Sep. 2009.
Soleimani-B., H., Lucas, C., Araabi, B. N., Schwabe, L.,
2012. Adaptive prediction of epileptic seizures from
intracranial recordings. Biomed. Signal Process.
Control, 7, 456 464.
Wang, N., Lyu, M. R., 2014. Extracting and Selecting
Distinctive EEG Features for Efficient Epileptic
Seizure Prediction. IEEE J. Biomed. Health. Inform,
doi: 10.1109/JBHI.2014.2358640.
Winterhalder M., Maiwal, T., Voss, H. U.,
Aschenbrenner-Scheibe, R., Timmer, J., Schulze-
Bonhage, A., 2003. The seizure prediction
characteristic: A general frame work to assess and
compare seizure prediction methods. Epilepsy.
Behave.4, 318-325.
Zandi, A. S., Tafreshi, R., Javidan, M., Dumont, G. A.,
2013. Predicting Epileptic Seizures in Scalp EEG
Based on a Variational Bayesian Gaussian Mixture
Model of Zero-Crossing Intervals. IEEE Trans.
Biomed. Eng., 60, 1401-1413.
Zandi, A. S., Dumont, G. A., Javidan, M., Tafreshi, R.,
2011 Epileptic Seizure Prediction using Variational
Mixture of Gaussians. Conf. Proc. IEEE Eng. Med.
Biol. Soc. 2011, 7549-7569.
Epileptic Seizure Prediction in Scalp EEG using One Dimensional Local Binary Pattern based Features
33
