
Can e-Commerce Recommender Systems be More Popular with
Online Shoppers if they are Mood-aware?
Fanjuan Shi
1,2
and Jean-Luc Marini
2
1
Shanghai Unicore Technology of IOT Co., Ltd, Shanghai, China
2
Search’XPR SAS, Clermont-Ferrand, France
Keywords: Mood Recognition, e-Commerce Recommender System, Behavioral Data Mining, User-centric Systems.
Abstract: This paper presents the result of a controlled experiment studying how mood state can affect the usage of e-
commerce recommender system. The authors develop a mood recognition tool to classify online shoppers
into stressed or relaxed mood state unobtrusively. By analyzing their reactions to recommended products
when surfing on an e-commerce website, the authors make two conclusions. Firstly, stress negatively
impacts the usage of recommender system. Secondly, relaxed users are more receptive to recommendations.
These findings suggest that mood recognition tool can help recommender systems find the “right time” to
intervene. And mood-aware recommender systems can enhance marketer-consumer interaction.
1 INTRODUCTION
As the demand for user-centric web service rises,
recognizing users’ mood in real time becomes more
and more important. Researchers have proposed
various methods to detect users’ mood. These
methods include vocal signal analysis (Koolagudi
and Rao, 2012), facial expression analysis (Fridlund,
2014), physiological indicators analysis (Silva et al.,
2009), content-based semantic analysis (Baldoni et
al., 2012), user input analysis (Khan et al., 2013),
and hybrid solutions (Sebe et al., 2006). Mood-
aware systems can not only analyze and identify
users’ mood in real time, but also take such context
into account and propose correspondent service to
users in the “right time”, a moment when users are
more receptive to these services. In practice, mood-
aware systems have been integrated into video
games (Ambinder, 2011), online learning systems
(D’Mello et al., 2008; Mao and Li, 2009),
productivity software (Bailey and Konstan, 2006)
and other interactive computer systems (Kolakowska
et al., 2013).
This paper focuses on applying mood recognition
to e-commerce recommender systems, where few
attention has been paid to users’ real time mood
states. In view of the European consumer privacy
protection regulations, users’ clickstream data was
chosen as the data source for analysis. In Section II,
we briefly review the main research topics and
methods of mood recognition with computer users.
Section III proposes our hypothesis, theoretical
framework and a two-phased experiment approach.
Section IV presents our experiment setting and
result. Section V discusses about how to apply our
findings to e-commerce and online marketing.
Section VI concludes the paper and provides
suggestions for future research.
This paper add value to the research of context-
aware recommender systems in three aspects.
It proposes a mood recognition tool which can
recognize website users’ mood state.
It confirms that mood state affects users’
reaction to the recommendations.
It proves that recommendations of mood-
aware system are more popular with online
consumers.
These findings can help marketers to find new
technics to satisfy online consumers and enhance the
interaction between marketer and consumer.
2 RELATED WORKS
Recognizing users’ mood is not a novel concept. The
discussion about mood recognition is associated
with four major aspects: How to define mood?
Should mood be elicited? Which kinds of behavioral
Shi, F. and Marini, J-L.
Can e-Commerce Recommender Systems be More Popular with Online Shoppers if they are Mood-aware?.
In Proceedings of the 12th International Conference on Web Information Systems and Technologies (WEBIST 2016) - Volume 2, pages 173-180
ISBN: 978-989-758-186-1
Copyright
c
2016 by SCITEPRESS – Science and Technology Publications, Lda. All rights reserved
173

indicators to choose? How to associate behavioral
indicators with mood?
2.1 Defining Mood
Mood can be referred as a specific emotion or state
of mind (Lane and Terry, 2000). In general,
researchers follow two different tracks to recognize
users’ mood.
In the first track, researchers encourage users to
describe their mood state with their own mood
taxonomy (Lee et al., 2012), and there is no limit on
how many types of mood they can report (Epp et al.,
2011). The advantage of this approach is that it helps
to better understand individual level and complex
mood states. However, aggregating users’ feedbacks
and making general conclusions can be challenging
as taxonomy of mood are not standardized across
users.
In the second track, the taxonomy of mood is
predefined by researchers. Sometimes the taxonomy
is exhaustive. One of the example is to define mood
as “positive, neutral or negative” (Zimmermann et
al., 2006; Khanna and Sasikumar, 2010). In other
cases, researchers are interested in some specific
moods such as sadness, fear, anger, surprise, or
happiness (Lv et al., 2008). Consequently, their
taxonomy of mood is non-exhaustive. As predefined
taxonomy provides a standard to compare and
classify the mood state of different users, it has been
widely used by researchers who want to recognize
and classify mood state of a group of users.
2.2 Eliciting Mood
Depending on the role of researchers in the
experiment, the methods to study mood state can be
classified into two groups.
In the first group, researchers play the role of
observers. There is no stimulus to affect users’ mood
state. During the experiments, users’ mood state are
evaluated either by users themselves (Lee et al.,
2012), or by trained assessors in an unobtrusively
manner (Sottilare and Proctor, 2012). These methods
allow researchers to associate moods with different
kinds of behavioral features.
In the second group, various stimuli are used by
researchers to elicit desired mood state. For
example, requesting users to watch a video (Maehr,
2005; Zimmermann et al., 2006) or listen to a story
(Lv et al., 2008) can provoke mood. Giving users
challenging tasks (Vizer et al., 2009) or interrupting
them when they are working (Epp et al., 2011) can
cause stress. These methods help researchers verify
whether certain behavioral features are universal
across different users under a given mood state.
2.3 Selecting Behavioral Indicators
As mood might affect behavior, it is necessary to
record users’ behaviors for further analysis. Users’
behavioral data is represented by a multi-dimension
vector. Each dimension stands for a type of behavior
indicator defined by the researchers. In the
computer-assisted experiments, keystroke and
mouse activities are commonly used by researchers
as behavioral indicators (Zimmermann et al., 2003;
Salmeron-Majadas et al., 2014).
Keystroke behavior indicators are associated
with frequency, speed, and strength and idle time.
Frequency indicators measures how often a key is
used. Speed indicators measures how fast users type
on the keyboard. They measure the duration of a
keystroke, the duration between two keystrokes, or
the average number of keystrokes in a given time
interval. Strength measures how much pressure users
put on the keyboard (Lv et al., 2008). Idle time
measures the interval time between two input
sequences. As moods might affect users’ keystroke
behavior, these behavioral indicators might help
researchers to recognize users’ mood state (Khanna
and Sasikumar, 2010). For example, frequent usage
of such keys as “Esc”, “Alt+F4”, “Backspace” and
“Delete” might suggest that users are stressed; surge
of keystroke strength might indicate that users are
undergoing an extreme mood state.
Similar as keystrokes, mouse activity indicators
might also be helpful to pinpoint users’ mood states
(Zimmermann et al., 2003; Lee et al. 2012). Mouse
activity indicators are associated with click, scroll
and travel behaviors, which can be captured by
mouse tracking computer programs (Salmeron-
Majadas et al., 2013). Frequency indicators measure
how many clicks, scrolls and mouse moves are made
by users, and magnitude indicators measure click
speed, mouse traveling distance and web page
movements.
Another source of behavioral indicator is
clickstream data. Clickstream data are digital records
of users’ online behaviors in a chronological order
(Montgomery et al., 2004). As the data collecting
process is unobtrusive, detailed and automatic
(Bucklin and Sismeiro, 2009), clickstream data are
considered a reflection of users’ interests (Chen and
Su, 2013) and behavior (Olbrich and Holsing, 2011).
With the help of clickstream data, researchers are
able to reconstitute users’ behavioral sequences and
find out when and where behaviors are affected by
WEBIST 2016 - 12th International Conference on Web Information Systems and Technologies
174
mood states, which can potentially make mood
recognition more accurate.
2.4 Recognizing Mood
Various data classification methods such as
statistical analysis (Maehr, 2005), k-nearest
neighbours algorithms (Lv et al., 2008), discriminant
analysis (Vizer et al., 2009), support vector machine
(Vizer et al., 2009), decision tree model (Epp et al.,
2011), Bayesian network (Lee et al., 2012), and
artificial neural networks model (Khanna et al.,
2010) can be used to recognize users’ mood state.
Researchers selected methods based on the size of
samples, the type of behavioral indicator (i.e. raw
data or normalized data) and the number of moods to
by detected, so as to achieve a higher accuracy.
3 HYPOTHESIS AND RESEARCH
METHOD
3.1 Hypothesis
Our research is originated from a fundamental
question: “Can e-commerce recommender systems
be more popular if they are mood-aware?”
In the online shopping context, stress might be
one of the most important mood to consider. The
reasons are simple. Firstly, stress relief is one of the
key motivations for shopping (Arnold and Reynolds,
2003). Secondly, online shoppers are often frustrated
or confused by the excessive information displayed
on an e-commerce website. Such information
overload can create cognitive stress, which becomes
a major source of stress (Vizer et al., 2009).
Research suggests that stress can prevent us from
accepting external stimuli. Human brains can only
focus on a limited number of things at a time
(Horvitz et al., 2003). When we receive an external
stimulus, our brain quickly evaluates its relevance to
our current task, and decides whether we should
ignore or attend to it. In a stressed mood state, our
brain has less spare capacity to deal with external
stimuli. In such circumstance, recommendations are
more likely to be ignored without assessment.
E-commerce recommendations attract users’
attention by interrupting their current task with a
visual stimulus. Therefore, users’ reaction to
recommendations could be affected by stress. Based
on this finding, the authors make two hypotheses:
H1: stress has a negative impact on users’
reaction to e-commerce recommendation
H2: relaxed users are more receptive to the e-
commerce recommendations.
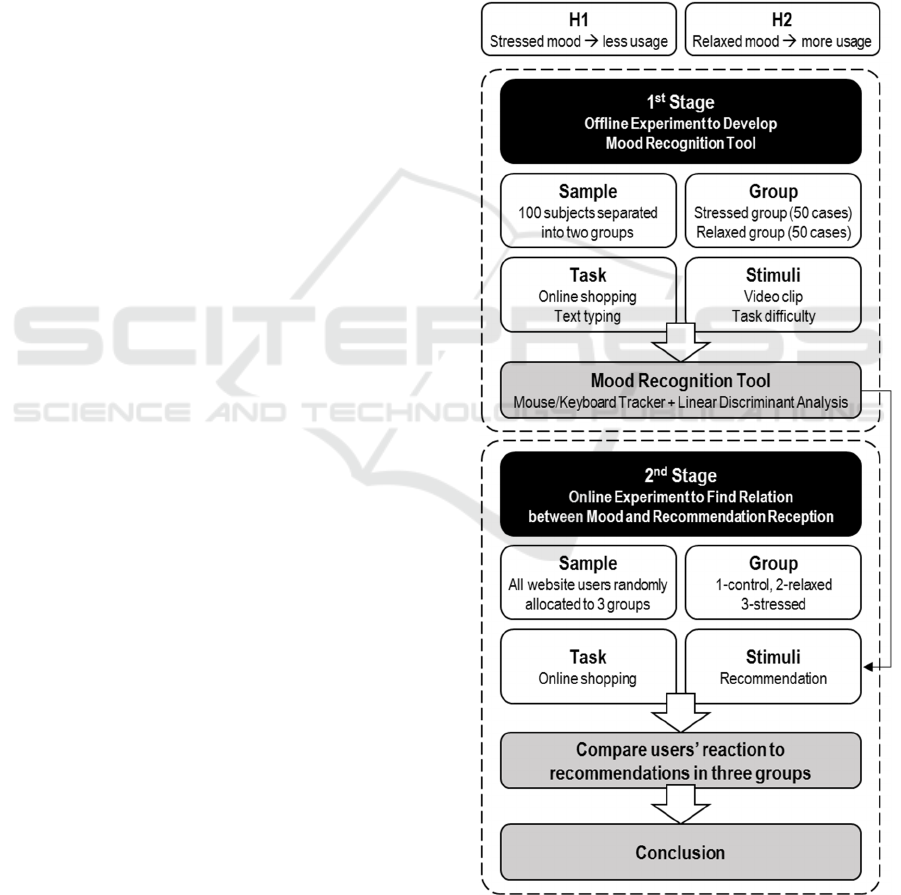
3.2 Research Method
The authors partnered with a French e-commerce
website (ECWP) to conduct the experiment, which
consists of two stages: an offline stage to develop a
mood recognition tool, and an online stage to test the
tool with real users to find out how different mood
states can affect users’ reaction to online product
recommendations (Figure 1).
Figure 1: Research Framework.
Can e-Commerce Recommender Systems be More Popular with Online Shoppers if they are Mood-aware?
175

In order to recognize the mood state of numerous
website users unobtrusively and dynamically, it is
necessary to develop an automatic mood recognition
tool. Hence, an offline experiment was conducted in
the first stage to allow the authors to develop a mood
recognition model and train it with behavioral data
with a group of users. Several conditioning technics
were used in this stage.
Regarding participant selection, 2000 registered
ECWP users were randomly selected as preliminary
candidates. Then the list was trimmed down to 100
based on their demographic features, shopping
experience with ECWP and availability. These
participants were carefully selected so that they can
represent ECWP users (Table 1).
Table 1: Composition of ECWP users and the experiment
participants.
Gender Female Male
ECWP users 53% 47%
Experiment group 50% 50%
Age
(years old)
≤25 26-35 36-50 51-60 >60
ECWP users 17% 34% 26% 19% 4%
Experiment group 20% 30% 30% 15% 5%
Total Spending
(€/year)
≤25 26-50 51-100 101-200 >200
ECWP users 71% 25% 2% 1% 1%
Experiment group 63% 29% 4% 3% 1%
Shopping Frequency
(time/year)
0 1-2 3-5 >5
ECWP users 63% 28% 7% 2%
Experiment group 52% 31% 10% 7%
When designing the offline experiment, the
authors refer to the methods used by Zimmermann et
al. (2006) and Vizer et al. (2009). To simulate
ECWP user traffic flow, experiment sessions were
scheduled at different time of the day. Participants
were split into two groups – the first one was relaxed
and the second one was stressed. In each group,
participants began by watching a video, and then
completed a series of online shopping tasks.
Relaxing and stressful video clips were used to elicit
mood, and task difficulty was adjusted based on the
type of group (i.e. relaxed or stressed) to reinforce
the desired mood. In the relaxing group, participants
were requested to assess five digital cameras (of
similar price) displayed on ECW, choose one model
to offer to their best friend and prepare a 300-word
summary in word processor to justify their choice.
They could ask questions before starting the task,
and there was no time limit to complete the task. In
the stressed group however, participants were
requested to choose a photocopier for their
organization. They must evaluate five photocopiers
of similar price provided by ECWP, choose the most
suitable model and make a formal purchase
application to their supervisor in word processor to
justify why the selected model was better than
others. Participants were told that the task must be
finished in 15 minutes, and a countdown clock was
provided as a reminder of the remaining time.
Before starting the tasks, a brief tutorial session
was conducted in both groups to introduce ECWP
website and the task to be completed. Therefore, the
lack of shopping experience with ECWP would not
be a cause of stress in the experiment. Consequently,
the stress of the stressed group comes from three
sources: 1) time stress: trial experiment indicated
that 15 minutes was barely enough to complete the
task; 2) cognitive stress: preparing formal purchase
application requires participants to be more prudent
and attentive in their work; 3) psychological stress:
the countdown clock further intensified the stress.
Participants’ behavioral data were collected by
web cookie and java-based trackers. The data were
processed by linear discriminant analysis method to
construct and validate the mood recognition tool.
Once the mood recognition tool is ready, it was
used in the second stage of the experiment to
determine when to send recommendations to users.
The second stage took two weeks, and participants
were all the ECWP users. When users started a
session on ECWP website, they were allocated
randomly, equally and unobtrusively into three
groups. Users in Group A received recommendation
as normal. The mood state of users in Group B were
assessed by the mood recognition tool in real time,
based mouse and keyboard trackers. Users received
recommendation only when they were considered
stressed. Using the same method as in Group B,
users in Group C received recommendation only
when they were considered relaxed. Their reactions
to recommended items were analyzed by statistical
approach to verify if mood can affect their reaction
to online recommendations.
The recommender system of ECWP uses a
collaborative filtering algorithm, which assumes that
users who have similar tastes will rate things
similarly. Sometimes the recommendations are
directly related to users’ current interest. Sometimes
the recommended items can be very different from
the product being viewed by users. A click on the
recommended item is defined as positive reaction to
the recommendation. Similarly, a close activity is
defined as a negative reaction.
WEBIST 2016 - 12th International Conference on Web Information Systems and Technologies
176
4 EXPERIMENT RESULT
4.1 Analysis and Result of the First
Stage
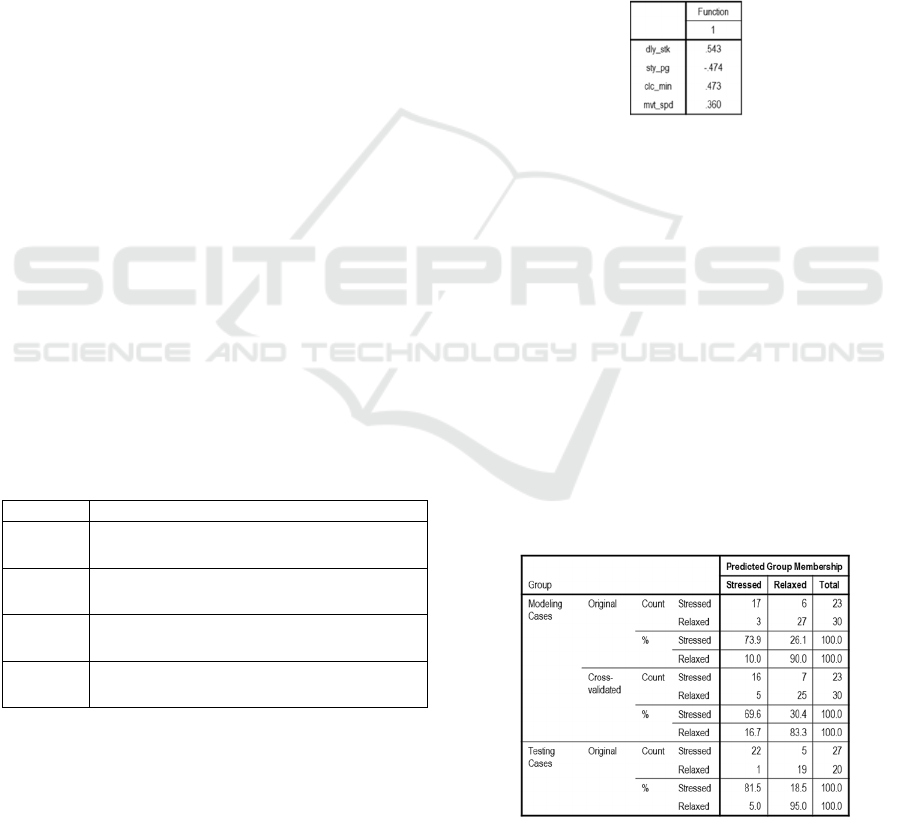
The authors use the linear discriminant analysis
(LDA) method to develop the mood recognition
function. During the experiment, a dozen of mouse
activity, keystroke, and clickstream data were
collected by trackers and cookies. These data
include session time, frequency of keyboard usage
(defined by a five second delay between two
keystrokes), frequency of keystroke, frequency of
mouse click, frequency of mouse movement,
frequency of mouse scrolling, traveling distance of
mouse, timestamp for web page open, and
timestamp for web page close. Then, these
observations were converted into comparable
variables.
Among all the 100 cases collected by the
experiment, 53 case were randomly selected as
modeling cases (23 stressed and 30 relaxed), and 47
case were used as validating cases (27 stressed and
20 relaxed). The predictors of the model were
selected based on a few considerations. Firstly, with-
in groups correlation matrix was used to minimize
collinear predictors in the model. Secondly, one-way
ANOVA test was conducted to confirm that
predictors are significantly different among groups.
Thirdly, the model’s discriminatory ability must be
acceptable, meaning that the prediction accuracy
must be acceptable not only for the modeling cases,
but also for the validating cases. Based on these
criteria, four variables were selected (Table 2).
Table 2: List of predictors.
Predictor Definition (measurement)
mvt_spd
A
verage distance of each mouse move
(pixel/move)
sty_pg
A
verage time spent stay with a page
(second/page)
clc_min
A
verage number of mouse click per minute
(click/minute)
dly_stk
A
verage time between depressing and
releasing a key (millisecond)
In the modeling cases, there were less stressed
users than relaxed users. For the authors, the main
objective of the discriminant function is to recognize
“stressed” users. Therefore, prior probabilities of
stressed and relaxed mood state were computed
according to the group sizes, so that the model can
be more conservative. The syntax to crate
discriminant model in SPSS is:
DISCRIMINANT
/GROUPS=Group(0 1)
/VARIABLES=mvt_spd time_pg clc_min
dly_stk
/SELECT=model(1)
/ANALYSIS ALL
/SAVE=CLASS SCORES PROBS
/PRIORS SIZE
/STATISTICS=MEAN STDDEV UNIVF BOXM
COEFF RAW CORR COV TABLE CROSSVALID
/CLASSIFY=NONMISSING POOLED.
Based on 53 selected cases, the discriminant model
is:
y = 0.022dl_kystr – 0.046time_pg + 0.414clic_min +
0.001mvt_speed – 6.17
Figure 2: Structure matrix.
One-way ANOVA tests indicates that the null
hypothesis can be rejected at 2% level. The within-
groups correlation matrix shows that the largest
correlation between predictors is 0.241 (correlation
between mvt_spd and clc_min). The p-value of
Box’s test of equality of covariance matrices is
0.127. Wilk’s lambda of the canonical discriminant
function is 0.509. And p-value is 0.000, suggesting
that the discriminant function is effective. The
structure matrix (Figure 2) shows that dly_stk has
the strongest discriminatory ability, followed by
sty_pg, clc_min and mvt_spd.
Classification result indicates that the 83% of the
modeling cases and 87% of the testing cases can be
correctly classified, suggesting that the model is
stable and reliable.
Figure 3: Classification results.
Can e-Commerce Recommender Systems be More Popular with Online Shoppers if they are Mood-aware?
177
4.2 Result of the Second Stage
The dataset of the two-week live experiment consists
of 52,896 sample users. The mood recognition tool
finds that 27% of them experienced stress during a
session. The statistics of the different groups are
highlighted in Table 3.
Table 3: Experiment result of the second stage.
RESULT 2
ND
STAGE Group A Group B
Stressed
Group C
Relaxed
Sample Users 17,632 17,632 17,632
Recommendations 88,215 24,271 64,399
Stressed mood (%) - 27.17% 26.51%
Relaxed mood (%) - 72.83% 73.49%
Recommendation Click
1,411
199 1,256
Recommendation Close 2,602 796 1,848
Time to click (second)
13.55 16.12 11.05
Time to close (second) 3.48 3.17 3.79
Click through rate and close rate are used to
measure the performance of recommender system in
different mood state (Figure 4). Click through rate
measures how many displayed recommendations
end up being clicked by ECWP users. It confirms
that recommendations were more welcomed when
users were in a relaxed mood, and users in a stressed
mood showed little interest to recommendations.
Close rate measures how often ECWP users reject a
recommendation by removing it from the screen. It
indicates that stressed users were more likely to
reject recommendations actively than relaxed users.
Figure 4: Recommendation click through and close rate by
experiment group.
Behavioral data indicate that stress can affect
users’ time to react (Table 3). Compared with
relaxed users, it took longer for stressed users to
click on recommended items. And stressed users
rejected recommendations more quickly than relaxed
users. Based on these findings, we can conclude that
stress negatively affect ECWP users’ reaction to
online recommendations. In order to enhance the
usage of recommender system, recommendations
should be sent to users when they are less stressed.
5 DISCUSSION
Our findings can bring to online marketers several
key insights.
Firstly, online consumers are not always relaxed.
In some cases (e.g. 27% in ECWP), they can be
stressed. Taking care of their affective state might
help online marketers to reduce website
abandonment rate, increase deal conversion rate and
enhance consumer satisfaction. By deploying real
time mood recognition tool, online marketers can
know when to take necessary measures to relax
consumers and then help them to find what they
want. Such measure include changing the color of
website layout, propose a chat through instant
messenger and so on.
Secondly, the “right time” plays a very important
role in a successful recommendation (Fischer, 2012).
According to our findings, the right time for
recommendation is when users are in the relaxed
mood. For push-based recommender systems, mood
recognition tools can judge when to stop pushing
recommendations so as not to disturb the stressed
consumers. For pull-based online marketing
systems, mood recognition tool can help to manage
the cognitive load (i.e. the content to display) to
consumers.
Our research method has some limitations.
Firstly, the mood recognition tool was developed
based on the behavioral data of ECWP users.
Therefore, the tool might not be applicable to other
e-commerce websites. Secondly, due to the
experiment budget and time constraints, the authors
used only one machine learning method (i.e. linear
discriminant analysis) to develop the model. The
authors believe that the prediction accuracy of mood
recognition tool might be further enhanced, if other
methods (e.g. artificial neural networks) can be
tested on a larger data set. In the future research, the
authors will try to incorporate these considerations
into consideration.
In order to apply our method to the e-commerce
WEBIST 2016 - 12th International Conference on Web Information Systems and Technologies
178

practice, we suggest online merchants pay attention
to two aspects.
The first is that an e-commerce website must
obtain users’ consent before collecting their online
behavioral data unobtrusively. In our experiment,
participants were requested to sign a waiver before
being accepted. In practice, necessary modification
must be made to the website’s disclaimer, so that
consumers are given the right to accept or refuse to
be monitored.
The second is that the effectiveness of the mood
recognition tool should be reviewed from time to
time to maintain its predictive power. Users’ mood
can be affected by many different contextual factors
such as season, weather, health, motivation, or
environment. To determine the effectiveness of the
mood recognition tool, e-commerce websites can
pop up an inquiry of users’ current mood state on the
user interface, and compare users’ response with the
prediction result. If the classification accuracy is low
(e.g. less than 80%), the e-commerce website can
use the collected data to rectify the mood
recognition tool.
6 CONCLUSIONS
This paper presents a method to incorporate mood
recognition into online recommendation. Experiment
shows that quite an amount of online consumers
were in a stressed mood, and recommendations were
more popular with relaxed users than stressed users.
Such findings can be used by recommender system
developers and online marketers to improve user
experience and enhance consumer satisfaction with
e-commerce websites.
ACKNOWLEDGEMENTS
Firstly, we would like to express our gratitude to the
Science and Technology Commission of Shanghai
Municipality (STCSM) for financing this research
(STCSM Project Number: 14DZ1101400
Personalized Recommendation Technology based
Aeronautical Mobile Community Service Model
Research and Application Demonstration).
Secondly, we would appreciate the support from our
French research partner, who helped us find the
experiment participants, shared with us their
operation/business data, and provided us with the
infrastructures to conduct the experiments. Finally,
we would like to thank all the reviewers for their
valuable comments, which had made this paper
more insightful.
REFERENCES
Fridlund, A. J., 2014. Human facial expression: An
evolutionary view. Academic Press.
Koolagudi, S. G., & Rao, K. S., 2012. Emotion
recognition from speech: a review. International
journal of speech technology, 15(2), 99-117.
Silva, D. C., Vinhas, V., Reis, L. P., & Oliveira, E., 2009.
Biometric emotion assessment and feedback in an
immersive digital environment. International Journal
of Social Robotics, 1(4), 307-317.
Baldoni, M., Baroglio, C., Patti, V., & Rena, P., 2012.
From tags to emotions: Ontology-driven sentiment
analysis in the social semantic web. Intelligenza
Artificiale, 6(1), 41-54.
Khan, I. A., Brinkman, W. P., & Hierons, R., 2013.
Towards estimating computer users’ mood from
interaction behaviour with keyboard and mouse.
Frontiers of Computer Science, 7(6), 943-954.
Sebe, N., Cohen, I., Gevers, T., & Huang, T. S., 2006.
Emotion recognition based on joint visual and audio
cues. In 18th International Conference on Pattern
Recognition, Vol. 1, 1136-1139. IEEE.
Ambinder, M., 2011. Biofeedback in gameplay: How
valve measures physiology to enhance gaming
experience. In Game Developers Conference. Vol.
2011.
D’Mello, S., Jackson, T., Craig, S., Morgan, B., Chipman,
P., White, H., & Graesser, A., 2008. AutoTutor detects
and responds to learners affective and cognitive states.
In Workshop on Emotional and Cognitive Issues at the
International Conference on Intelligent Tutoring
Systems, 306-308.
Mao, X., & Li, Z., 2009. Implementing emotion-based
user-aware e-learning. In CHI'09 Extended Abstracts
on Human Factors in Computing Systems, 3787-3792.
ACM.
Bailey, B. P., & Konstan, J. A., 2006. On the need for
attention-aware systems: Measuring effects of
interruption on task performance, error rate, and
affective state. Computers in human behavior, 22(4),
685-708.
Kolakowska, A., Landowska, A., Szwoch, M., Szwoch,
W., & Wrobel, M. R, 2013. Emotion recognition and
its application in software engineering. In The 6th
International Conference on Human System
Interaction, 532-539. IEEE.
Lane, A. M., & Terry, P. C., 2000. The nature of mood:
Development of a conceptual model with a focus on
depression. Journal of Applied Sport Psychology,
12(1), 16-33.
Lee, H., Choi, Y. S., Lee, S., & Park, I. P., 2012. Towards
unobtrusive emotion recognition for affective social
communication. In Consumer Communications and
Networking Conference (CCNC), 260-264. IEEE.
Can e-Commerce Recommender Systems be More Popular with Online Shoppers if they are Mood-aware?
179

Epp, C., Lippold, M., & Mandryk, R. L., 2011. Identifying
emotional states using keystroke dynamics. In
Proceedings of the SIGCHI Conference on Human
Factors in Computing Systems, 715-724. ACM.
Zimmermann, P., Gomez, P., Danuser, B., & Schär, S.
(2006). Extending usability: putting affect into the
user-experience. Proceedings of NordiCHI'06, 27-32.
Khanna, P., & Sasikumar, M. (2010). Recognising
emotions from keyboard stroke pattern. International
journal of computer applications, 11(9), 1-5.
Lv, H. R., Lin, Z. L., Yin, W. J., & Dong, J., 2008.
Emotion recognition based on pressure sensor
keyboards. In IEEE International Conference on
Multimedia and Expo, 1089-1092. IEEE.
Sottilare, R. A., & Proctor, M., 2012. Passively classifying
student mood and performance within intelligent
tutors. Journal of Educational Technology & Society,
15(2), 101-114.
Maehr, W., 2005. Estimation of the User’s Emotional
State by Mouse Motions. Doctoral dissertation for
Fachhochschule Vorarlberg, Dornbirn, Austria.
Vizer, L. M., Zhou, L., & Sears, A., 2009. Automated
stress detection using keystroke and linguistic
features: An exploratory study. International Journal
of Human-Computer Studies, 67(10), 870-886.
Zimmermann, P., Guttormsen, S., Danuser, B., & Gomez,
P., 2003. Affective computing – a rationale for
measuring mood with mouse and keyboard.
International journal of occupational safety and
ergonomics, 9(4), 539-551.
Salmeron-Majadas, S., Santos, O. C., & Boticario, J. G.,
2014. Exploring indicators from keyboard and mouse
interactions to predict the user affective state. In
Educational Data Mining 2014.
Lee, P. M., Tsui, W. H., & Hsiao, T. C., 2012. A low-cost
scalable solution for monitoring affective state of
students in e-learning environment using mouse and
keystroke data. In Intelligent Tutoring Systems. 679-
680. Springer Berlin Heidelberg.
Salmeron-Majadas, S., Santos, O. C., Boticario, J. G.,
Cabestrero, R., Quirós, P., & Saneiro, M., 2013.
Gathering emotional data from multiple sources. In
Educational Data Mining.
Montgomery, A. L., Li, S., Srinivasan, K., & Liechty, J.
C., 2004. Modelling online browsing and path analysis
using clickstream data. Marketing Science, 23(4), 579-
595.
Bucklin, R. E., & Sismeiro, C., 2009. Click here for
Internet insight: Advances in clickstream data analysis
in marketing. Journal of Interactive Marketing, 23(1),
35-48.
Chen, L., & Su, Q., 2013. Discovering user's interest at E-
commerce site using clickstream data. In Service
systems and service management (ICSSSM), 2013 10th
international conference on. 124-129. IEEE.
Olbrich, R., & Holsing, C., 2011. Modeling consumer
purchasing behavior in social shopping communities
with clickstream data. International Journal of
Electronic Commerce, 16(2), 15-40.
Arnold, M. J., & Reynolds, K. E., 2003. Hedonic shopping
motivations. Journal of retailing, 79(2), 77-95.
Horvitz, E., Kadie, C., Paek, T., & Hovel, D., 2003.
Models of attention in computing and communication:
from principles to applications. Communications of the
ACM, 46(3), 52-59.
Fischer, G., 2012. Context-aware systems: the “right”
information, at the “right” time, in the “right” place, in
the “right” way, to the “right” person. In Proceedings
of the International Working Conference on Advanced
Visual Interfaces. 287-294. ACM.
WEBIST 2016 - 12th International Conference on Web Information Systems and Technologies
180
