
QS Mapper: A Transparent Data Aggregator for the Quantified Self
Freedom from Particularity Using Two-way Mappings
Rasmus Rosenqvist Petersen
1
, Adriana Lukas
2
and Uffe Kock Wiil
3
1
Founder at NOBLACKBOX Ltd, Cambridge, U. K.
2
Organizer at London Quantified Self, London, U. K.
3
Director at Parient@home {http://www.patientathome.dk} and Information & Knowledge Management lab,
University of Southern Denmark, Odense, Denmark
Keywords:
Quantified Self, Self Tracking, Self Hacking, Data Aggregator, Explorative Analysis, Computational Analy-
sis, Hypertext.
Abstract:
Quantified Self is a growing community of individuals seeking self-improvement through self-measurement.
Initially, personal variables such as diet, exercise, sleep, and productivity are tracked. This data is then explored
for correlations, to ultimately either change negative or confirm positive behavioural patterns. Tools and
applications that can handle these tasks exist, but they mostly focus on specific domains such as diet and
exercise. These targeted tools implement a black box approach to data ingestion and computational analysis,
thereby reducing the level of trust in the information reported. We present QS Mapper, a novel tool, that allows
users to create two-way mappings between their tracked data and the data model. It is demonstrated how drag
and drop data ingestion, interactive explorative analysis, and customisation of computational analysis procures
more individual insights when testing Quantified Self hypotheses.
1 INTRODUCTION
Quantified Self (QS) is a growing community of
individuals seeking self-improvement through self-
measurement. Data aggregation and analysis for in-
dividuals is a complex process relying on data and
method transparency to succeed. A typical self-
tracking process involves individuals using spread-
sheets, wearable tech, phone apps, and manual tools
to log personal variables in real time. Once these dif-
ferent streams of data are in place, the tracked data
must somehow be aggregated into one system for fur-
ther analysis. The main challenge is to avoid loss of
data tracking context, as the user is fitted into a uni-
versal data model, often leading to less or no useful
insights gained (Choe et al., 2014). Each data source
must also be allowed to appear in the context of each
other, to support learning and decision-making, based
on correlations in the data.
Our overall goal is to develop a software tool
that supports individual designs of rigorous self-
experimentation, “to leverage the benefits of - while
easing the burden of - manual tracking, and to pro-
mote self-reflection” (Choe et al., 2014). The London
Self-Hacking Working Group has emphasised that
there is a lack of tools to allow people to conveniently
acquire, store, process, analyse, visualise and re-use
the data on their own terms and in a unified, trusted
and transparently managed environment (Lukas and
midata et al., 2015).
We believe that open-ended systems is the right
method and have found that hypertext offers the tech-
niques to achieve this (Petersen and Wiil, 2009; Pe-
tersen, 2012). Individuals who are new to self-
tracking often use spreadsheets to accommodate their
initial tracking needs. However, the emergent and
evolving nature of QS projects has shown a need to
support other structures than just the two dimensional
grid of spreadsheets (Marshall and Shipman, 1995).
During the development of QS Mapper we have
been working closely with the Quantified Self com-
munities in London
1
and Cambridge
2
, United King-
dom, to get feedback on tool designs and imple-
mented features. A number of important overall re-
quirements have come out of this collaboration. In
summary, a QS data aggregator must:
• a) support concepts that leverage trust in the tool
output.
1
http://www.meetup.com/LondonQS/
2
http://www.meetup.com/CambridgeQS/
65
Petersen R., Lukas A. and Wiil U..
QS Mapper: A Transparent Data Aggregator for the Quantified Self - Freedom from Particularity Using Two-way Mappings.
DOI: 10.5220/0005553800650072
In Proceedings of the 10th International Conference on Software Engineering and Applications (ICSOFT-EA-2015), pages 65-72
ISBN: 978-989-758-114-4
Copyright
c
2015 SCITEPRESS (Science and Technology Publications, Lda.)
• b) be an open-ended system while ensuring the
preservation of context.
• c) support multiple views on the aggregated data,
regardless of data structure.
QS mapper supports drag and drop data ingestion,
interactive explorative analysis, and customisation of
computational analysis. We have found that two-way
mappings created with drag and drop is a simple but
very powerful method, leveraging transparency and
boosting the user’s sense of ownership. The QS com-
munity has provided continuous feedback on these
features, allowing us to iterate towards the most use-
ful implementation.
The remainder of this paper is structured as fol-
lows: Section 2 goes into more detail with the terms
self-tracking and self-hacking, and presents the sce-
nario that has guided our research. Section 3 outlines
related work and Section 4 describes the QS Mapper
requirements and highlights the most important fea-
tures. Section 5 concludes the paper by summarizing
the main contributions.
2 SELF-HACKING
The aim of QS is not just quantification, but rather
the general process of self-improvement through self-
measurement. Self-hackers are QS community mem-
bers with a direct connection between their personal
data and desire to improve their lives. Many of them
use and create applications and tools to manage and
improve their health and fitness, productivity, and fi-
nances. Examples include mood or alcohol tracking,
managing serious conditions including cancer, trying
to extract data from a pacemaker to manage a serious
heart condition, and using data to improve diabetes
control, to name but a few. (Lukas and midata et al.,
2015)
A typical process starts with a hypothesis about
some cause-and-effect correlation. Then follows the
measurement of personal variables (self-tracking).
This information is analysed for patterns, typically
referred to as correlations. These patterns (insights)
may then function as tools for the self-tracker to make
behavioral changes, hence becoming a self-hacker.
There are many challenges when starting a QS
project. The QS movement offers several clues to the
underlying problems in the personal data ecosystem.
Many in the QS community experiment by design-
ing their own tools to collect and analyse their data.
These are often developed by individuals themselves
whose skills, though impressive, are often random.
The problem is a lack of tools for people to analyse
data on their terms, to visualise and use them further.
2.1 Self-hacking Proposal
The London self-hacking working group has drafted
a proposal aiming at increasing the analytical capabil-
ities for individual users in QS (Lukas and midata et
al., 2015):
As data becomes increasingly available, more
work is needed to catalyse the development of
applications that can transform this raw data
into a really useful tool for consumers.
The proposal states three main challenges that has
to be overcome:
1. reclaiming and extracting the individual user’s
data from various sources,
2. finding neutral, trusted platforms to hold individ-
ual user’s data, including the option of individual
platforms and
3. enhancing the individual user’s ability to analyse
the data.
We focus on the third issue in this paper. For the
benefit of simplicity we have assumed that issue 1 and
2 has already been addressed. We will contribute to
the further development of this field by demonstrating
what is possible and thereby hope to stimulate further
demands from users (Lukas and midata et al., 2015).
2.2 Scenario
Our scenario is based on interviews with QS com-
munity members, our own experiences with self-
tracking, and so-called show and tell talks .
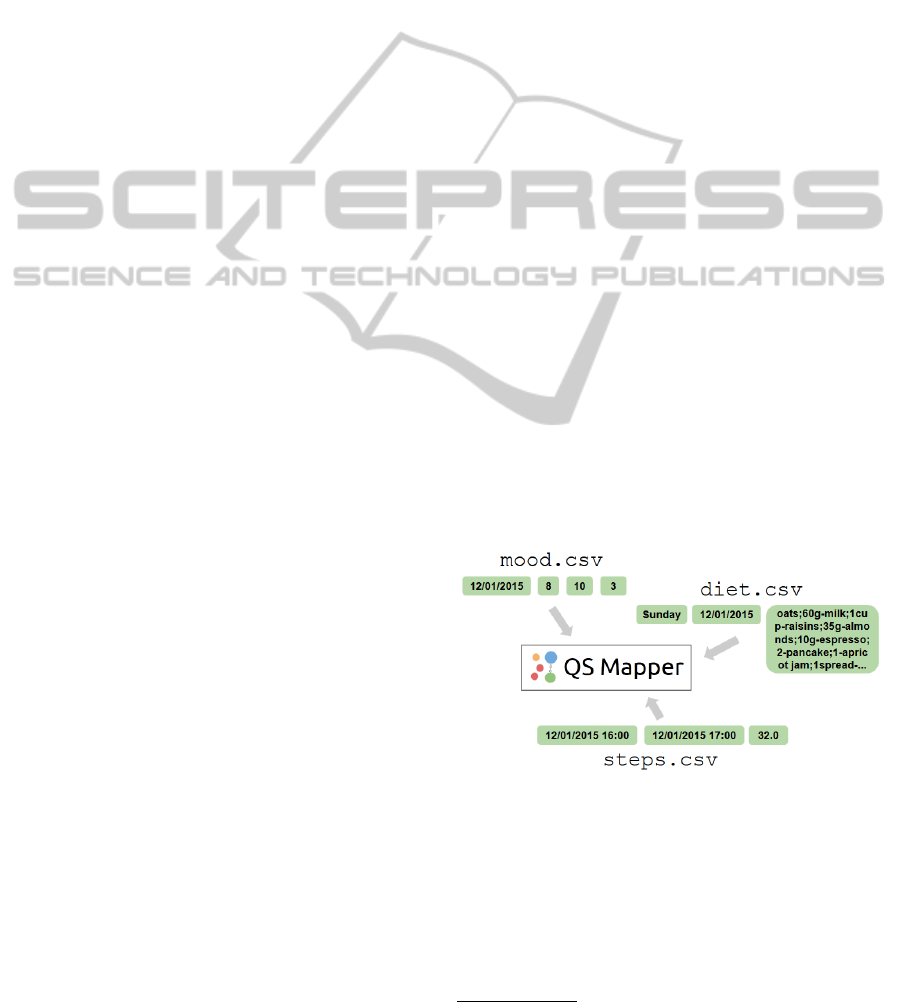
Figure 1: The structure of the three CSV data streams which
are to be aggregated and analysed for correlations in QS
Mapper.
A self-tracker has designed an experiment to in-
vestigate possible correlations between diet, steps
taken, and mood. Diet is tracked in a spreadsheet,
using a particular format to log all diet items and
amounts in a single line. Steps are tracked using a
health kit, which exports to CSV for analysis. Mood
2
See https://vimeo.com/channels/londonqs
ICSOFT-EA2015-10thInternationalConferenceonSoftwareEngineeringandApplications
66

is tracked by entering a number between 1 and 10 into
a dedicated mood tracking app three times per day
(morning, noon, and evening). The self-tracker wants
to aggregate and analyse these three data streams in
QS Mapper, as shown in Figure 1.
QS Mapper support for this scenario is described
in Section 4.2.
3 RELATED WORK
The dominant approach to analytical tools and appli-
cations relies on the software only for data seman-
tics and analysis. Just enough data analysis is im-
plemented to keep people tracking aspects of their
lives, securing the commercial viability of the tool.
But there is a growing need for user-centric personal
data management platforms, involving the user when
defining semantics and during computational analy-
sis. “Drawing the line between what we can forfeit
to calculation and what we reserve for the heroics of
free will is the story of our time” (Lanier, 2014).
This review focuses on alternatives to “you are
the product”
3
, by which the individual user is treated
as the point of integration for personal data. “You
are the product” may be good enough for most users
but it limits the level of sophistication available to
individuals and the resulting data analysis innova-
tion. An explicitly individual-centric approach would
have the advantage of being able to converge personal
data from many sources without the usual silos be-
tween platforms, services and organisations (Lukas
and midata et al., 2015). Two of the most devel-
oped non-commercial tools for QS data aggregation
are FluxStream and Intel Data Sense:
Fluxstream (Fluxtream, 2015) is an open source
non-profit personal data visualization framework
that help users make sense of their life and com-
pare hypotheses about what affects their well-being
(E. K. Choe and Kientz, 2014). Fluxtream aggregates
data from a number of data sources using a list of pre-
programmed APIs for technologies such as Jawbone,
Misfit, flickr, and Google Calendar; so-called Con-
nectors. The tool also have the option to implement
support for custom Connectors.
Data Sense (Labs, 2015) is a research experiment
at Intel Labs, written in Java. The purpose of the web
application is to see if it is possible to make data more
accessible to individuals without degrees in statistics.
Commercial web and smartphone applications in-
clude Google BigQuery, rTracker, and TracknShare:
3
http://lifehacker.com/5697167/ifyourenotpayingforityourethe
product
Google BigQuery (Google, 2015; Melnik et al.,
2010) is a cloud platform application supporting tra-
ditional extract, transform and load (ETL) tools from
third party vendors for data ingestion and business
intelligence tools for data visualization. These ETL
tools “provide an easy to use drag and drop user in-
terface for transforming and de-normalizing data and
have the capability of loading data directly into Big-
Query” (Google, 2015). If data are from multiple
sources, Google recommends using a third party tools
instead of the five step process that BigQuery sup-
ports. BigQuery is based on Dremel (Melnik et al.,
2010), a technology pioneered by Google.
rTracker (Realidata, 2015; Augemberg, 2012) is
a generic, customisable personal data tracker for the
iPhone, allowing its users to create their own track-
ers for personal variables such as physique, mood,
mileage, sleep quality, eating, shopping, exercise, job
hours, and more. In other words, rTracker let’s the
user define any tracking variables they want. Further-
more, the tool supports organizing the variables into
higher order customizable categories, e.g., “these are
the variables I want to track in the morning”.
TracknShare (Track and Apps, 2015; Augem-
berg, 2012; Swan, 2013), like rTracker, allows cus-
tomization of tracking variables, and also has support
for defining the scale that goes with each variable.
Weight can be recorded in pounds or kilos as a num-
ber, sleep can be rated on an n-point scale, and check
off all the medications taken after breakfast, all in the
same app.
While any variable can be tracked with Trackn-
Share and rTracker, aggregation with data from other
tools does not seem to be supported.
4 THE QS MAPPER APPROACH
4.1 Requirements
Based on interactions with the QS community, three
overall requirements for personal data aggregators
have been identified (Lanier, 2014; QS, 2014; Kleine,
2011; Licklider, 1960):
Trust. It must be clear and openly available in-
formation how outputs are calculated.
Transparency and ownership can leverage trust.
Black box solutions will not provide the user with
answers on how outputs were calculated. As a con-
sequence, data aggregators must be open-ended sys-
tems, even if it means losing some autonomy for other
gains (see Figure 2).
Context. Preserve how data is tracked and al-
low individual data sources to appear in different con-
QSMapper:ATransparentDataAggregatorfortheQuantifiedSelf-FreedomfromParticularityUsingTwo-way
Mappings
67
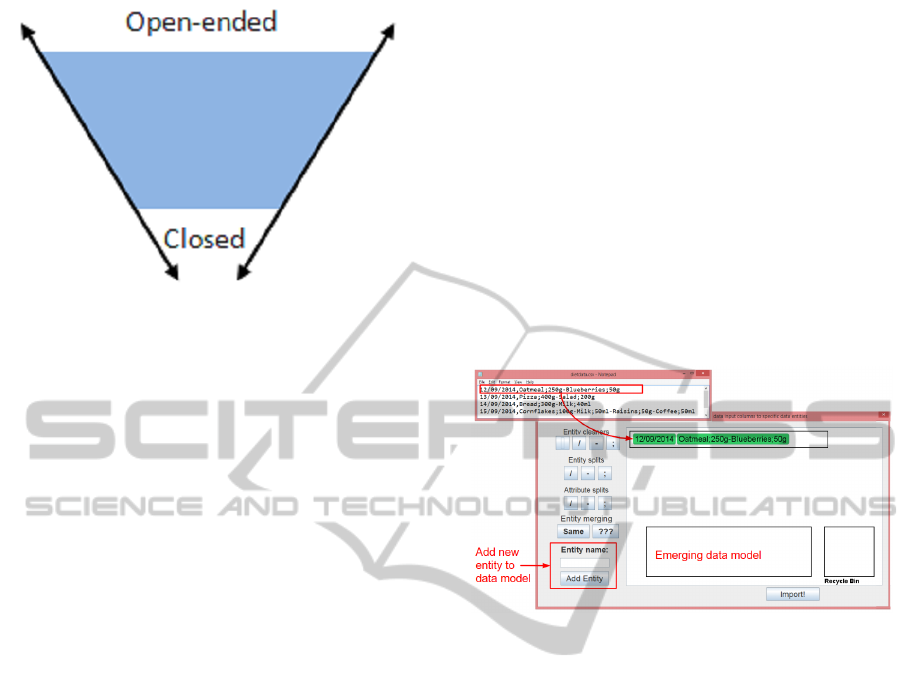
Figure 2: The determinism continuum, from open-ended to
closed, indicates the degree to which technology predeter-
mines usage (Kleine, 2011).
texts.
In general, the users must be involved in the data
aggregation process, from data ingestion to insight
analysis. Users are still the primary actors and closed
technologies circumscribe the choices a user has,
while open-ended technologies widens them (Lanier,
2014; Licklider, 1960; Kleine, 2011).
Views. Support multiple views on aggregated data
and allow users to investigate potential correlations
in the data.
When a QS hypothesis is initially formulated it
will not be clear what view that will best emphasize
the correlations in the tracked data. As a consequence,
views should therefore be flexible and support differ-
ent data structures. Personal data is typically temporal
but different views might reveal other structural asso-
ciations.
Based on previous work with planning and inves-
tigation (Petersen and Wiil, 2009; Petersen, 2012), a
set of functional requirements for QS data aggrega-
tors has been defined. Supporting these requirements
would help minimize the effect of common pitfalls
faced by the QS community (Choe et al., 2014; Swan,
2013):
1. Hypothesis generation, using mind maps, elec-
tronic post its, or other brainstorming features.
2. Experiment designs, to formulate what variables
to track, in order to test the hypothesis.
3. Data aggregation, preserving the context of each
individual data source.
4. Explorative analysis, using visualizations to em-
phasize structural characteristics and gain in-
sights.
5. Algorithm customisation, allowing users to con-
trol context-relevant parts of computational anal-
ysis.
4.2 Features
QS Mapper features aim to support the three over-
all and five functional requirements described above.
Currently, three functional requirements are sup-
ported: aggregation of data from multiple sources
(CSV files), interactive visualisations for exploratory
analysis, and customisation of computational analy-
sis.
The column to entity mapper offers a number
of features for applying certain transformations to the
data columns in CSV files. This mapping may take
several iterations to get right. Figures 3 to 5 give an
overview of what happens from data ingestion to anal-
ysis of the data.
Figure 3: The column to entity mapper assists users when
creating mappings between data columns and data model
entities.
Figure 3 shows how the column to entity map-
per first loads a line from the selected CSV file, and
splits it into columns on the comma (this initial split-
ting should of course be customizable). At the bottom
left are user input fields for adding data entities to the
mapper that will appear in the rectangle in the middle
(i.e., “Emerging data model”). On the left are buttons
for adding cleaner, split, and merging entities. Splits
are central and divided into entity and attribute splits:
Entity splits are for data columns containing multi-
ple entities. In the shown example, diet items are
separated by hyphens (-), but all entered into the
same column.
Attribute splits are for a column containing multiple
attributes for the entity (or entities) you are build-
ing a mapping for. E.g., the name of the food item
and the weight of a food item is split by a semi-
colon (;).
Figure 4 shows how columns can be parsed and
split, and then mapped to data entities in the emerging
data model. Date, Food, and Weight have been added
as separate data entities. Then an entity split (red),
followed by an attribute split (blue). The history of
ICSOFT-EA2015-10thInternationalConferenceonSoftwareEngineeringandApplications
68
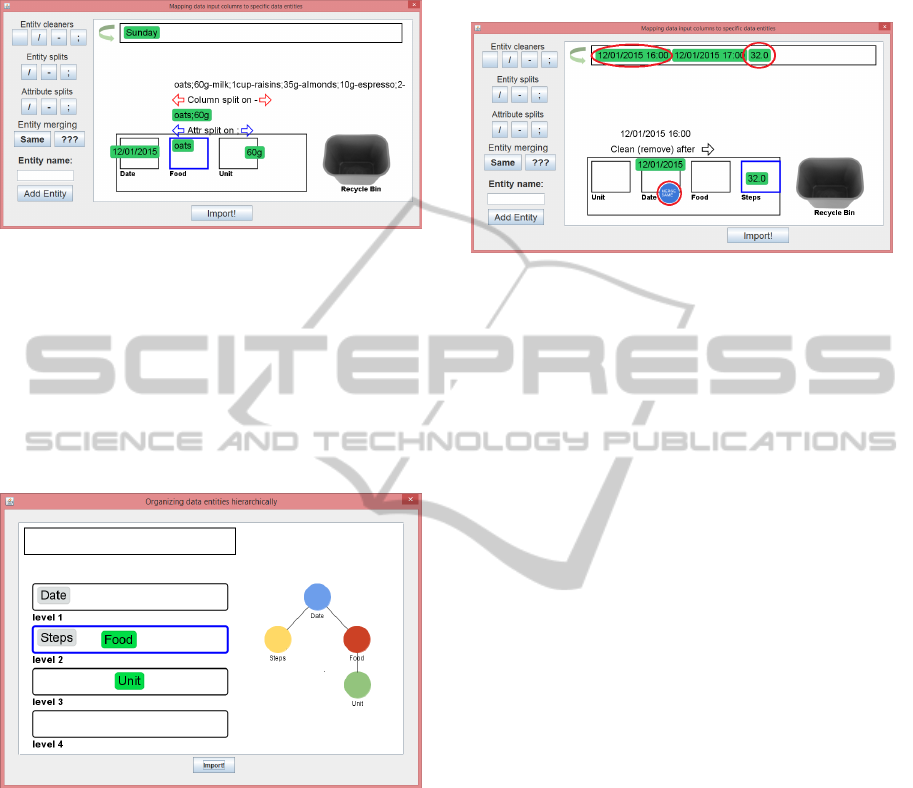
the parsing is only shown when hovering the resulting
entity, e.g., ‘oats’ or ‘60g’.
Figure 4: Three data entities are added, and the parsed
columns are mapped to these entities. The history of the
‘oats’ sub-column is shown.
Before the data are imported the user is asked for
a drag and drop definition of associations between the
created data entities. Currently, the hierarchical view
shown in Figure 5 is the only view supported. The
choices made here will be used to guide for exam-
ple exploratory analysis layout algorithms, and gen-
eral display of information to the user.
Figure 5: The hierarchical association mapper showing the
associations defined between Date and Steps entities (added
in earlier iteration) and Food and Unit entities (added in this
iteration).
When merging in the steps data, the user has to
repeat the steps in Figures 3 to 5. Figure 6 is a semi-
mockup showing the columns before parsing, as well
as the resulting columns mapped to data entities.
During merging, the date is retrieved by using a
cleaner, cleaning all characters after a space in the
first column. This entity is mapped to the Date en-
tity added when importing the diet data. It is decided
to merge together similar dates, making all other vari-
ables linked to this temporal variable. This is done
with the blue circle entity labelled “MERGE SAME”.
The steps in column 3 are mapped directly to a new
entity. It is also important to note that not all the
columns in the CSV file are used, as the time span be-
tween steps was not found important for the hypothe-
sis being investigated.
Figure 6: Merging in steps data using Entity merging and
cleaning. NB only columns 1 and 3 are used.
Overview of the aggregated data and emerging
structures is supported by network visualisations and
layouts in the main QS Mapper window (see Figure
7).
In the current version of QS Mapper, a force-
directed layout algorithm has been implemented
(McGuffin, 2012). This algorithm can layout all the
entities, and it has also been used to implement a star
networks layout algorithm, which can be useful for
temporal data. It takes each separate cluster of enti-
ties and applies the force directed algorithm to these
sub-networks.
When the user is ready to start looking for corre-
lations, customisation of computational analysis must
be utilized. Data entity abstractions are supported
by the line chart view to make it more flexible and
dynamic. Figure 8 shows the line chart view, with
diet information loaded. The ‘Date’ entity has been
dragged onto the x-axis. A ‘Calories’ abstraction has
been added, using the Entity Abstraction view shown
in Figure 9.
The line chart view supports entity selection and
uses node glyphs to add additional functionality. For
standard entities an ‘A+’ glyph is shown on selection.
If clicked, the entity abstraction view is opened with
this entity added (or these entities, if multiple entities
were selected). A yellow glyph is added to the Calo-
ries abstraction when there are food items that could
not be mapped to nutritional information. Clicking
this yellow glyph is intended to then open a calorie
mapping view were diet item can be looked up and
mapped manually, if possible.
The entity abstraction view currently supports
one abstraction, the food and weight/volume abstrac-
tion for diet tracking. But adding simple abstractions
such as summing, multiplication, and averages, would
help sum up steps on a daily basis and average mood
tracking on a daily basis as well. The calorie abstrac-
QSMapper:ATransparentDataAggregatorfortheQuantifiedSelf-FreedomfromParticularityUsingTwo-way
Mappings
69
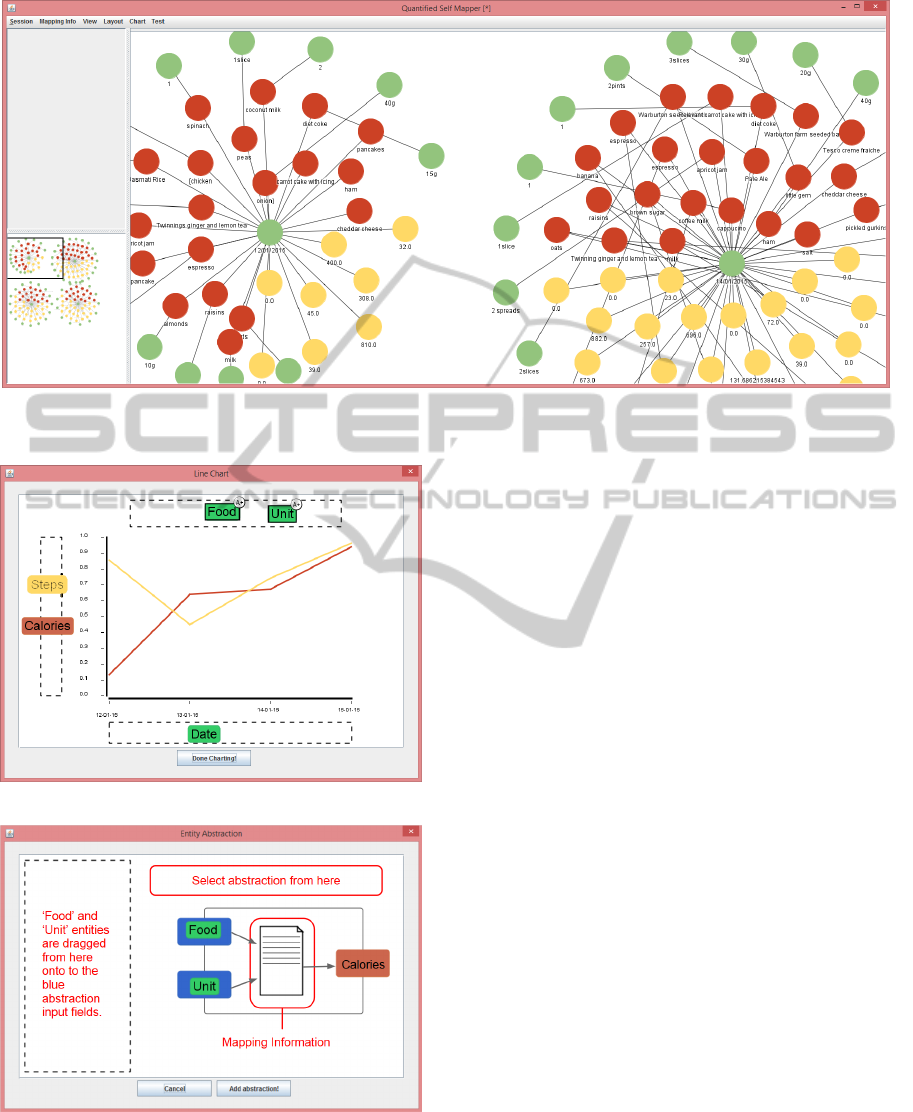
Figure 7: Explorative analysis with network visualisations and layouts. The visualisation features include force directed
layouts of the whole network or separate (star network) clusters.
Figure 8: Line Chart View.
Figure 9: Entity Abstraction View.
tion takes 2 inputs, relies on one mapping info table,
and returns one output. The replaceable mapping in-
formation table is another aspect we aim to explore
more in the future.
4.3 Current Status and Future Work
The current visualisations for exploratory analysis are
limited and mainly consists of layout algorithms. Tra-
ditional visualisation features such as entity filtering,
sizing, colouring, and grouping would be powerful
tools useful for quantified self data streams.
History and context are two tightly coupled con-
cepts, several history related features should be imple-
mented in the future. A parallel history feature could
explain the evolution of personal data models, mak-
ing them easier to understand. In general, you should
be able to see which cell in what spreadsheet a single
entity in the data might originate from. If this is the
outlier confirming your health hypothesis, then such a
record might be the infamous needle in the haystack.
4.4 Evaluation
Evaluation at this stage is limited. Early versions of
QS Mapper have been reviewed by the founder at
London QS, Adriana Lukas. Ideas and concepts have
also been presented and discussed at two London QS
meetups. Feedback from these meetups helped us it-
erate towards the results presented here.
The supported aggregation of three structurally di-
verse data sources has confirmed that QS Mapper’s
main aim can be achieved. However, we have not yet
been able to evaluate what effort and complexity is
involved in using QS Mapper.
The QS meetup groups are ideal as early adopter
and evaluation communities. The group members al-
ready track and analyse their data in various ways and
in general carry out wide ranging, complex exper-
ICSOFT-EA2015-10thInternationalConferenceonSoftwareEngineeringandApplications
70
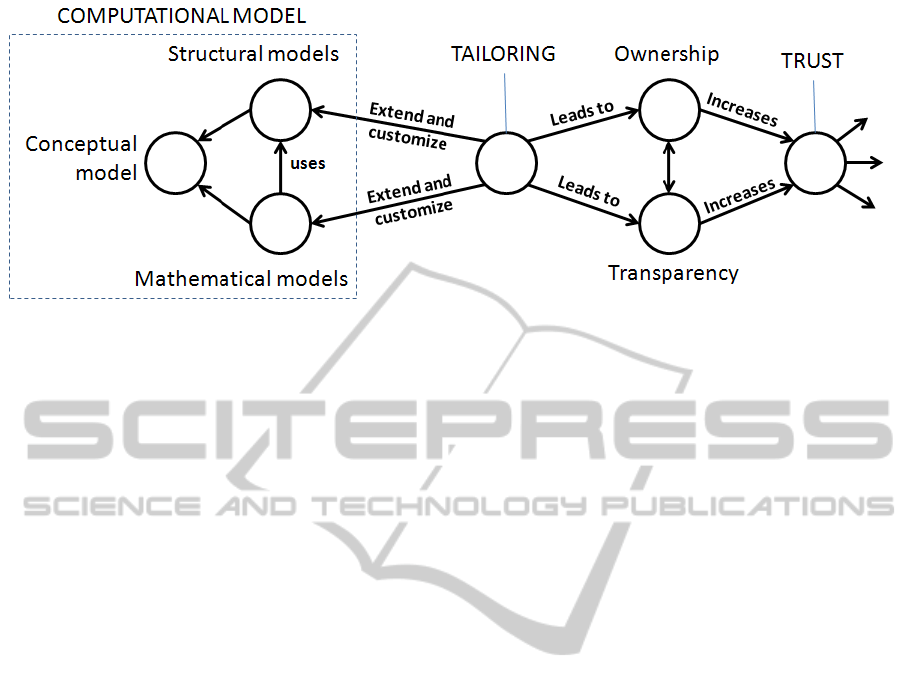
Figure 10: Tool transparency and process ownership generates trust in a tool. Tools that can be customised naturally become
more transparent, and users will feel a responsibility towards the tool’s actions and hence, process ownership. To achieve this,
QS Mapper implements the separation of structural, conceptual, and mathematical models shown within the computational
model in the figure above.
iments with monitoring, visualisation, and analysis.
We hope to start evaluation experiments soon.
5 CONCLUSIONS
In this paper, we have found trust to be a key factor in
QS data aggregator success. Tool transparency and
process ownership are two concepts that have high
impact on trust. As Figure 10 shows, these two con-
cepts are supported by building software systems that
can be tailored to match individual needs.
To allow humans to tailor machine functionality
to fit their specific needs, it must be possible to create
links between their data (e.g., “this is my mood data”)
and some piece of machine code (e.g., “do a daily av-
erage of this input”). We use the expression two-way
mappings for such links between semantics and logic.
The best method for allowing users (humans) to
create two way mappings is using drag and drop.
From a usability point of view, this is a preferable ges-
ture because of its similarity with actually connecting
two objects in the physical world.
Usability experts might argue that too many two-
way mappings would go against the “Don’t make me
think!” philosophy (Krug, 2005). But we believe
that a higher degree of user involvement will help in-
crease the data literacy of those same users. In the
business of software, teaching the users actual skills
and encouraging learning while using a software sys-
tem, will be beneficial not only for the user, but for
the business as well (Sierra, 2015). Focusing on an-
alytical capabilities and data literacy will get the QS
movement further along towards their respective ob-
jectives. Once individual users understand the bene-
fits of analysing and understanding their own data, the
demand for relevant technology should follow. Or-
ganisations and businesses have had such capabili-
ties for years, the self-hacking project wants to put
them into the hands of individual users (Lukas and
midata et al., 2015).
ACKNOWLEDGEMENTS
The global QS communities help drive the right tool
developments forward and they have had a huge pos-
itive impact on the work presented here. A special
thanks to the members of the London self-hacking
working group and Gary Wolf for supplying the sam-
ple step data used in our scenario.
REFERENCES
Augemberg, K. (2012). Building that perfect quan-
tified self app: Notes to developers, part 1.
http://measuredme.com/2012/10/building-that-
perfect-quantified-self-app. [Online; accessed March
27 2015].
Choe, E. K., Lee, N. B., Lee, B., Pratt, W., and Kientz, J. A.
(2014). Understanding quantified-selfers’ practices in
collecting and exploring personal data. In Proceed-
ings of the SIGCHI Conference on Human Factors in
Computing Systems, CHI ’14, pages 1143–1152, New
York, NY, USA. ACM.
E. K. Choe, N. B. Lee, B. L. W. P. and Kientz, J. A. (2014).
Understanding quantified-selfers’ practices in collect-
ing and exploring personal data. Proceedings of the
SIGCHI Conference on Human Factors in Computing
Systems, pages 1141–1152.
Fluxtream (2015). Fluxtream web application. [last visited
March 5th 2015].
Google (2015). Getting started with google bigquery.
QSMapper:ATransparentDataAggregatorfortheQuantifiedSelf-FreedomfromParticularityUsingTwo-way
Mappings
71

Kleine, D. (2011). The capability approach and the
‘medium of choice’: steps towards conceptualising in-
formation and communication technologies for devel-
opment. Ethics and Inf. Technol., 13(2):119–130.
Krug, S. (2005). Don’t Make Me Think: A Common Sense
Approach to Web Usability, 2nd Edition. New Riders,
Pearson Education.
Labs, I. (2015). Data sense. last visited March 5th 2015.
Lanier, J. (2014). Who owns the future? Penguin.
Licklider, J. C. R. (1960). Man-computer symbiosis. IRE
transactions on human factors in electronics, pages
4–11.
Lukas, A. and midata et al. (2015). Proposal for self-
hacking vm project to increase analytical capabilities
for individual users. unpublished.
Marshall, C. C. and Shipman, III, F. M. (1995). Spatial
hypertext: Designing for change. Commun. ACM,
38(8):88–97.
McGuffin, M. J. (2012). Simple algorithms for network vi-
sualization: A tutorial. TSINGHUA SCIENCE AND
TECHNOLOGY, 17(4):1–16.
Melnik, S., Gubarev, A., Long, J. J., Romer, G., Shivaku-
mar, S., Tolton, M., and Vassilakis, T. (2010). Dremel:
Interactive analysis of web-scale datasets. Proceed-
ings of the VLDB Endowment, 3(1).
Petersen, R. R. (2012). Criminal Network Investigation:
Processes, Tools, and Techniques. University of
Southern Denmark, Odense, Denmark.
Petersen, R. R. and Wiil, U. K. (2009). Asap: A lightweight
tool for agile planning. In Proceedings of the 4th In-
ternational Conference on Software and Data Tech-
nologies (ICSOFT), pages 265–272.
QS (2014). Quantified self europe.
http://quantifiedself.com/conference/Amsterdam-
2014/. [Online; accessed 26-May-2014].
Realidata (2015). rtracker. [Online; accessed March 27
2015].
Sierra, K. (2015). Badass: Making Users Awesome.
O’Reilly.
Swan, M. (2013). The quantified self: Fundamental disrup-
tion in big data science and biological discovery. Big
Data, 1(2):85–99.
Track and Apps, S. (2015). Tracknshare.
http://www.trackandshareapps.com/. [Online;
accessed March 27 2015].
ICSOFT-EA2015-10thInternationalConferenceonSoftwareEngineeringandApplications
72
