
Automatic Detection of MEO Satellite Streaks from Single Long
Exposure Astronomic Images
Anca Ciurte and Radu Danescu
Computer Science Department, Technical University of Cluj-Napoca,28 Memorandumului, Cluj-Napoca, Romania
Keywords: Space Surveillance, Streak Detection, Medium Earth Orbit Satellites, Radon Transform.
Abstract: Nowadays, there is an increased interest in achieving an accurate surveillance of the sky, since the number
of objects in Earth’s orbit (active satellites and debris) is continuously increasing. The satellites constantly
need to be supervised in order to notice their deviations from their trajectories and update their coordinates.
This paper presents a new method for satellite detection in 2D astronomic images acquired with a cheap,
easy to set up optical surveillance system. The proposed method use the Radon Transform in order to
identify satellite strikes in images followed by a set of decision rules to decide whether the streak is a
satellite or not. The method was tested on multiple sequences of astronomic images, and was found to have
a very high detection rate, along with a very low false positive rate.
1 INTRODUCTION
The Earth orbits are populated by an increasing
number of functional and non-functional space
objects. We refer to debris as the man-made non-
functional space objects and to active satellites as
the functional space objects. Because of this increase
of space debris, there is a real need for sky
surveillance in order to monitoring either the
satellites or the non-functional space objects for
different purposes, such as to correct the satellites
deviations from their trajectories, to detect un-
cataloged space debris objects and to avoid possible
collisions. Therefore, the space debris population
has been extensively studied during the last decade
and several surveillance systems based on radars or
optical devices were developed for sky surveillance.
Radar systems are mostly used for low orbit
surveillance for object detection and tracking, while
for orbits greater than 20000 km, the optical systems
are preferred since they have a better detection rate
to power requirement ratio. A detailed survey on
optical solutions for space debris observations is
presented in (Schildknecht, 2007).
In this paper we concentrate our attention on
satellite detection for the medium earth orbits
(MEO) using a cheap optical survey system.
According to (Capderou, 2005), MEOs are classified
as orbits with altitudes around 20000 km, while the
Low Earth Orbits (LEOs) are bellow 2000 km and
Geostationary Earth Orbits (GEOs) are around
36000 km from the ground. The satellites found in
the MEO space are generally part of Global
Navigation Satellite Systems (GNSS) (Klinkrad,
2002) such as:
- GPS (Global Positioning System) USA, U.S.
Department of Defense, complete operational
system, orbit major axis of 26578 km (20200 km
from Earth’s surface), 6 orbital planes, 4 satellites
on each orbit, and orbital inclination of 55º.
- GLONASS Russia, Russian Space Forces and
Ministry of Defense of the Russian Federation,
complete operational system, orbit major axis of
25510 km, 3 orbital planes, a total number of 21
satellites, and orbital inclination of 45º (Each
satellite operates in a circular 19100 km orbit at an
inclination angle of 64.8 degrees and each satellite
completes an orbit in approximately 11 hours 15
minutes.)
- GALILEO European Union – ESA (European
Space Agency), with only 3 operational satellites
per orbit, major axis of the orbit of 29600 km, 3
orbital planes, a total number of 30 satellites and
orbit inclination of 56º.
Few studies exist in literature for satellites
streaks detection in astronomic images, since this
topic is relatively new. A first method for streaks
detection was proposed in (Wallace, 2007). This
538
Ciurte A. and Danescu R..
Automatic Detection of MEO Satellite Streaks from Single Long Exposure Astronomic Images.
DOI: 10.5220/0004721505380544
In Proceedings of the 9th International Conference on Computer Vision Theory and Applications (VISAPP-2014), pages 538-544
ISBN: 978-989-758-003-1
Copyright
c
2014 SCITEPRESS (Science and Technology Publications, Lda.)
method takes a first step to estimate the background
noise, followed by a step where all the objects above
the estimated noise are determined. Image moments
are then used to discriminate the streaks from the
point-like objects that usually correspond to stars.
Levesque et al. present several contributions in
(Lévesque, 2007), (Lévesque, 2009), with relevant
results. Their work employs multiple techniques for
background modeling and removing, for star
detection and for streak detection using oriented
filters.
Another more recent approach was presented in
(Oniga, 2011) for LEO satellites detection in
sequences of images. This work was extended in
(Danescu, 2012) with a technique for measuring
their 3D position in an Earth-bound coordinate
system. The background (including the stars) is
estimated based on previous frames in the sequence.
Then the streaks are detected in the difference image
between current frame and estimated background, by
classifying the resulted objects based on their
characteristics such as: area, major axis length,
minor axis length, eccentricity, equivalent diameter,
perimeter and solidity. Two identical observation
systems are used, the satellite streaks are detected in
each of the images, and epipolar geometry based
stereovision is employed for 3D position estimation.
Motivated by the applicative importance of this
topic, we introduce in this paper a new and robust
approach for the detection of MEO satellite streaks.
The proposed method is able to detect satellites
streaks using only intensity information from a 2D
image, helping thus detection in early stages within
an observation sequence. This method can be further
sped up by using additional cues, such as stereo
information, predictions of the satellite position in
the upcoming frames of the sequence and others.
The structure of this paper is as follows. In
Section 2 we present the proposed method along the
details of the theoretical background. Some tests and
results are presented in Section 3. The paper
concludes with Section 4 where some conclusions
and future work lines are discussed.
2 PROPOSED METHOD
In this section we describe the proposed method for
MEO satellites detection in astronomic images.
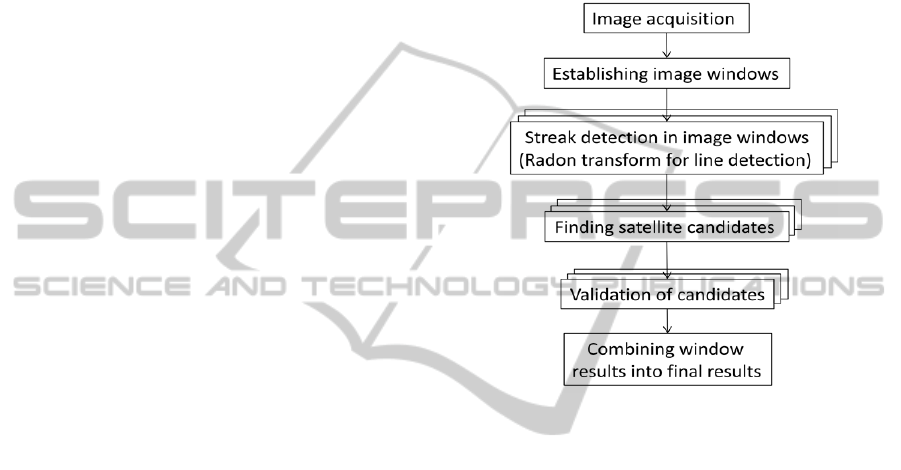
Figure 1 presents the block diagram that summarizes
our method. First, sequences of images are acquired
with our own optical system. The satellite streak
detection is then performed independently in each
obtained image. For a higher precision, the input
image is split into several fixed size sub-images (or
image windows). A list of satellite candidates is
generated for each image window based on the
Radon transform for linear features detection. The
validation of the candidates is then made by means
of an original metric. The results of all the sub-
images are summed up and a final image is
generated, in which the detected satellites are
marked in green.
Figure 1: Block diagram.
All the mentioned steps are further detailed in
the following sections. We begin by describing the
astronomic optical system and the image acquisition
protocol in order to better understand the addressed
problem.
2.1 Image Acquisition
The image acquisition system consists of two optical
sensors that are placed in two different locations at a
physical distance of 37 km. Each sensor has the
following components:
- Newtonian 150mm, f/5 telescopes (D=150mm,
F=750mm),
- DSLR Canon EOS 50D (2352 x 1568 pixels)
camera, (9.4 μm x 9.4 μm) pixel size
- Equatorial tracking mount, type Celestron CG5.
- GPS based trigger for acquisition
synchronization.
The acquisition is performed simultaneously with
the two sensors at an exposure time of 5 seconds and
the time between two frames of 8 seconds. The
angular field of view of the optical system is
approximately 1.5 degrees.
AutomaticDetectionofMEOSatelliteStreaksfromSingleLongExposureAstronomicImages
539
Due to the equatorial tracking mount with which the
system is equipped, the stars are tracked during the
exposure time of the acquisition process, offering
thus the advantage of a relatively fixed background.
Since the exposure time takes several seconds, the
MEO moving objects will be the only objects that
will appear as a line segments. We will refer them as
satellites streaks. The typical speed of a MEO
satellite is known to be 3.9 km/s. Therefore, for an
average altitude of 20000 km, the satellite will
appear in the acquired images as a line segment of
an approximate length of 78 pixels. Satellite length
will however vary according to its altitude, angle of
observation, possible variation of brightness due to
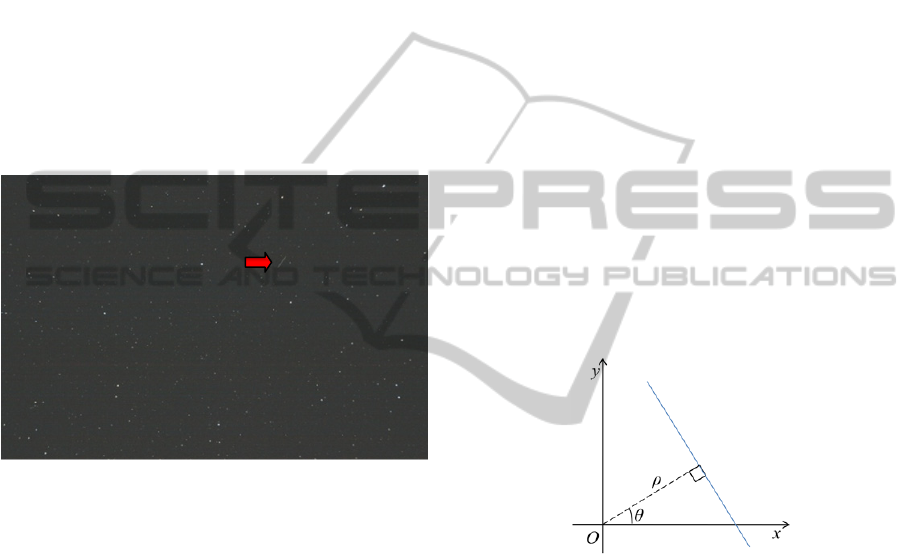
its own rotation movement, etc. An example of
image is provided in Figure 2, where the satellite is
indicated by the red arrow.
Figure 2: Example of MEO object (Glonass, 733).
2.2 Streak Detection in Image Windows
Having defined the main characteristics of the
satellites appearance in our sequences of images, we
look forward to identify the line segments of a
certain length in images. The idea was to exploit the
‘line segment’ appearance of the satellite’s streaks,
which is the main feature in this type of images, and
use powerful image processing techniques for line
detection such as Hough transform or Radon
transform to identify them.
Because the Hough transform is designed for a
reduced amount of points of interest, usually
obtained through thresholding, we choose instead to
use the Radon transform in order to increase the
detection chances for faint satellites.
Moreover, because the satellite streaks are
relatively small with respect to the image size, we
choose to process smaller image windows and then
recombine the results to obtain the final results.
The theoretical background of the Radon
transform is described in the following sub-section.
2.2.1 Radon Transform for Line Detection
The Radon transform is a feature extraction
technique designed to solve the problem of finding
parametric shapes (such as lines) through a voting
procedure. Radon transform problem was first
studied by Johann Radon in (Radon, 1917) in a
general form and then by Deans in (Deans, 1983)
who defined it the way it is used nowadays in
computer vision domain, along with some of its
applications.
Given a 2D image I, and denoting by (x,y) the
image coordinates for an image point, according to
(Deans, 1983) the Radon transform is the mapping
between the image space and a parametric space
defined by the line integral (projections) of I along
all possible lines L in the image plane. In order to
obtain a bounded parametric space, the line equation
is considered to be expressed in the normal form:
cos
,
(1)
where represent the distance from the origin to the
line, and ∈
0,2
is the angle of the vector from
the origin to the closest point on the line, as
illustrated in Figure 3.
Figure 3: Line parameterization in the normal form.
Therefore, the definition of the parametric space
equivalent R of the image I, for all combinations of
the parameters ρ and θ, is as follows:
R
,
,
,
(2)
where ds is an increment of length along line L.
Each position , in the parametric space will
sum up the votes for the line L of parameters ,
as the sum of the line intensities in image space. The
object candidates are then found among the local
maxima in the parametric space. Knowing that the
satellite streaks have high intensity with respect to
(w.r.t.) the dark background (representing the night
sky), high values should be assigned in parametric
space for the satellite line.
Still, because the length of the satellite streak is
very small w.r.t. image size, and because the
VISAPP2014-InternationalConferenceonComputerVisionTheoryandApplications
540
astronomic images also contain many stars which
have high intensities in the long exposure image
(very often much higher than the satellite), finding
the satellite related local maximum in a Radon
transform for the entire image is impossible. For this
reason, we propose to apply the Radon transform on
smaller image windows and then recombine all the
processing results in order to obtain the final result.
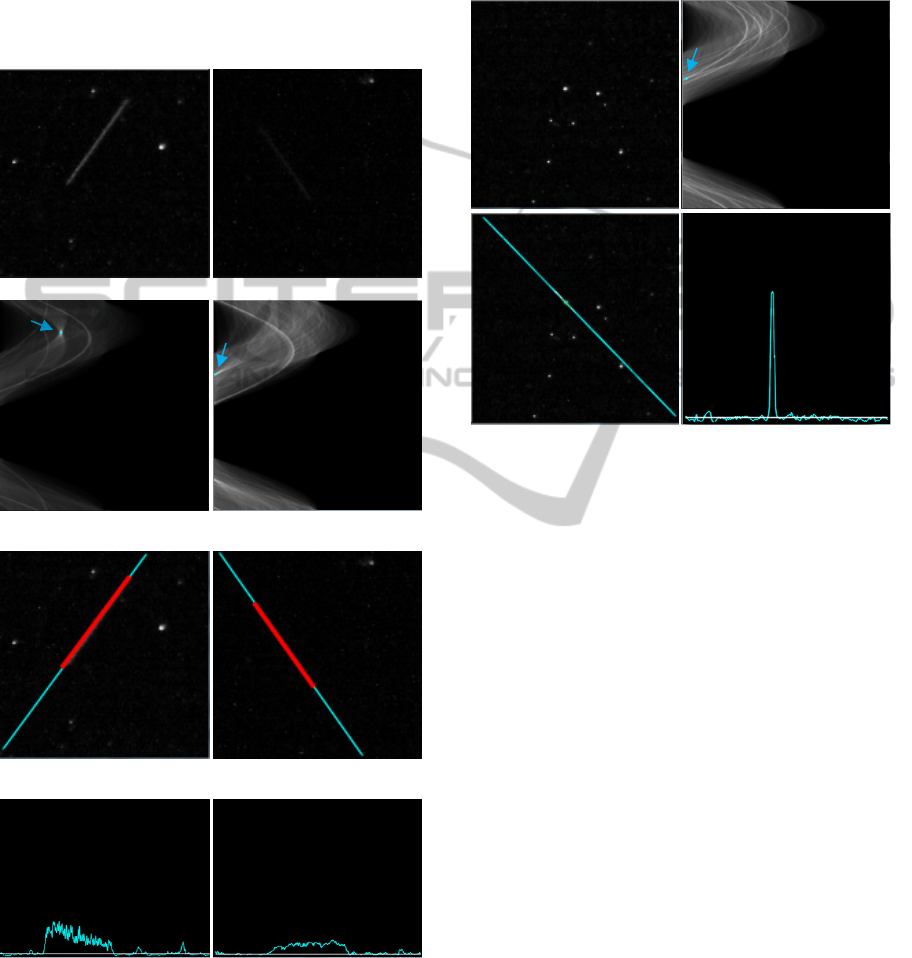
a) Searching windows: 733 (left) and PRN08 (right) satellites.
b) The corresponding parametric space. (the local maximum with
highest intensity is marked with a cyan dot)
c) The image lines corresponding to the local maximum (in cyan)
and the detected (satellite in red)
d) Plot of the cyan line intensities (from fig. c))
Figure 4: Example of searching window containing
satellite streaks.
Figure 4 shows some examples of visual result of
such image windows in the first row for the Glonass
733 (left) and GPS- PRN08 (right) satellites and the
corresponding parametric space obtained based on
Radon transform in the second row.
An example of image window that does not
contain a satellite streak and its corresponding
parametric space equivalent are shown in Figure 5.
Figure 5: Example of a searching window without any
satellite streaks and its corresponding parametric space.
2.3 Finding Satellite Candidates
The Radon parametric space is further processed in
order to establish the satellite candidates. A list
of local maxima is generated for each image
window:
,
|
,
,
,
,
1,0,1,
(3)
Our choice of processing relatively small image
windows is a strong enough constraint that imposes
the fact that, if the satellite exists, it will correspond
to the local maxima with the highest intensity in the
parametric space. But, in order to treat the
exceptional case when more satellites might occur in
a single image window (which is however not the
case for our dataset), we choose to consider as
satellite candidates the first three local maxima with
the highest votes in the parametric space. A visual
example of the local maximum with the highest vote
in parametric space is displayed in Figure 4. b)
(marked by a cyan dot) and its corresponding
reconstructed line in the image space in Figure 4.
b).
AutomaticDetectionofMEOSatelliteStreaksfromSingleLongExposureAstronomicImages
541
2.4 Validation of Candidates
At this point, each image window has three
candidates given as pairs of parameters
,
in the
parameter space. In order to validate the candidates,
we define the following metric.
Proposed metric. For a given candidate
,
in the
parametric space, we reconstruct the corresponding
line in the image (x, y) space and we plot the
intensities of the line points:
,
|
,
,
cos
(4)
as illustrated in Figure 4 d), where
is the image
intensity of the pixel
. It can be noticed that if this
candidate corresponds to a satellite trajectory, then
several consecutive line points will have higher
intensity than the background value (TH
bk
), since the
observed satellites are brighter than the average
night sky intensity (see Figure 4 against Figure 5).
Thus, the definition of the proposed metric is as
follows:
Valid(
,
)← ∃,:,0,
,
,
,
,
,
,
1
,…
…,
,
(5)
where
is the minimum length that a
satellite streak could have. Since we know that the
mean length of a MEO satellite is around 78 pixels,
this parameter can easily be set up.
3 TESTS AND RESULTS
Tests were performed on a dataset of 294 images
(image size = 23571568 pixels). The images
were acquired simultaneously with the two
mentioned cameras, meaning 147 images with each
camera and two sets of images for each satellite. The
followed objects in these sequences are four MEO
satellites: two GLONASS (733, 738) and two GPS
(PRN10, PRN08). The number of images where the
satellites are visible is indicated in Table 1.
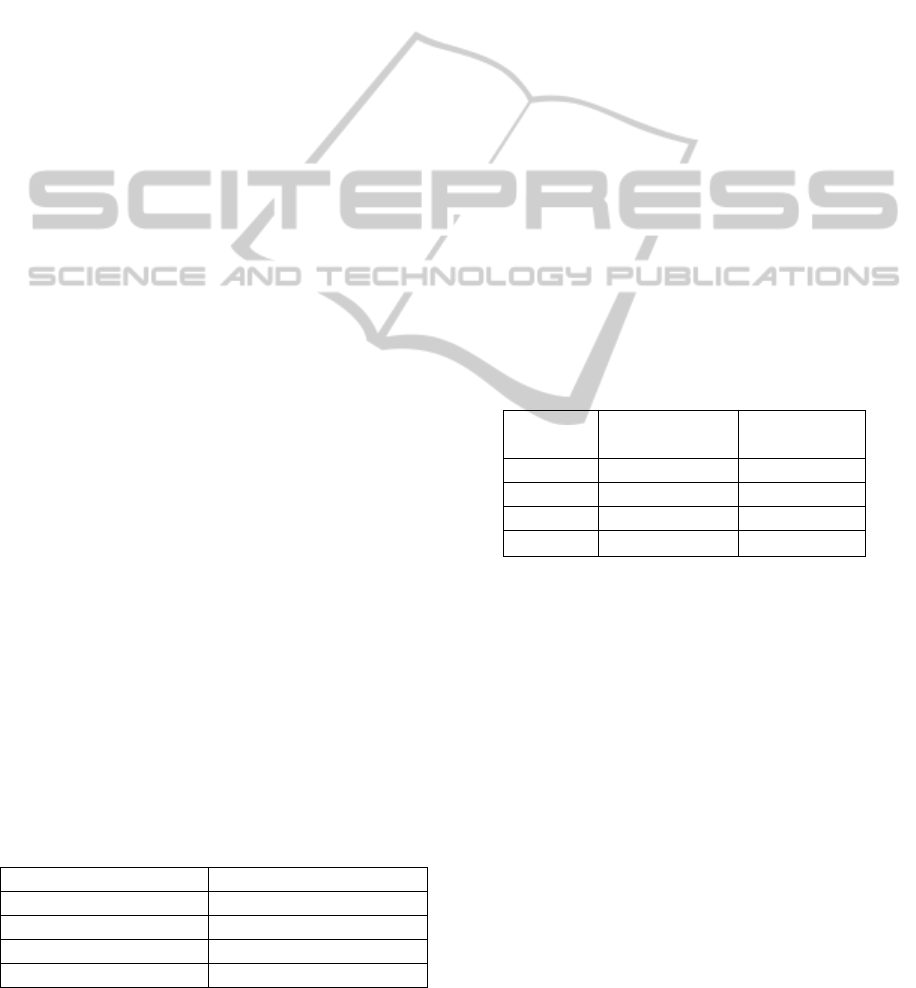
Table 1: Observed satellites in our dataset.
Satellite No of images
733 31
738 28
PRN10 39
PRN08 32
For all images we use the same parameter
settings, as follows:
- Image window of fixed size 151151
pixels and the distance between two image
windows of 75 pixels, resulting around 650
overlapped searching windows per image,
- The background value
equals to the
median intensity value of the whole image
window ,
- The low boundary for the satellite length
60 pixels.
Some visual detection results are displayed in
Figure 6 a), where the detected satellites are marked
in green. Because of the high resolution of the
images, we chose to display only the cropped area of
interest from the original image results.
Comparative tests were performed against the
method proposed in (Oniga, 2011). See Fig. 6 b) for
the visual results.
An overall detection rate of one hundred percent
was obtained for our dataset, while only 80.76%
was obtained with the comparative method (Oniga,
2011). Detailed statistics with the detection rate for
each satellite is presented in Table 2.
Table 2: Satellite detection rate in comparison with
(Oniga, 2011).
Satellite (Oniga, 2011) Proposed
method
733 100% 100%
738 100% 100%
PRN10 69% 100%
PRN08 59% 100%
It can be noticed that our method successfully
detects different types of satellites acquired with
different cameras. It proved to deal well in detecting
faint satellites instead the proposed method (Oniga,
2011) although proved to be more sensitive in
detecting the GPS satellites which appear fainter
than the GLONASS.
4 CONCLUSIONS
A new and robust method is proposed in this paper
for MEO satellite detection. The central concept of
the method is the use of the Radon transform on
overlapping search windows, for identification of
very faint linear structures. The resulted linear
hypotheses are validated based on their intensity
profile along the support line.
VISAPP2014-InternationalConferenceonComputerVisionTheoryandApplications
542
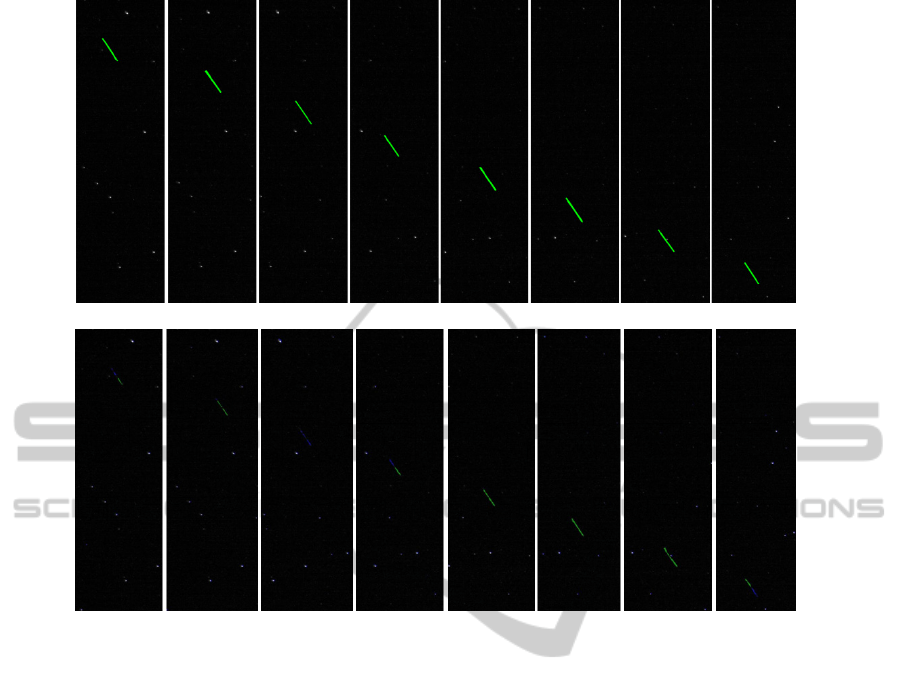
a) Proposed method. Detected object is marked in green.
b) Comparative method (Oniga, 2011). Detected object is marked in green and other possible candidates in blue.
Figure 6: Detection result for GPS PRN08 in eigth consecutive frames.
The proposed technique proves to be a high
confidence MEO satellite detection solution,
capable of being used even with cheap and easy to
set up optical observation systems.
The method was tested on several astronomic
sequences of images containing two different types
of satellites and acquired with two different
cameras, having different responses due to
differences in location and in intrinsic capabilities
of the devices. A high accuracy of 100% detection
rate was obtained under all these conditions. The
method robustness was also proved against a state
of the art method, obtaining a higher accuracy rate
and a more precise identification of the object
location in image.
Additional tests need to be performed on higher
and varied datasets in order to extensively validate
our method.
ACKNOWLEDGEMENTS
This work was supported by a grant of the
Romanian National Authority for Scientific
Research, CNDI–UEFISCDI, project code PN-II-
PT-PCCA-2011-3.2-0651, contract number
210/2012, “Automatic Medium and High Earth
Orbit Observation System Based on Stereovision”
(AMHEOS).
REFERENCES
Capderou, M. 2005. Satellites Orbits and Missions.
France: Springer-Verlag.
Danescu, R., Oniga, F., Turcu, V., Cristea, O. 2012.
Long Baseline Stereovision for Automatic Detection
and Ranging of Moving Objects in the Night Sky.
Sensors Journal, 12(10): 12940-12963.
Deans, S. R. 1983. The Radon Transform and Some of
Its Applications, New York: John Wiley & Sons.
Klinkrad, H. 2002. Monitoring Space – Efforts Made by
European Countries, International Colloquium on
Europe and Space Debris, Toulouse, France, pp. 27-
28.
Lévesque, M. P. 2009. Image and processing models for
satellite detection in images acquired by Space-
based Surveillance-of-Space sensors, Technical
Report no. DRDC Valcartier TR 2005-386.
AutomaticDetectionofMEOSatelliteStreaksfromSingleLongExposureAstronomicImages
543

Lévesque, M. P., Buteau S. 2007. Image Processing
Technique for Automatic Detection of Satellite
Streaks, Technical Report no. DRDC Valcartier TR-
2005-386.
Oniga, F., Miron, M., Danescu, R., Nedevschi, S. 2011.
Automatic recognition of low earth orbit objects
from image sequences, IEEE International
Conference on Intelligent Computer Communication
and Processing, pp. 335-338.
Radon, J. 1917. Über die Bestimmung von Funktionen
durch ihre Integralwerte längs gewisser
Mannigfaltigkeiten, Berichte über die
Verhandlungen der Königlich-Sächsischen
Akademie der Wissenschaften zu Leipzig,
Mathematisch-Physische Klasse, Leipzig: Teubner.
(69): 262–277. Translation: Radon, J., Parks, P.C.
(translator) 1986. On the determination of functions
from their integral values along certain manifolds,
IEEE Transactions on Medical Imaging, 5(4): 170-
176.
Schildknecht, T. 2007. Optical surveys for space debris.
The Astronomy and Astrophysics Review, 14: 41-
111.
Wallace, B. 2007. The DRDC Ottawa Space
Surveillance Observatory, Advanced Maui Optical
and Space Surveillance Technologies, 1: 12-20.
VISAPP2014-InternationalConferenceonComputerVisionTheoryandApplications
544
