
Watershed from Propagated Markers based on Morphological
Hierarchical Segmentation and Graph Matching
Andr´e Roberto Ortoncelli and Franklin C´esar Flores
Department of informatics, UEM - State University of Maring´a, Av. Colombo - 5.790, Maring´a, Brazil
Keywords:
Watershed from Propagated Markers, Morphological Image Segmentation, Graph Matching, Hierarchical
Segmentation, Interactive Object Segmentation in Image Sequences.
Abstract:
Watershed from propagated markers is a generic method to interactive segmentation of objects in image se-
quences, given by the combination of classical watershed from markers technique to motion estimation. The
mask of segmentation, given by the segmentation of the object in the previous frame, is the main parameter
to compute a set of markers to segment the same objects in the current frame. This paper introduces a new
version of the watershed from propagated markers. In this proposal, the set of markers and its associated
model graph are constructed in function of the mask of segmentation. The input graph is constructed given by
the hierarchical segmentation of the next frame. The graph matching between the model graph and the input
graph provides a pre-segmentation mask that will be used to compute the initial markers to the next frame.
Experiments were done to illustrate the performance of the new version and its comparison to methods found
in the literature and to previous versions of the watershed from propagated markers.
1 INTRODUCTION
Object segmentation in image sequences is the frame-
to-frame segmentation of objects whose semantics
remains unchanged, and it is a very important step
in video processing frameworks (Ngan, 2011). Ba-
sically, it consists in a segmentation-and-tracking
framework: the object of interest is segmented in
the current frame in order to be tracked to the next
frame, where it will be segmented again, and so on.
Techniques that do object segmentation in image se-
quences may be classified into the following segmen-
tation categories: automatic (or non-supervised), as-
sisted (or supervised or also interactive) and semi-
automatic. In the automatic segmentation, the ob-
jects are detected automatically in the initial frame
and they are tracked through the following frames,
without user intervention.
Assisted methods offer the option to alter the seg-
mentation results: user may choose the object to
be segmented and fix the segmentation/tracking re-
sults. Usually four properties are desirable for as-
sisted methods: interactivity, generality, rapid re-
sponse and progressive manual edition (Flores and
Lotufo, 2010a).
Some methods may be classified into a semi-
automatic category: the user, for instance, selects an
object in a small set of frames, and, then, he may not
intervene in the segmentation process anymore.
The watershed from propagated markers (Flores
and Lotufo, 2010a) is an assisted method for ob-
ject segmentation in image sequences, given by the
combination of the classical watershed from mark-
ers (Beucher and Meyer, 1992) technique with mo-
tion estimation (Beauchemin and Barron, 1995). Ini-
tially, the objects are segmented interactively, in order
to semantically define the objects of interest. Then,
the objects are segmented in a frame-to-frame basis,
where the segmentation of such objects in the previ-
ous frame provides markers that will be used to track
and segment the same objects to the current frame, if
there are errors in the segmentation, the user can in-
teractively fixes the results by inserting or removing
markers.
Watershed from propagated markers is not a hard
concept. It allows the research of alternative ways
to segment and track the objects by designing new
types of markers. This work proposes the applica-
tion of graph matching in the segmentation frame-
work. Graph matching consists in to find a correspon-
dence among sets of vertices in graphs, where each
set may contain attributes about appearance, local fea-
tures, and / or their relationships with other sets. This
information is used to calculate the matching. Graph
320
Roberto Ortoncelli A. and César Flores F..
Watershed from Propagated Markers based on Morphological Hierarchical Segmentation and Graph Matching.
DOI: 10.5220/0004689503200328
In Proceedings of the 9th International Conference on Computer Vision Theory and Applications (VISAPP-2014), pages 320-328
ISBN: 978-989-758-003-1
Copyright
c
2014 SCITEPRESS (Science and Technology Publications, Lda.)

matching methods have several applications such as
2D and 3D image analysis, biometrics, biomedical
and biological frameworks, etc (Conte et al., 2004).
1.1 Literature Review
There are in the literature previous versions of the
watershed from propagated markers include the one
based on binding of markers (Flores and Lotufo,
2010a), spatial temporal gradient (Flores and Lotufo,
2010b), and border tracking by graph matching (Or-
toncelli and Flores, 2013).
In (Flores and Lotufo, 2010a) binding of markers
created around the border of the segmentation mask
were propagated by the Lucas and Kanade optical
flow computation method (Beauchemin and Barron,
1995) in orther to segment the next frame, the same
method is used to do the propagation in (Flores and
Lotufo, 2010b), but this watershed from propagated
markers variation also uses a spatio-temporal gradi-
ent to segment the images. This gradient is computed
with a 3-D structuring element.
Another version of the watershed from propagated
markers is based on graph matching (Ortoncelli and
Flores, 2013). In this version, graph matching is ap-
plied to propagate markers from the previous frame
to the current one. A model graph represents markers
in the previus frames, and a frame graph represents
the hierarchical segmentation of current frame. An
energy function is used to match each edge of model
graph with one edge of the frame graph, the result of
this matching it is used as markers to segment the ob-
ject of interest in the current frame.
In the literature, graph matching is also used to
segment images without the wathershed from propa-
gated markers. In (Noma et al., 2012), the user inputs
markers that will be used to create a model graph.
Then, a graph matching method is used to compute
the correspondence between this graph and another
one based on the image regions, the result of this
matching is the segmented image. In (Noma et al.,
2012) also is presented a semi-automatic variation of
the proposed method, in wich a image sequence is
segmented with the same set of markers computing
the matching for each image of the sequence.
The seeded region growing (SRG) algorithm
(Adams and Bischof, 1994) is similar to graph match-
ing methods in the context of image segmentation.
The SRG algorithm consists in a sequential labelling
technique, in which each iteraction labels only one
pixel that neighbours the already labelled pixels and
the aggregation criterion is given by a dissimilarity
measure (in graph matching methods the all the re-
gions are labelled in only one iteraction). In the liter-
ature there are automatic (Fan et al., 2001) and semi-
automatic (Zhi and Jie, 2004) methods that extends
SRG algorithm from the pixel level for the regional
one in order to segment image sequences. In (Zhi
and Jie, 2004) it is also proposed a method variation
in which is possible correct interactively the segmen-
tation errors.
1.2 Contributions
Despite the good segmentation results providedby the
support of graph matching techniques, The interac-
tive correction of errors and resegmentation due the
mispropagation of the markers (or in the segmenta-
tion) may be costly, because graph matching tech-
niques are sometimes heavy tasks, the interactive ap-
proach would contradict one of the desirable proper-
ties of the interactive segmentation methods: rapid re-
sponse (Flores and Lotufo, 2010a).
To solve this problem the combination between
watershed from propagated markers and graph match-
ing is a good alternative, that is comproved in (Orton-
celli and Flores, 2013). In this paper it was proposed a
new way to combine these methods. Given the mask
of segmentation from the previous frame, the model
graph is computed from this mask, and this model is
matched (with a graph matching method (Noma et al.,
2012)) to the previously computed graph (that rep-
resents the hierarchical segmentation of the current
frame) in order to find a pre-segmentation mask of
the objects of interest in the current frame in order
to create the markers that will be applied to the seg-
mentation of the current frame with watershed from
markers.
This new approach is better than use only a graph
matching method, because the matching is done just
once in the beginning of the processing of the current
frame, in order to create markers. Given the com-
puted markers, watershed from markers is applied to
compute the segmentation of the objects of interest. If
there are errors in the segmentation, the user can cor-
rect then interactively, adding or removing markers,
but how this time the segmentation is done with wa-
tershed from markers, the response for the user is very
fast. Figure 1 illustrates the watershed from propa-
gated markers variation proposed in this paper.
This approach differs from the watershed from
propagated markers variation proposed in (Ortoncelli
and Flores, 2013), because in this approach it was
computed a pre-segmentation mask of the frame by
a graph matching method in order to compute de
markers, and in (Ortoncelli and Flores, 2013) a graph
matching method is used to directly propagate the
markers. This new approach showed more efficient
WatershedfromPropagatedMarkersbasedonMorphologicalHierarchicalSegmentationandGraphMatching
321
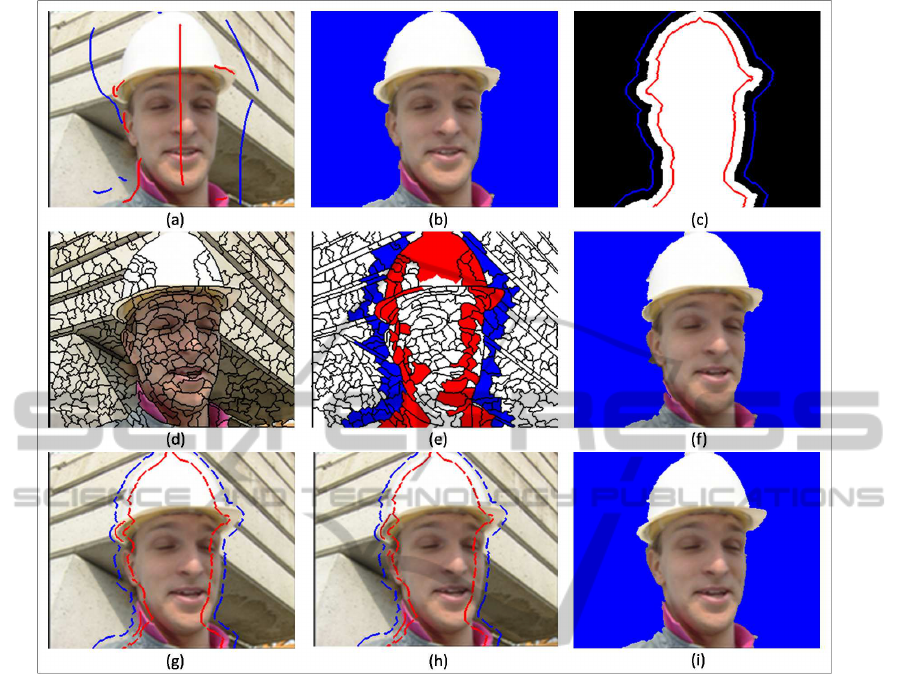
Figure 1: Proposed approach: (a) Marker imposed by the user in the image j; (b) Image segmented with the method watershed
from markers; (c) The scribbes generated from the segmentation mask of the image; (d) Input Graph; (e) Model Graph based
on the scribbes from the image c; (f) Graph matching result. (g) Marker propagated; (h) Marker with user intervention; (i)
Final segmentation of the image j+1 (after refinement).
and robust results.
The advantage of the proposed approach is that
it leads to the creation of more accurated mark-
ers. More, since watershed from propagated mark-
ers meets all desirable features of interactive segmen-
tation methods (Flores and Lotufo, 2010a), the pro-
posed method is efficient and robust, what can be seen
in the experimental results (Section 4), which shows
the comparison among the new proposal with oth-
ers methods: the standard watershed from markers
(Beucher and Meyer, 1992) (in wich the user input
interactively makers for each frame, without propa-
gation, in order to create the ground truth), tree varia-
tions of the watershed from propagated markers (Flo-
res and Lotufo, 2010a; Flores and Lotufo, 2010b; Or-
toncelli and Flores, 2013), and two semi-automatic
methods, also based on the morphological hierarchi-
cal segmentation (Noma et al., 2012; Zhi and Jie,
2004).
1.3 Paper Organization
This paper is organized as follows: Section 2 presents
some preliminary concepts, needed in the proposal of
this paper. Section 3 presents the proposed method.
The experimental results are in the Section 4. Finally,
the conclusion and the proposal of future works are in
Section 5.
2 GRAPH MATCHING AND
IMAGE SEGMENTATION
An Attributed Relational Graph (ARG) is a graph
which vertices and/or edges are associated to feature
vectors (Tsai and Fu, 1979). An ARG may be for-
mally denoted by G = (V, E, µ,σ), in which V is a
set of vertices, E is a set of directed edges, µ repre-
sents the vertex attributes, and σ represents the edge
VISAPP2014-InternationalConferenceonComputerVisionTheoryandApplications
322
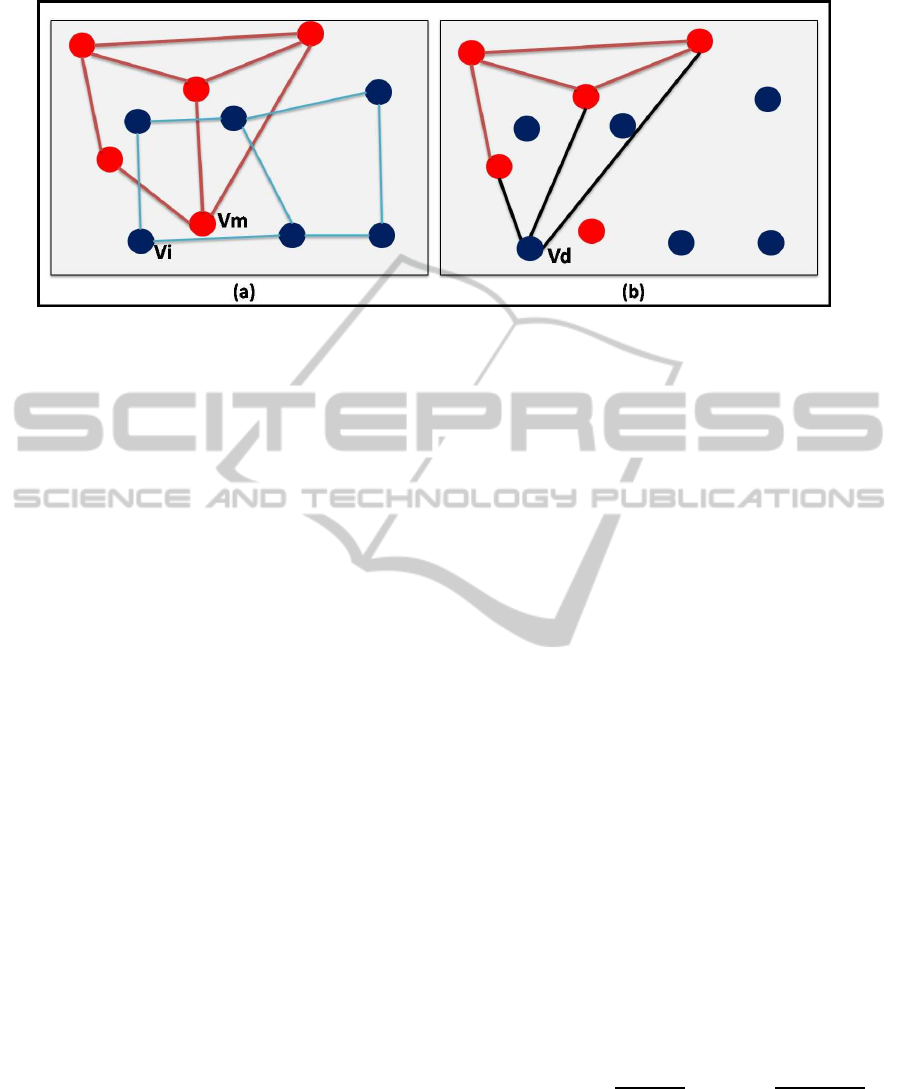
Figure 2: Creation of the deformed graph: (a) graphs G
m
(red) and G
i
(blue); e (b) G
d
(v
m
,v
i
).
attributes. Let |V| and |E| be, respectively, the cardi-
nalities of the vertices set and of the edges set.
Let v ∈ V be a vertex of V and e(v
1
,v
2
) ∈ E an
edge of E. Let v
1
,v
2
∈ V, such that v
1
is adjacent
to v
2
. Let the set µ(v) = (id, color,ctd) be composed
by three attributes: i) id is the label of the vertex. ii)
color is the triple given by the mean of each color
band inside the region represented by the vertex. iii)
ctd is the centroid of the region.
Let e = (v
1
,v
2
) ∈ E, v
1
,v
2
∈ V. Let σ(e) = (ori)
be an unique attribute given by the vector which angle
and norm are defined by the centroids of v
1
and v
2
.
The graph matching method proposed in (Noma
et al., 2012) consists in to find a good correspondence
between two ARG’S: Gi and Gm. The first one, the
input graph, Gi = (V
i
,E
i
,µ
i
,σ
i
) represents all image
regions. Its computation is given by the hierarchi-
cal segmentation of the image (Meyer, 2006; Vachier,
1995): regions define the set of vertices and the edges
are defined by the neighbourhood among these re-
gions. The model graph, Gm = (V
m
,E
m
,µ
m
,σ
m
), is
given by a subgraph of Gi, where vertices are selected
by the intersection with a set of markers (that rep-
resents the foreground and background). If a region
of the hierarchical segmentation is intercepted by a
marker, its corresponding vertex in the input graph is
included as a vertex in the model graph. Markers im-
position and vertices selection may be done, for in-
stance, manually (Noma et al., 2012). The choice of
vertices in the proposal introduced in this paper is de-
scribed below.
The computation of the correspondence between
each vertex of Gm to each vertex of Gi, is a very ex-
pensive task, due combinatorial reasons. An alterna-
tive to overcome this problem is through the deform-
ing graph strategy (Noma et al., 2012).
The deformed graph represents a deformation of
the model graph by replacing a vertex of Gm by a
vertex of Gi. Consider a pair (v
i
,v
m
) of vertices, such
that v
i
∈ V
i
and v
m
∈ V
m
. The deformed graph is de-
noted by Gd(v
i
,v
m
), and it is computed as follows (the
Figure 2 illustrates the creation of a deformed graph):
• For each vertex v
m
∈ V
m
, replace it by each vertex
v
i
∈ V
i
in order to obtain |V
i
| deformed graphs.
– The replacement of v
m
for a vertex v
i
∈ V
i
is
done in a way that the adjacency relations of v
m
remains unchanged. Let the replacing vertex be
denoted by v
d
. The replacement will define an
deformed graph.
– Given this deformed graph, the matching be-
tween v
m
and v
i
is assessed by a cost function
that measures the dissimilarities between the at-
tributes of, respectively, v
d
and v
m
. This cost
function is presented below.
• The best matching between v
m
and a vertex v
i
∈
V
i
is the one whose deformed graph provides the
minimum value from the cost function applicaton.
The region represented by v
i
receives the label of
v
m
.
As stated above, the cost function is given by
the measurement of some dissimilarities between at-
tributes. Before the formalization of the cost function,
the dissimilarity measures need to be reviewed.
The relative position between two vertex is given
by the following equation. It compares two given vec-
tors, ~v
1
and ~v
2
, by considering the angle between them
and their norms:
Cvec(~v
1
, ~v
2
) = λ
2
cosθ− 1
2
+ (1− λ
2
)
||~v
1
| − |~v
2
||
Cs
where cosθ denotes the cosine of the angle between ~v
1
and ~v
2
. |~v| denotes vector norm. Cs is a normalization
term and 0 ≤ λ
2
≤ 1 is a priorization factor (in this
work, it was used λ
2
= 0.5).
The evaluation of structural dissimilarities be-
tween v
i
and v
m
is given by,
WatershedfromPropagatedMarkersbasedonMorphologicalHierarchicalSegmentationandGraphMatching
323
dS(Gd(v
i
,v
m
),Gm) =
1
|E(v
d
)|
∑
e
d
∈E(v
d
)
Cvec(σ(e
d
),σ(e
m
))
where E(v
d
) is the set of deformed edges, connected
to v
d
, and e
m
is the model edge related to v
d
.
The evaluation of appearance dissimilarities be-
tween vd and vm is given by,
dA(v
d
,v
m
) =
Eucl(µ(v
d
).color,µ(v
m
).color)
C
A
in which Eucl computes the Euclidean distance be-
tween two vectors, and the constantC
A
is a normaliza-
tion value for the color difference between v
d
and v
m
,
that is the maximum distance among the color triples.
Let Gd be the deformed graph, and v
d
its respec-
tive deforming vertex. The cost function E(v
i
,v
m
) is
given by
E(v
i
,v
m
) = λ
1
dA+ (1 − λ
1
)
∑
∀e∈E(v
d
)
dS,
in which 0 ≤ λ
1
≤ 1 is a priorization factor (in this
work, it was used λ
1
= 0.5).
3 THE PROPOSED METHOD
Let Z = (z
1
,z
2
,..., z
n
) be an input sequence of images,
where z
1
is the first frame and z
n
is the last one. Let
G
j
i
and G
j
m
are respectively the input ARG and the
model ARG of the frame j.
The watershed from propagated markers based on
hierarchical segmentation and on the graph matching
method described in the previous Section is given as
follows:
1. j ← 1.
2. The user segments z
j
by the interactive watershed
from markers (Fig. 1 (a) and 1 (b). How better is
the segmentation quality, best will be the makers
propagated.
3. The markers (scribbles) that will be used for gen-
erate G
j+1
m
are given by the segmentation mask
from z
j
(Fig. 1 (b)) : the contours of the dilation
of the segmentation mask give the external mark-
ers, and the contours of the erosion of the same
mask provide the internal ones (Fig. 1 (c)).
4. G
j+1
i
is created. Its vertex represents the regions
given by the hierarchical segmentation of z
j+1
, ac-
cording an area parameter α (Meyer,2006) (Fig. 1
(d)).
5. G
j+1
m
is given by all vertex of G
j+1
i
which regions
are intercepted by the markers computed in Step
3 (Fig. 1 (e)).
6. The graph matching between G
j+1
i
and G
j+1
m
is
done, generating a pre-segmentation mask of z
j+1
(Fig. 1 (f)).
7. The intersection between the pre-segmentation
mask of the frame z
j+1
and the dilation of the seg-
mentation mask of z
j
, to correct eventual small
segmentation errors.
8. Markers are generated around the pre-
segmentation mask (Fig. 1 (g)). Such markers are
generated in a similar way to approach of binding
of markers (Flores and Lotufo, 2010a): the
contour of erosion of the pre-segmentation mask
and the contour of the erosion of the negation of
the pre-segmentation mask are obtained. These
contours are broken in short segments forming
the set internal and external markers for each
object.
9. If there are segmentation errors, the user interac-
tively fixes the segmentation by inserting or re-
moving markers (Fig. 1 (h)), in order to finish the
segmentation of the object of interest (Fig. 1 (i)).
10. j ← j+ 1
11. if j < n, go to Step 3.
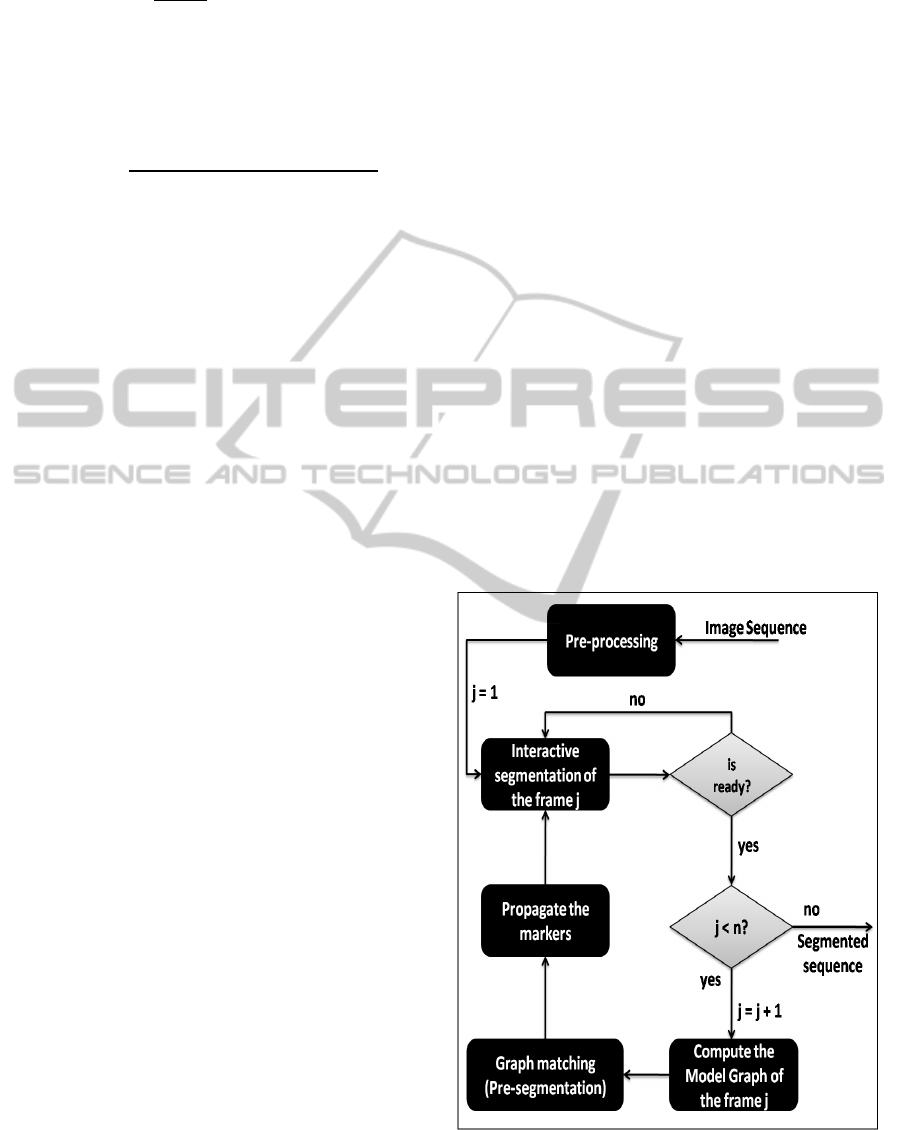
Figure 3 illustrates the proposed method with a
block diagram.
Figure 3: Block diagram.
The graph matching computation is a costly task,
since each vertex v
i
∈ V
i
is matched with all vertices
VISAPP2014-InternationalConferenceonComputerVisionTheoryandApplications
324

v
m
∈ V
m
, in order to find the best correspondence.
Considering n = |V
i
| and m = |V
m
|, the graph match-
ing computation has complexity Θ(n· m).
To overcome this problem, the graph Gi is com-
puted in an unique pre-processing step where a
matching cost matrix (MC) is also computed. This
matrix contains the matching cost between vertices
v
i
,v
j
∈ V
i
. MC is similar to an adjacency matrix (Cor-
men et al., 2011), but each element of the matrix con-
tains the correspondence cost between two vertices.
Note that graph Gm not is considered in the pre-
processing computation, since there is no way to
mount this graph in this step, because it depends of
the object segmented from the previous frame. But,
since Gm is a subgraph of Gi, the matching between
some vertices vm ∈ Vm and some vertices vi ∈ Vi is
contained in MC.
The complexity of MC computation is Θ(n
2
), but
it is still advantageous, since it improves the segmen-
tation time, then helps to preserve the property of fast
response, from the interactive segmentation methods
(Flores and Lotufo, 2010a).
4 EXPERIMENTAL RESULTS
Experiments were done in order to comprove the efi-
ciency and robustness of the proposed approach. The
experiments were assessed by the application of a
quantitative benchmark (Flores and Lotufo, 2010a)
for evaluation of assisted segmentation of objects in
image sequences, that measures: the number of user
interferences, the time spent, the segmentation error
(in relation of the ground truth sequence obtained by
the interactively manual segmentation) and the object
movement (computed only for the ground truth se-
quence, not is used to determine the efficiency and
robustness of a method, but it helps to understand the
results of the benchmark).
Two big sets of experiments were done in order
to evaluate the proposed method and to compare it
to other methods: the standard watershed from mark-
ers (Beucher and Meyer, 1992) (used to create the
ground truth sequence), two semi-automatic methods
(Noma et al., 2012; Zhi and Jie, 2004), and tree recent
variations of the watershed from propagated markers
(WFPM), the binding of markers (Flores and Lotufo,
2010a), the spatio-temporal gradient support (Flores
and Lotufo, 2010b), and the border tracking by graph
matching (Ortoncelli and Flores, 2013).
All methods compared in this experiment and
a graphical user interface was designed and imple-
mented in Python. The experiments were done on a
computer with the following configuration: Processor
Intel i5 (2.53 Ghz), with 6 GB of memory and Win-
dows 7 operating system.
4.1 Evaluated Methods
The ground truth was obtained by the use of the stan-
dard watershed from markers (SWFM). The user im-
posed interactively markers to the objects of inter-
est in each frame from the sequence, that was seg-
mented by watershed from markers method (Beucher
and Meyer, 1992).
Experiments were done with others three water-
shed from propagated markers (WFPM) variations,
for (Flores and Lotufo, 2010a) the markers are prop-
agated by the Lucas and Kanade optical flow com-
putation method (Beauchemin and Barron, 1995),
for (Flores and Lotufo, 2010b) the same propaga-
tion method is used but with spatio-temporal gradi-
ents created with two 3-D structuring elements pre-
sented in (Flores and Lotufo, 2010b), B5 and B6. For
(Ortoncelli and Flores, 2013) that is based on the hier-
archical image segmentation, it was used two extinc-
tion area parameters to create the frame graphs (25 e
50), let these graphs computeds in a pre-processing
step.
The semi-automatic methods (Noma et al., 2012;
Zhi and Jie, 2004) evaluated also are based on the hi-
eraquical image segmentation, for (Noma et al., 2012)
it was used two area parameters (25 and 50), and for
(Zhi and Jie, 2004) it was used only the parameter 50,
but for the interactive and semi-automatic versions of
the method. In both of the semi-automatic methods
evaluated the graphs are computed in a pre-processing
step.
In the experiments, for all the evaluated methods
it was used a color gradient, computed by the union of
the gradients from each band of the input color image
under the RGB color space.
4.2 Quantitative Results
Two experimentswere done to illustrate the efficiency
and robustness of the proposed method. In the first
experiment, it was segmented the man in the 150 first
frames of Foreman sequence. The second experiment
is a repetition of the first one using the Carphone se-
quence (http://trace.eas.asu.edu/yuv/). The Tables 1
and 2 show the segmentation results, the columns of
this tables represents from left to right the respectively
the following information: the segmentation method,
the mean of user interactions by frame, the mean time
spent to segment a frame (user interaction and pro-
cessing time) and finally the percentage of segmenta-
tion error.
WatershedfromPropagatedMarkersbasedonMorphologicalHierarchicalSegmentationandGraphMatching
325

Table 1: Experimental Results: Foreman Sequence.
Time (seconds)
Method Interactions User Proc. Error (%)
Manual (SWFM) 22.453 50.575 0 0
Proposed Approach (α = 25)
1.626 3.834 3.668 0.811
Proposed Approach (α = 50) 1.62 3.98 3.489 0.845
WFPM - (Flores and Lotufo, 2010a)
1.733 4.41 4.918 1.306
WFPM - (Flores and Lotufo, 2010b) B6 1.706 4.224 4.916 1.455
WFPM - (Flores and Lotufo, 2010b) B26
1.713 4.231 4.88 1.465
WFPM - (Ortoncelli and Flores, 2013) - 25 4.486 9.139 10.28 0.93
WFPM - (Ortoncelli and Flores, 2013) - 50
3.68 8.161 9.241 0.95
(Noma et al., 2012) - 25 0.053 0.118 2.077 3.572
(Noma et al., 2012) - 50
0.053 0.118 1.747 3.491
(Zhi and Jie, 2004) - semi-automatic 0.06 0.133 24.291 51.912
(Zhi and Jie, 2004) - interactive
72.053 55.167 24.291 1.276
Table 2: Experimental Results: Carphone Sequence.
Time (seconds)
Method Interactions User Proc. Error (%)
Manual (SWFM) 15.56 39.608 0 0
Proposed Approach (α = 25) 1.933 4.571 3.609 0.436
Proposed Approach (α = 50)
2 4.969 3.302 0.445
WFPM - (Flores and Lotufo, 2010a) 2.106 4.999 4.883 0.457
WFPM - (Flores and Lotufo, 2010b) B6
1.806 4.491 4.946 0.832
WFPM - (Flores and Lotufo, 2010b) B26 1.713 4.123 4.897 0.851
WFPM - (Ortoncelli and Flores, 2013) - 25 3.346 7.161 11.148 0.57
WFPM - (Ortoncelli and Flores, 2013) - 50
3.746 7.908 9.338 0.471
(Noma et al., 2012) - 25 0.046 0.11 2.86 3.107
(Noma et al., 2012) - 50
0.046 0.11 1.854 3.309
(Zhi and Jie, 2004) - semi-automatic 0.046 0.114 24.691 26.637
(Zhi and Jie, 2004) - interactive
55.553 42.204 24.691 0.889
Details about the experimental results in a frame-
by-frame way, are illustrated in the Figures 4 and 6
by graphics, this graphics represents the informations
about interaction, time and segmentation error, for
some of the methods analyzed in the experiments: (i)
the proposed methods with α = 25; (ii) the SWFP used
to create the ground truth; (iii) the WFPM variation
proposed in (Flores and Lotufo, 2010a), that gets the
best results between the interactive methods of the ex-
periment (not considering the new approach); and (iv)
(Noma et al., 2012) that gets the best results between
the semi-automatic methods of the experiment. The
motion information about the segmented object, are
illustrated in the Figures 6 and 7 by graphics.
More details about the experimental results are
available at http://www.din.uem.br/∼fcflores/work/
visapp2014.html. This website shows all the ex-
perimental results in a frame-by-frame way, and
has several graphics showing the performance vari-
ation through the image sequence for each assessed
method. Besides tables and graphs, the website also
contains videos with the segmentation results for each
experiment.
5 CONCLUSIONS
This paper introduces a new version to the watershed
from propagated markers that combines graph match-
ing to hierarchical segmentation. This improvement
combines the efficiency and robustness of the water-
shed from propagated markers with the segmentation
quality of the graph matching.
Experiments were done in order to assess the im-
pact of the graph matching method to the watershed
from propagated markers framework. The proposed
approach showed better results than others variations
of the WFPM method, except for (Flores and Lotufo,
2010b) that had better results in relation to the num-
ber of interactions and time of user interference (only
for the Foreman sequence), but the approach proposed
VISAPP2014-InternationalConferenceonComputerVisionTheoryandApplications
326
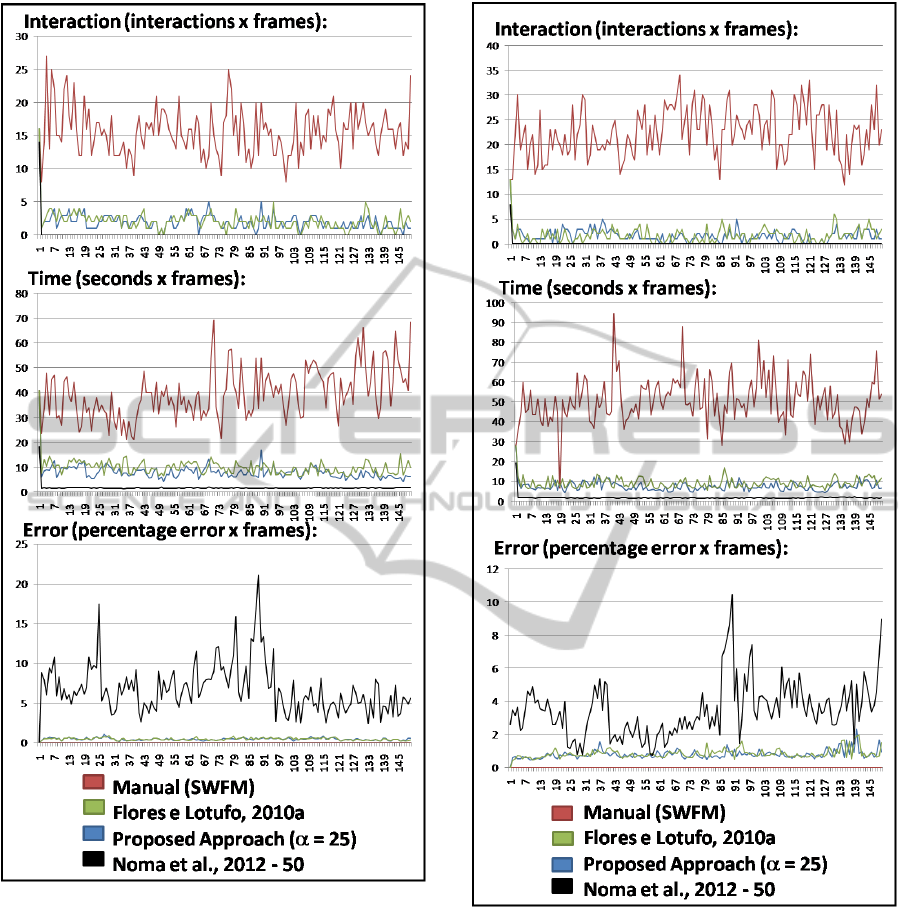
Figure 4: Carphone Sequence - frame-by-frame informa-
tions.
obtained very close results in these parameters and
provided a better segmentation results.
In relation of the semi-automatics methods (Noma
et al., 2012; Zhi and Jie, 2004), they also had better
results in relation to the number of interactions and
time of user interference, as is expected of such meth-
ods, in which the user imposes markers in only a lim-
ited set of frames. But the proposed approach, as has
already been said, had better segmentation results.
It was also concluded that the use of the new im-
provement in this paper is advantageous even consid-
ering the need for a pre-processing step, because the
obtained results are better to the ones provided by the
Figure 5: Foreman Sequence - frame-by-frame informa-
tions.
other variations of the WFPM, and in relation of the
semi-automatic methods, the segmentation error was
very lower in the proposed approach.
Future works include the exploitation of alterna-
tive graph algorithms and their implementation in a
parallel paradigm, in order to reduce the process-
ing time, and perhaps eliminate the need of the pre-
processing step.
WatershedfromPropagatedMarkersbasedonMorphologicalHierarchicalSegmentationandGraphMatching
327
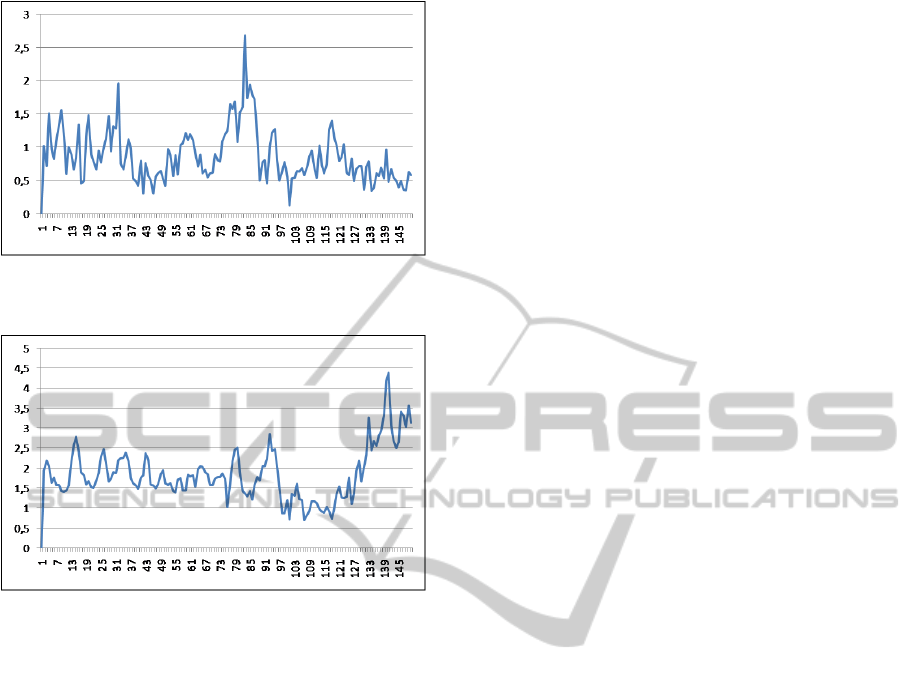
Figure 6: Carphone Sequence - frame-by-frame informa-
tions.
Figure 7: Carphone Sequence - frame-by-frame informa-
tions.
ACKNOWLEDGEMENTS
The authors would like to thank the National Coun-
cil for Scientific and Technological Development
(CNPq) for the financial support of this research.
REFERENCES
Adams, R. and Bischof, L. (1994). Seeded region growing.
IEEE Transactions on Pattern Analysis and Machine
Intelligence, 16(6):641–647.
Beauchemin, S. S. and Barron, J. L. (1995). The computa-
tion of optical flow. ACM Computing Surveys (CSUR),
27(3):433–466.
Beucher, S. and Meyer, F. (1992). Mathematical Morphol-
ogy in Image Processing.
Conte, D., Foggia, P., Sansone, C., and Vento, M. (2004).
Thirty years of graph matching in pattern recognition.
International journal of pattern recognition and arti-
ficial intelligence, 18(03):265–298.
Cormen, T. H., Leiserson, C. E., Rivest, R. L., and Stein,
C. (2011). Introduction to Algorithms. MIT Press, 3
edition.
Fan, J., Yau, D. K., Elmagarmid, A. K., and Aref,
W. G. (2001). Automatic image segmentation by
integrating color-edge extraction and seeded region
growing. IEEE Transactions on Image Processing,
10(10):1454–1466.
Flores, F. C. and Lotufo, R. A. (2010a). Watershed from
propagated markers: An interactive method to mor-
phological object segmentation in image sequences.
Image and Vision Computing, 28(11):1491–1514.
Flores, F. C. and Lotufo, R. A. (2010b). Watershed
from propagated markers improved by the combina-
tion of spatio-temporal gradient and binding of mark-
ers heuristics. In International Conference on Com-
puter Vision Theory, pages 164–172.
Meyer, F. (2006). Hierarchies of partitions and morpholog-
ical segmentation. In Scale-Space and Morphology in
Computer Vision, pages 161–182. Springer.
Ngan, K. N. (2011). Video segmentation and its applica-
tions. Springer.
Noma, A., Graciano, A. B. V., Jr, R. M. C., Consularo,
L. A., and Bloch, I. (2012). Interactive image segmen-
tation by matching attributed relational graphs. Pat-
tern Recognition, 45(3):1159–1179.
Ortoncelli, A. R. and Flores, F. C. (2013). Watershed
from propagated markers based on border tracking
by graph matching. In Workshop de Vis˜ao Computa-
cional (WVC), pages 156–163, Rio de Janeiro, Brazil.
Tsai, W. and Fu, K. (1979). Error-correcting isomorphisms
of attributed relational graphs for pattern analysis.
IEEE Transactions on Systems, Man and Cybernetics,
9(12):757–768.
Vachier, C. (1995). Extinction value: a new measurement
of persistence. In Workshop on Nonlinear Signal and
Image Processing, number 1, pages 254–257.
Zhi, L. and Jie, Y. (2004). Interactive video object segmen-
tation: fast seeded region merging approach. Elec-
tronics Letters, 40(5):302–304.
VISAPP2014-InternationalConferenceonComputerVisionTheoryandApplications
328
