
Analysis of Large Long-term Remote Sensing Image
Sequence for Agricultural Yield Forecasting
Alexander Murynin
1,2
, Konstantin Gorokhovskiy
1
, Valery Bondur
1
and Vladimir Ignatiev
1,3
1
"AEROCOSMOS", Institute for Scientific Research of Aerospace Monitoring,
Moscow, Russian Federation
2
Institution of Russian Academy of Sciences Dorodnicyn Computing Centre of RAS,
Moscow, Russian Federation
3
Moscow Institute of Physics and Technology State University,
Dolgoprudny, Russian Federation
Abstract. Availability of detailed multi-year remote sensing image sequences
allows finding a relation between the measured features of vegetation condition
history and agricultural yields. The large image sequence over 10 years is used
to build and compare 4 yield prediction models. The models are developed
trough gradual addition of complexity. The initial model is based on linear re-
gression using vegetation indices. The final model is non-linear and takes into
consideration long-term technological advances in agricultural productivity.
The accuracy of models has been estimated using cross-validation method. Fur-
ther ways for model accuracy improvement have been proposed.
1 Introduction
Advances in capabilities of modern computers allowed the extraction of new infor-
mation from the vast sequences of remote sensing images collected over many years.
Nowadays yield forecasting based on multi-year observations of land surface from
space is a subject of intensive research based on data mining techniques.
The principal idea of the approach is the following. Having two years with similar
observations of informative features of vegetation condition one should expect similar
yields. However, complexity of vegetation models and incompleteness of observations
makes it difficult to verify any yield forecasting method based on a small number of
regions of observations or limited time frame. The level of noise makes it difficult to
extract the useful signal. Only by analyzing large dataset which contains several re-
gions and spans over many years it is possible to estimate yield forecast model accura-
cy and reliably compare it with any alternatives.
The existing methods should be reviewed before detailed description of proposed
approaches, models and methods of verification.
Crop condition monitoring and assessment of agricultural production using weather
data is an established method widely used for almost all types of cultivated cultures.
Murynin A., Gorokhovskiy K., Bondur V. and Ignatiev V..
Analysis of Large Long-term Remote Sensing Image Sequence for Agricultural Yield Forecasting.
DOI: 10.5220/0004393400480055
In Proceedings of the 4th International Workshop on Image Mining. Theory and Applications (IMTA-4-2013), pages 48-55
ISBN: 978-989-8565-50-1
Copyright
c
2013 SCITEPRESS (Science and Technology Publications, Lda.)

Nevertheless, insufficient spatial distribution of weather measurements negatively
affects the accuracy of prediction.
There is, however, a source of data that can provide reliable and accurate spatial-
temporal measurements of vegetation condition. This data can be obtained from re-
mote sensing using satellite imaging. Various sources of remote sensing information
can be used for these purposes in crop yields forecasting as complimentary to weather
measurements as well as a sole source of data [3], [4], [5], [6].
There were attempts to develop a computational algorithm which uses different
channels from the multispectral radiometers [4]. As an intermediate step the multi-
spectral data have been transformed into vegetation indices. These indices were used
for droughts detection as well as crop yields forecasting. The technique has shown
promising results [7], [8], [9].
2 General Concepts used in Proposed Yield Forecasting Models
Relationship of vegetation indices measured by multispectral images with productivity
of plants is well studied [10].
The proposed family of models can be described as follows. Crop yield of a partic-
ular culture at a given territory should be fairly reliably predicted by function whose
parameters are averaged (by this region) values of vegetation indices during growth
and ripening period of the crop. The better the historical track record of the indices is
known, the better the forecast of crop yields can be made.
In this work several models for forecasting crop yields are proposed which are
based on the history of vegetation indices, accumulated over a fixed period of the year
from the start of the growing season.
The model for crop yields forecasting in general looks like:
() ( ) ( )()
,2,1, ++= tvtvtvfy
krkr
,
(1)
where
kr
y - predicted value of the yield at the end of the season for territorial region (
r
)
and crop type (
k ),
kr
f - unknown function of the yield forecast for the region and crop type,
()
tv - vegetation index value for the area of crops,
t
- time of the start of the measurements in the current growing season, with t+1,
t+2, ... corresponds to a discrete points in time when the measurements carried out
during this season.
Regional administrative divisions are selected for units of the area. This choice is
due to the structure of information on the crop yields for previous years for different
some crops types, which are officially provided by State Statistics Service of the Rus-
sian Federation and is publicly available [11]. Availability of this information makes it
possible to adjust the free parameters of a model to a specific region and crop type
through learning process (or optimization).
Figure 1 shows the image with vegetation condition index (NDVI) for 3 regions of
the Russian Federation: Ivanovo, Vladimir and Nizhny Novgorod regions. Image
49
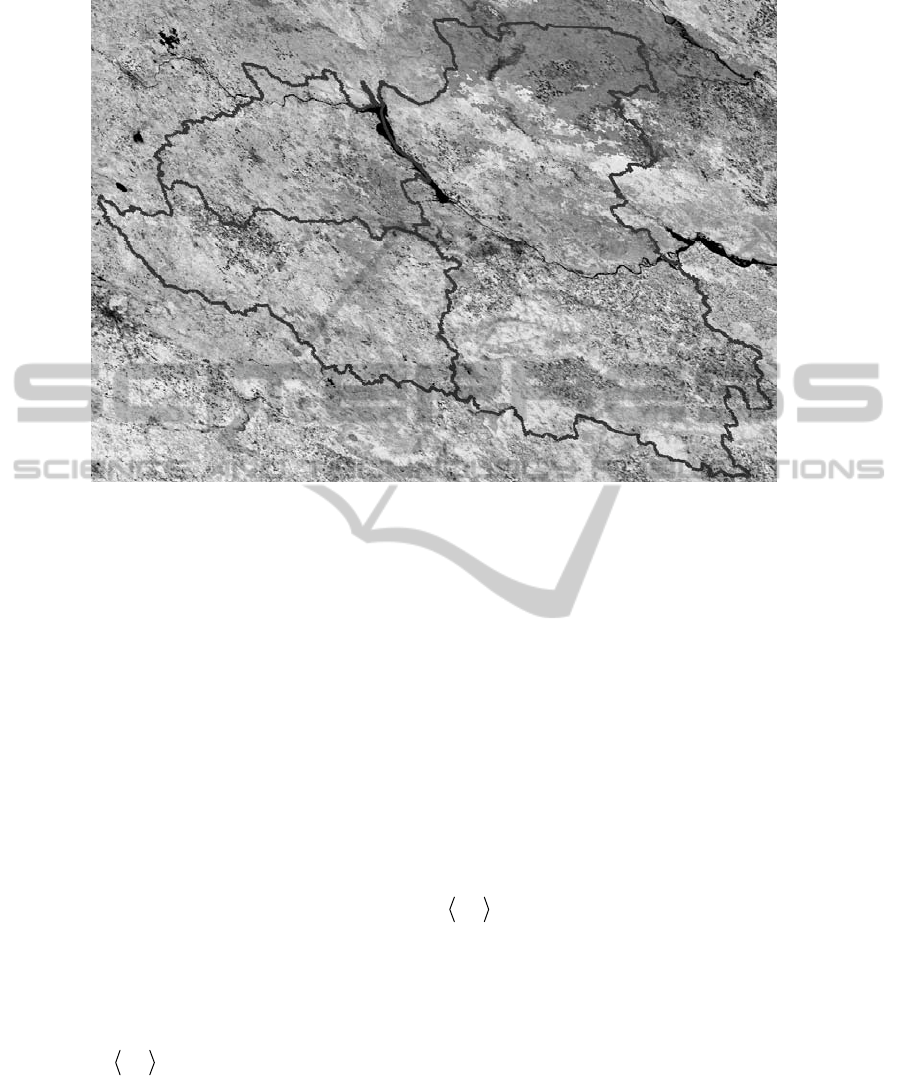
Fig. 1. Vegetation index map for Ivanovo, Vladimir and Nizhny Novgorod regions for 9 May
2007.
represents values of the index for 9 May 2007.
From available statistical data one can make a conclusion that the variability of the
yield is small relative to its magnitude. Hence, after expansion of a yield model func-
tion into the Taylor polynomial the main contribution to the accuracy of the forecast
will be made by the linear terms of the polynomial. As a simplification the nonlinear
terms of higher order can be ignored. In this case, the model becomes linear, i.e.
rk
f
,
is a linear combination of
()
tv .
2.1 Global Linear Model
Let us assume that the soil and climate characteristics have a small variation for the
studied regions. The model can be simplified to look the same for all regions:
() ()
=
⋅=
T
t
r
krk
tvty
1
α
(2)
where
k - index indicating the crop type,
r
- index pointing to an area (region) of the Russian Federation,
rk
y - crop yield estimate for a given area (
r
), and culture type ( k ),
()
r
tv - average value of the vegetation condition index for a given region of the
Russian Federation,
50

()
t
k
α
- adjustable parameters of the model for individual time intervals of the vege-
tation period (or calendar year).
The model parameters are set on the basis of historical data relating to yields and
the corresponding historical values of the vegetation index. Tuning of the model pa-
rameters is done by using linear regression optimization. Analysis and comparison of
the model will be described in the final section of this article.
2.2 Linear Model for Isolated Regions
In case if the assumption of minimal differences between the considered regions is
incorrect, it is necessary to return to a more complete model described in (4), as fol-
lows:
() ()
=
⋅=
T
t
r
rkrk
tvty
1
α
(3)
where
()
t
rk
α
- model parameters that are now changing not for the time of year (
t
),
culture to culture (
k ), but also from region to region (
r
).
The difference of parameter values between two areas can be explained not only
the changes in the composition of the soil but also the average climatic conditions of
the given regions. The other components in this formula have been described previ-
ously. The elegance of this model lies precisely in the fact that the chosen formula
allows precise adjustments of model parameters to the features of a particular region.
It should be noted among the shortcomings of this model, that setting the parame-
ters requires much more raw data available for training or otherwise an over-fitting of
the model could occur.
2.3 Model with Factor Adjustment for Regions
In the case when the amount of statistical data available for the adjustment of the indi-
vidual models for each of the region is not sufficient it is required to reduce the num-
ber of adjustable parameters. Thus, in particular, one can assume that the main contri-
butions to the difference in crop yields are made by the following factors:
- fertility of soils in a region,
- climatic differences between regions,
- amount of solar radiation, depending on the latitude of a region.
At the same time to build the model, we deliberately ignore the temporary displace-
ment of growing season for various regions for the western part of the Russian Federa-
tion taken for this study. Using the above assumptions, the following formula can be
suggested:
() ()
=
⋅⋅=
T
t
r
krkrk
tvtCy
1
α
(4)
where
k - index indicating the crop type,
51

r
- index pointing to a region of the Russian Federation,
rk
y - estimate the yield for a given region (
r
), and culture type ( k ),
rk
C - coefficient of performance of the region for specific crop type,
()
r
tv - average value of the vegetation condition index for a given region of the
Russian Federation,
()
t
k
α
- adjustable parameters of the model for individual time intervals of the vege-
tation period (or calendar year).
2.4 Model with Factor Adjustment for Regions and Temporal Trend
In the past few decades, there has been a stable growth of crop yields per unit of culti-
vated area [12] all over the globe. This is due to several factors. First of all, it is worth
noting the progress in genetic engineering for crops improvement. Improved seeds are
more resistant to drought, temperature changes and parasites. Another factor is the
more efficient use of fertilizers. Progress in the field of agricultural technology has
allowed to harvest with fewer losses. Improved methods of chemical treatment result-
ed in better control of the pest populations.
Such improvements are referred as trend in crop yield improvements. It is required
to take into account the trend in the crop yields because it is likely that similar trend
will continue in the next few years.
Making the assumption that the yield changes are linearly dependent on time to the
present historic interval one can improve the formula from the previous model for
predicting the long-term increase in yields. Therefore the average yield for the current
year can be expressed from the yield previous year by the following equation:
()
startcurrent
start
startcurrent
YY
y
yy
−⋅=
−
β
(5)
where
current
y - average crop yield for the current year
current
Y ,
start
y - average crop yield in year of the beginning of observations
start
Y ,
β
- relative annual increase in productivity due to long-term trend.
Let us express
current
y in terms of the other variables:
()
[]
startstartcurrentcurrent
yYYy ⋅−⋅+=
β
1
(6)
We get the following formula for the refined model of crop yields:
()
[]
() ()
=
⋅⋅⋅−⋅+=
T
t
r
krkstartrk
tvtCYYy
1
1
αβ
(7)
where
k - index indicating the crop type,
r
- index pointing to a region of the Russian Federation,
rk
y - estimate the yield for a given region (
r
), and culture type ( k ),
52

Y
- current year for which the crop yields are evaluation,
start
Y - the year of the beginning of observations,
β
- relative annual increase in productivity due to long-term trend,
rk
C - coefficient of performance of the region for specific crop type,
()
r
tv - average value of the vegetation condition index for a given region of the
Russian Federation,
()
t
k
α
- adjustable parameters of the model for individual time intervals of the vege-
tation period (or calendar year).
3 Results
Remote sensing data for 14 regions of Russian Federation over span of 10 years (from
2000 to 2009) were used for training and validation of the models.
The accuracy of the models was assessed using K-fold cross-validation method.
The whole set of input data has been partitioned several times into two subsets: the
training subset and the testing subset. Each time the testing subset was different. In
total 10 unique testing subsets were used so that the data for each year available were
used as a testing subset at least once.
The resultant accuracies of prediction for three groups of cultures and four forecast-
ing models are shown in Table 1. Forecasting errors of crop yields is evaluated like a
standard deviation of forecasting values from numbers of official statistics.
Table 1. Standard deviation of the forecasts crop yields for different models and cultures using
cross-validation method for period 2000-2009.
Grain
Vegetables Potato
Global linear 38.7%
27.6%
20.4%
Local linear 175.8%
68.3%
127.4%
Factor adjustment 34.8%
16.1%
19.9%
Factor adjustment with trend
19.1%
10.5%
18.7%
As can be seen from Table 1 the worst result is generated by the local linear model.
This is due to insufficient information available for model training. As a result the
model is over-fitted for training data and is unable to predict correctly the testing set.
The best result is generated by the model with factor adjustment and long-term
trend. It shows considerable better results for all tree cultures used in the study.
The visual representation of the forecasting errors is shown in Figure 2.
It is worth noting that the proposed models do not require crop masks which are usual-
ly used in similar studies [13]. Our method extracts the required information from the
overall condition of vegetation in the given area rather than condition of a given crop.
The lack of crop mask may reduce the accuracy of the forecasts. Nevertheless the
comparison of our results with the results from other studies [13] shows that our mod-
els demonstrate competitive accuracy even without the crop mask or other information
about cultivated areas such as soil types and weather conditions.
53
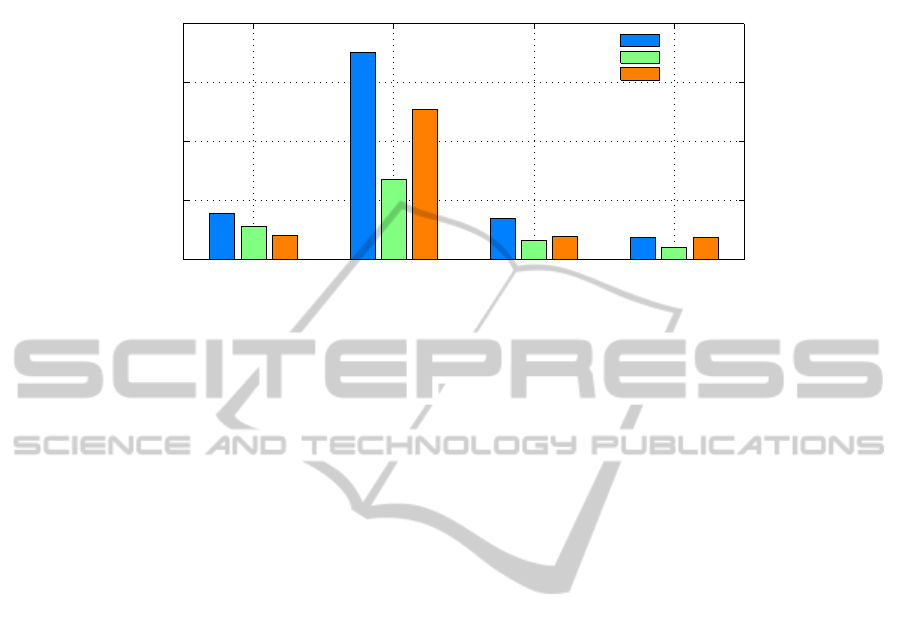
Global linear Local linear Factor adj. Factor adj. w/ trend
0
50
100
150
200
Error in %
(standard deviation)
Errors in forecasts for different cultures and models
Grain
Vegetables
Potato
Fig. 2. Standard deviation for all the above cultures and models. As can be seen the Factor
adjustment model with trend shows the best results. The Local linear model shows the worst
results due to the problem of over-fitting.
4 Conclusions
This study introduces an approach to develop efficient models for crop yield forecast-
ing via extracting information from the large set of satellite images. It is shown that
several proposed forecasting models can predict the yields of wheat, potatoes and
vegetables with different levels of forecasting errors.
The main advantage of the suggested approach is the possibility to use free to ac-
cess information, including satellite multispectral images and official statistical data.
Actually, finding out the appropriate form of forecasting function on the base of re-
mote sensing images and data of official statistics makes it possible to obtain fairly
accurate results of yield forecasting.
Other advantage is that the algorithm proposed does not require any specific infor-
mation about the cultivated areas. It minimizes the amount of the input data for practi-
cal implementation of the models. Specifically, this approach does not require crop
masks. In other words the method uses overall condition of the vegetation in the given
area rather than the condition of specific culture.
The analysis of the accuracy of forecasting crop yields using cross-validation meth-
od demonstrates the advantages and disadvantages of the proposed models. Model
with factor adjustment for regions and temporal trend allows obtaining forecasting
errors less than 15%, that is good accuracy for such kind of forecasts.
We plan to continue this study with enhanced forecasting models in order to im-
prove the accuracy and generality of the crop yield prediction as well as extend the
forecast to the more regions of the Russian Federation.
54

References
1. McQuigg, J., D.: Economic Impacts of Weather Variability. Atmospheric Science Dept
University of Missouri, Columbia (1975)
2. Hodges, T., Botner, D., Sakamoto, C., Hays Haug, J.: Using the CERES-Maize model to
estimate production for the U.S. Cornbelt. Agricultural and Forest Meteorology, Vol. 40,
Iss. 4 (1987) 293-303
3. Tucker, C., J., Sellers, P., J.: Satellite remote sensing of primary production. International
Journal of Remote Sensing, Vol. 7, Iss. 11 (1986)
4. Kogan, F., N.: Global Drought Watch from Space. Bulletin of the American Meteorological
Society, N. 78 (1997) 621-636
5. Benedetti, R., Rossini, P.: On the use of NDVI profiles as a tool for agricultural statistics:
The case study of wheat yield estimate and forecast in Emilia Romagna. Remote Sensing of
Environment, 45 (1993) 311–326.
6. Rasmussen, M., S.: Operational yield forecasting using AVHRR NDVI data: prediction of
environmental and inter-annual variability. International Journal of Remote Sensing, 18
(1997) 1059–1077.
7. Unganai, L., S., Kogan, F., N.: Drought monitoring and corn yield estimation in Southern
Africa from AVHRR data. Remote Sensing of Environment, 63 (1998) 219–232.
8. Aigner, E., Coppa, I., Wieneke, F.: Crop Yield Estimation Using NOAA − AVHRR Data
and Meteorological Data in the Eastern Wimmera (South Eastern Australia). International
Archives of Photogrammetry and Remote Sensing, Vol. 33, Part B7, Amsterdam (2000).
9. Ferencz, Cs., Bogna, P., Lichtenberger, R., J., Hamar, D., Tarcsai, Gy., Timar, G., Molnar,
G., Pasztor, Sz., Steinbach, P., Szekely, B., Ferencz, O., E., Ferencz-Arkos, I.: Crop yield
estimation by satellite remote sensing. International Journal of Remote Sensing, Vol. 25,
No. 20, (2004) 4113–4149.
10. Phillips, L., B., Hansen, A., J., Flather, C., H.: Evaluating the species energy relationship
with the newest measures of ecosystem energy: NDVI versus MODIS primary production.
Remote Sensing of Environment, Vol. 112, Iss. 9 (2008) 3538-3549
11. Regions of Russia. Social and Economic Indicators. 2011. http://www.statbook.ru/
eng/catalog.html?page=info&id=306
12. Fischer, R., A., Byerlee, D., Edmeades, G., O.: Can Technology Deliver on the Yield Chal-
lenge to 2050? Expert Meeting on How to Feed the World, Food and Agriculture Organiza-
tion of the United Nations, Rome (2009)
13. Islam, A.S., Bala, S.K.: Estimation of yield of wheat in greater Dinajpur region using
Modis data. 3
rd
International Conference on Water & Flood Management (ICWFM-2011),
(2011)
55
