
Optical Fiber Probe as a Source of Errors and Uncertainty in
Measurements for Optical Noninvasive Diagnostic Devices and
Techniques
Dmitry Rogatkin and Oxana Smirnova
Moscow Regional Research and Clinical Institute “MONIKI” named after M.F.Vladimirskiy,
61/2 Shepkina str., Moscow, Russian Federation
Keywords: Optics, Laser, Diagnostics, Results, Spectroscopy, Noninvasive, Medicine, Fiber, Measurements, Error,
Uncertainty, Dispersion, Metrology.
Abstract: Over the last 10-15 years a large amount of methods and devices of noninvasive medical spectrophotometry
including such techniques as in vivo Laser Fluorescent Diagnostics, Tissues Reflectance Oximetry, Laser
Doppler Flowmetry, etc. has been developed and involved in a real clinical practice. In that number several
problems of accuracy and reproducibility of clinical diagnostic results have been under discussion as well.
But systematic metrological research in this field is still unknown. What dispersions and errors in diagnostic
data can be estimated if measurements will be executed on the same object several times, by several doctors
with different qualifications or using several devices from both the same and a different manufacturer? In
this paper some results of the complex study of errors and uncertainties in diagnostic data caused by using
an optical multi-fibers probe are presented. Dispersion and errors up to a level of +/-36,3% for the average
registered values were discovered. It is shown that the interactive component of errors caused by interaction
of the probe and a surveyed object gives the main contribution to the total uncertainty in diagnostic data.
1 INTRODUCTION
In recent 10-15 years a general medical practice has
been successfully enriched with different new
methods of noninvasive optical diagnostics such as a
Laser-Doppler Flowmetry (LDF), Laser Fluorescent
Spectroscopy (LFS), Tissues Reflectance Oximetry
(TRO), etc., which all in totality are often referred to
as Medical Noninvasive Spectrophotometry (MNS)
(Rogatkin and Lapaeva, 2003). All these methods
using optical spectral measurements allow a doctor
to evaluate in vivo a biochemical compositions and a
clinical functional state of soft tissues, especially to
study the finenesses of metabolism and blood
microcirculation processes in skin or mucosa
(Tchernyi et al., 2006); (Kutai-Asis et al., 2008). As
on the basis of these measurements attempts of
estimation of quantitative differences in results for
different groups of examinees are undertaken today,
all these devices should have a reliable metrological
providing (Rogatkin et al., 2010).
Several problems of accuracy and reproducibility
of clinical diagnostic results in NMS, especially in
TRO and LDF, already have been under discussion
(Nishidate et al., 2007); (Jenny et al., 2011);
(Pochivalik et al., 2011). But systematic
metrological research in this field is still unknown.
What dispersions and errors in the diagnostic data
can be estimated if measurements will be carried out
on the same object several times, by several doctors
with different qualifications or using several devices
from both the same and a different manufacturer?
Which part of this or that device or of the method
makes the main contribution to summary errors of
measurements and to uncertainty of its final outputs?
For example, the majority of modern in vivo
spectrophotometric measurements both in medicine
and biology are carried out today with use of an
optical fiber probe. Figure 1 shows the examples.
But general technical and metrological requirements
to a multi-fiber diagnostic cord for the purpose of
precise and reproducible clinical (biological)
measurements are still unknown. Even more
complex problem can arise, if the optical fiber probe
is broken and its replacement is required. Will
measurements after the replacement be equivalent to
233
Rogatkin D. and Smirnova O..
Optical Fiber Probe as a Source of Errors and Uncertainty in Measurements for Optical Noninvasive Diagnostic Devices and Techniques.
DOI: 10.5220/0004200002330238
In Proceedings of the International Conference on Biomedical Electronics and Devices (BIODEVICES-2013), pages 233-238
ISBN: 978-989-8565-34-1
Copyright
c
2013 SCITEPRESS (Science and Technology Publications, Lda.)

previous ones or not? Up to now all these
metrological problems were little discussed in
special literature yet.
Figure 1: Diagnostic measurements with the use of a fiber
optical probe on a patient (left) and on an animal (right).
One of the first papers on this problem was the
paper in Measurement Techniques (Rogatkin et al.,
1998). It has been shown that for LFS a total random
error of in vivo measurements with the use of a fiber
optical probe could reach a quite high level – around
40%. But all real reasons for that were not estimated
by the authors at that time. This paper describes
some of our results of the systematic study of
sources of errors in NMS when using an optical fiber
probe for different NMS methods and devices.
2 MATERIALS AND METHODS
We used experimental measurements on tissue-like
non-living and self made phantoms as well as real
measurements in clinics on 10 volunteers (patients).
All volunteers provided informed consent prior to
the measurements, in accordance with the guidelines
of the Institutional Ethics Board. Three main NMS
diagnostic techniques – LDF, LFS and TRO – were
under our investigation. Used diagnostic equipment -
a commercial laser based multifunctional
noninvasive medical diagnostic system “LAKK-M”
(see figure 2), which combines all three mentioned
above diagnostic techniques in a single united
hardware (Rogatkin et al., 2009).
Figure 2: Multifunctional noninvasive diagnostic system
“LAKK-M” with a multi-fibers optical probe.
Combined multi-fibers optical cord is used in it
as an optical fiber probe to deliver light to the tested
tissue and back to the diagnostic system, that makes
it possible during one diagnostic procedure to collect
all necessary diagnostic data from the same
anatomic “point” of the examined tissue. Figure 3
represents the face-cut layout of the probe.
LDF Detectors
IR laser
UV laser
Red laser
Green laser
2.3
2.5 mm
0.6 m
m
Spectrometer
1.0 m
m
Figure 3: Layout of the multi-fibers optical probe.
Because of the absence today in the world of any
international or national certified standards, gauges,
reference materials or measurement instruments for
NMS, indeed, any classic metrological research in
the modern NMS is quite difficult. Therefore, in all
our experiments we used a well-known statistical
methodology of multiple-repeated measurements. It
assumes carrying out s identical (according to the
experimenter’s point of view) series of tests
(measurements) on the same object - on an
imitational phantom or on a volunteer. In each series
of measurements an experimental arithmetic mean
value M
s
of each registered diagnostic parameter as
well as its experimental standard deviations
were
calculated. The relative deviation
(factor of
variation) in percentage of each parameter in the
series was determined at next step of calculations:
%100)/(
s
M
(1)
Finally, the results of all s series of experiments
were compared among themselves, and distinctions
in M
s
and in
were analyzed in terms of what
methodical or instrumental (both random and
systematic) reasons cause them.
For the purpose of having a reference material
(tissue-like phantoms), a novel design of a set of
solid imitational phantoms (measures) with tissue-
like optical properties was made (figure 4). The
measures are photostable and are made from
standard materials with certified optical properties,
so they are easily reproducible (see figure 5).
BIODEVICES2013-InternationalConferenceonBiomedicalElectronicsandDevices
234
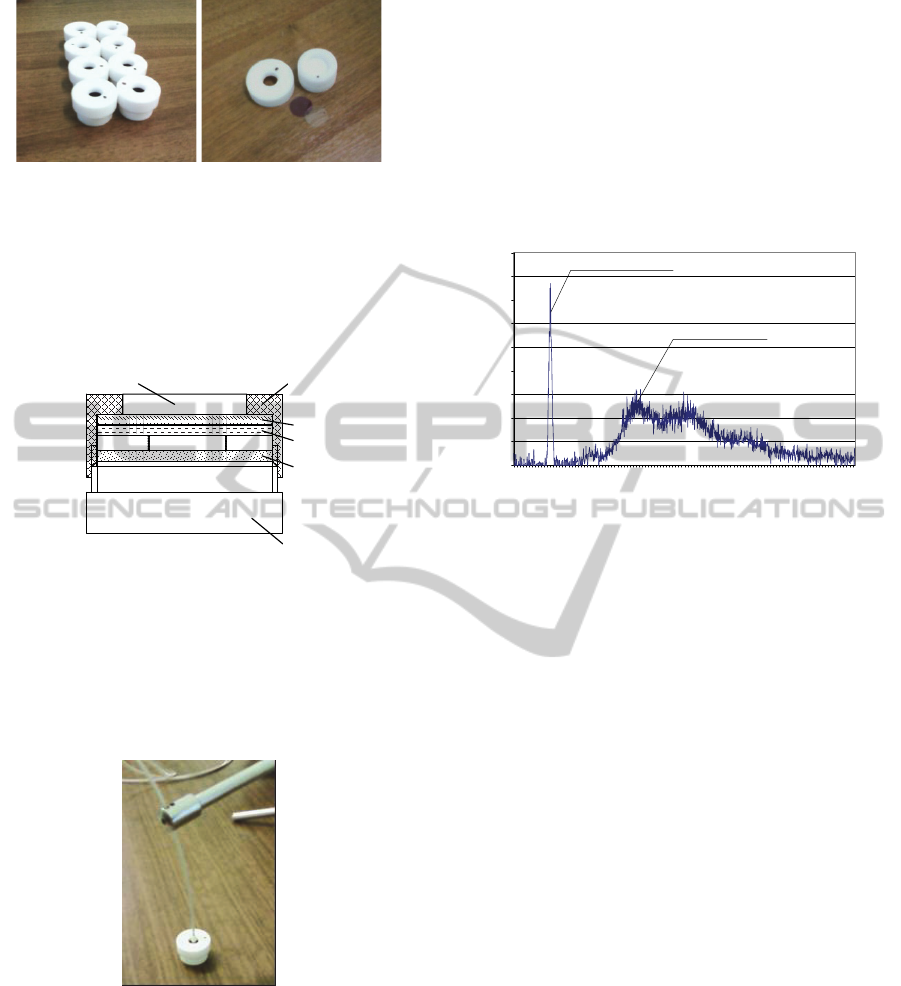
Figure 4: A set of self-made measures (left). Constructive
specialties of the measure (right).
They consist of a light scattering solid
foundation 1 and a number of spectral absorbing,
scattering and fluorescent thin polymer films - layers
2. The frontal lid 3 with a window 4 for an optical
fiber probe closes and rigidly holds all design.
1
2.n
2.2
2.1
3
4
Figure 5: Some constructive specialties of the measures.
1- foundation, 2.1…2.n thin polymer films, 3 – lid, 4 –
window for an optical fiber probe.
To avoid trembling of a fiber optical probe
during measurements on the measures the optical
cord was fixed in a stand (figure 6). Thus, all our
measurements on phantoms were steady state.
Figure 6: Optical fiber probe is fixed in a stand.
Today for a number of NMS diagnostic methods
there are already well-known medical or biological
diagnostic parameters which are the output of the
measurements and are expressed usually in absolute
or in relative units. For example, in LDF technique a
broad used diagnostic parameter is a blood flow (or
an index of blood microcirculation - I
m
) expressed in
special perfusional units. TRO technique uses a
tissue’s saturation of haemoglobin S
t
O
2
and total
haemoglobin content (total blood volume – V
b
) as
the final medical output. We used all these
parameters as final registered parameters for our
statistical analysis as well.
Some other NMS diagnostic techniques don’t
have the standard output diagnostic parameters yet.
LFS is one of the examples of that. Initially
registered spectrum of autofluorescence of tissues
with the use of “LAKK-M” system is presented in
figure 7.
0
20
40
60
80
100
120
140
160
180
500
511
522
533
544
555
566
577
588
599
610
621
632
643
654
665
676
687
698
709
720
731
742
753
764
775
786
797
Wavelength, nm
Intensity, arb. un.
Backscattering line
Fluorescence line
Figure 7: A typical autofluorescence spectrum of oral
mucosa (excitation line 532 nm). Backscattered line 532
nm is reduced by
1000 times (instrumental coefficient).
There are two main regions in the spectrum – a
region of excitation laser line (backscattered line)
and the region of fluorescence, slightly shifted to the
red waveband. To analyse that we used a previously
approved approach of calculation of a modified
fluorescent contrast coefficient K
f
(Rogatkin et al
1998):
)/()(1
bsfbsff
IIIIK
(2)
where K
f
is the modified fluorescence contrast
coefficient (0<K
f
<2), I
f
– registered light flux
intensity in the maximum of fluorescence spectrum
lines, I
bs
- intensity of the registered backscattered
laser radiation,
- instrumental reduction coefficient
(
1000 to reduce I
bs
to comparable level with the I
f
magnitude).
3 RESULTS AND DISCUSSION
3.1 Results on the Problem of a Fiber
Positioning Uncertainty
On the example of LFS technique first of all we
have studied the problem of diagnostic errors due to
variations of the positioning of a probe on a tested
tissue surface. Like it was done in the basic paper
OpticalFiberProbeasaSourceofErrorsandUncertaintyinMeasurementsforOpticalNoninvasiveDiagnosticDevices
andTechniques
235

(Rogatkin et al., 1998) we studied the deviation
of
each registered and calculated parameter on
volunteers in series of 10 measurements for each
volunteer. But unlike sited paper in our study we
have done that for the inner medical procedures with
the use of endoscopic equipment. The endoscopy
technique is one of the most difficult techniques to
carry out in meaning of operating by the optical fiber
probe. So, we expected to obtain a higher level of
variations, in spite of the researcher had a high-level
qualification both in NMS and endoscopic areas.
In this part of our research the excitation of the
fluorescence was in the line of 532 nm, registration -
in the region of lipopigments fluorescence (around
560 nm). From the medical point of view the
lipopigments as well as porphyrins fluorescence in
this region accompanies any destructive-
inflammatory processes in tissues, so it is very
important in clinics to assessment these fluorescence
in vivo as accurately as possible. Results for 5 our
volunteers are presented in Table 1.
Table 1: Results of endoscopic measurements.
Object
Statistic
parameter
Registered signals,
arb. un.
Medical
K
f
I
bs
/
I
f
Patient 1, gastritis,
gastroscopy
M
10
655,0 250,0 0,545
64,33 66,67 0,067
(%)
9,82 26,67 12,23
Patient 2, gastritis,
gastroscopy
M
10
420,0 190,0 0,627
63,25 31,62 0,121
(%)
15,06 16,64 19,36
Patient 3, inflammation,
colonoscopy
M
10
522,0 202,0 0,567
99,98 17,51 0,076
(%)
4,75 11,75 7,61
Patient 4 ulcer colitis
colonoscopy
M
10
743,0 206,0 0,436
69,77 13,50 0,035
(%)
9,39 6,55 8,11
Patient 5
norm colonoscopy
M
10
448,0 245,0 0,706
70,05 62,41 0,150
(%)
15,64 25,47 21,17
As one can see, variations in diagnostic data on a
level up to +20% around the mean value can be
registered at endoscopic examination. One of the
reasons for their emergence is the uncertainty of
positioning of the optical fiber probe on the tissue.
Figure 8 shows this phenomenon on the left.
Another likely reason – penetration of external light
from endoscopic source into the inspection area (into
the so called diagnostic volume (DV) (Rogatkin et al
2010)). For exception of both reasons it was offered
to use a steady tip on the probe as a support. Figure
8 shows the solution on the right.
Tissue
1
1
2
Figure 8: Uncertainties in the positioning of the used fiber
probe (left) and the steady probe’s tip (right). 1- External
light; 2 – back reflected light.
To prove the efficacy of the solution and to avoid
the factor of living tissues, a number of additional
experiments were executed with the help of our
lifeless measures. One part of the measurements was
carried out without a tip; another part was carried
out with a mirror tip and the third part - with the
black tip absorbing light. Mirror and black options
of the tip were necessary to assess the influence of
additional illumination of the DV on results of
measurements. Light getting into the tissue from the
fiber optical probe due to backscattering leaves the
tissue from the top boundary where the tip is placed.
The leaving light can be absorbed by the tip (black
option) or reflected back into the DV (mirror
option). So, differences in M
s
and
can be evaluated
in all these cases to establish the influence. Table 2
represents the results.
At the absence of the tip an uncertainty of probe
positioning on the surface of measures leads to
enhanced
for K
f
up to +4,5% and to systematic
increasing in average K
f
due to the penetration of
external light into the measure’s DV. But absolute
magnitudes of and
are much less here than were
observed in clinical study, that is a consequence of a
steady state measurements on a phantom (see figure
6) as well as a lifeless character of it. Nevertheless,
for a steady state phantom the magnitude of
in
4,5% is quite big. The case with the lowest
=0,9%
is a case with a black tip. Thus, both positioning and
external light penetration (apart from other reasons,
biological reasons, for example) are the reasons for
high-level variations in diagnostic data in LFS when
a fiber optical probe is used.
3.2 Results on Replacing of the Probe
The considerable growth of the standard deviation
for all parameters was observed at the comparative
analysis of data received by the same diagnostic
system when different copies of optical fiber probes
from the same party of the probes were used.
BIODEVICES2013-InternationalConferenceonBiomedicalElectronicsandDevices
236

Table 2: Experiments with a steady tip for the probe. Excitation line is 532 nm, registration line is 560 nm.
Steady probe’s tip
I
bs
/ , arb. un. I
f
, arb. un. K
f
*
, rel. un.
M
25
M
25
M
25
is absent 456,8 23,1 5,1 321,1 24,3 7,6 0,83 0,038 4,5
with a mirror
bottom surface
465,7 10,3 2,2 313,8 7,2 2,3 0,81 0,009 1,1
with a black
bottom surface
448,9 11,1 2,5 282,5 7,0 2,5 0,77 0,007 0,9
*
Accepted nominal value for the phantom is K
f
=0,78.
Table 3 presents such results for diagnostic TRO
technique when using three similar copies of the
probe. The measurements were made on the non-
fluorescent measure No. 8. The reason for obviously
dropping out values for the probe No. 011 was a
small difference in the distance between receiving
and illuminating fibers in the cord (see figure 3) in
comparison with two other copies of the probe. This
distance determines the effective DV in the surveyed
object, therefore even a small variation of the
distance leads to a slightly different DV and, as a
consequence, to a little bit another registered
physical as well as calculated medical parameters.
Table 3: Experiment with three copies of the probe.
Optical fiber probe
Statistic
parameters
Calculated parameters, % *
S
t
O
2
V
b
Probe № 001 M
50
57,5 10,7
Probe № 011 M
50
81,5 11,7
Probe № 021 M
50
57,2 9,9
On average
M 65,4 10,8
13,9 0,9
21,3 8,38
*
Accepted nominal values for the measure No. 8 were S
t
O
2
=57,6
% , V
b
=10,5 %.
Nevertheless, it is necessary to note, that the
direct comparison of the diagnostic data when using
different optical fiber probes with different distances
between fibers in the cord or with different optical
apertures of the fibers methodically isn't always
correct. For each DV the constructive parameters of
each fiber probe should be standardised and certified
to have comparable results.
3.3 Results on the Problem of Different
Qualification of Researcher
Also, in our study we investigated errors caused by
absence of a sufficient qualification of a doctor to
manage the optical fiber probe. With each examinee
3 series of mutual-repeated tests (on 5 measurements
in each series) were carried out. With first volunteer
a young postgraduate student worked to whom the
necessary technique - most precisely positioning of
the probe in the same place at each measurement and
without visible pressure weren't told. With second
volunteer another, more skilled postgraduate student
worked and after his attention was specially turned
on the need of careful control of pressure and of
installation place for the probe on the body of the
patient. The third volunteer was under control of the
most skilled researcher. Obvious reduction of and
from test to test was registered (see Table 4). I.e. a
professional qualification of researchers as well as a
precisely formulated diagnostic algorithm (a route of
the inspection and needed conditions) are important
components for reduction of errors in NMS.
Table 4: Influence of qualification of the diagnostician on
the results in TRO.
Calculated medical parameters, %
Volunteer 1 Volunteer 2 Volunteer 3
V
b
S
t
O
2
V
b
S
t
O
2
V
b
S
t
O
2
Series 1 M
5
11,9 87,6 20,9 73,0 28,0 84,0
Series 2 M
5
8,5 97,3 16,6 85,2 27,5 82,6
Series 3 M
5
17,7 77,6 16,6 85,5 27,4 82,7
M
3
12,7 87,5 18,0 81,2 27,6 83,1
4,6 9,9 2,5 7,1 0,3 0,8
36,3 11,3 13,8 8,7 1,1 0,9
3.4 Results on the Problem of Different
Probe Pressures
In previous section a problem of probable influence
of the probe pressure on final diagnostic results was
mentioned. All measurements are often performed in
contact with the tissue, so the contact pressure can
affect the local optical properties of the tissue that,
in turn, can lead to an emergence of the so-called
interactive component of errors (Rogatkin et al.,
2010), caused by interaction of the surveyed object
and the measurement tool. The contact pressure is
one of the reasons for that. Though the influence of
the contact pressure are described quite well today
(Reif et al., 2008); (Lim et al., 2011), nevertheless
we decided to add such research in our study. We
OpticalFiberProbeasaSourceofErrorsandUncertaintyinMeasurementsforOpticalNoninvasiveDiagnosticDevices
andTechniques
237

used LDF diagnostic technique and calibrated
cargoes which were put on a tip of the probe. An
example of continuous recording of the blood
microcirculation index I
m
in the finger pulp skin at
different probe pressure levels is presented in figure
9.
a b c d e f g
Figure 9: Registered blood flow at different pressure: (a)
without pressure, (b) 0.6 G/mm
2
; (c) 1.2 G/mm
2
; (d) 2.3
G/mm
2
; (e) 8.6 G/mm
2
; (f) 10.2 G/mm
2
; (g) 14.9 G/mm
2
.
The diagram shows that the pressure of around
10 G/mm
2
almost completely blocks the blood flow
in the finger skin. The more pressure is increased the
more different fluctuations in I
m
arise within the
pressure interval 2-10 G/mm
2
. In a similar way the
pressure impacts both on TRO and LFS data,
because under pressure the blood is squeezed out of
the microvasculature, and light absorption by blood
is decreased in the DV. The changes in absorption
determine a maximum of registered I
m
in the b
interval of the pressure. Thus, the interaction of a
surveyed biological object and an optical fiber probe
can lead to dramatic instrumental errors without
appropriate pressure control. More than 50% of the
total error according to our data can be accounted by
the interactive component of the error.
4 CONCLUSIONS
In the present study we have investigated some main
sources of errors and uncertainties in diagnostic data
caused by using an optical multi-fibers probe in
NMS. With the use of well-known statistical
methodology of multiple-repeated measurements
both on lifeless imitational tissue-like phantoms and
on real clinical patients (volunteers) the dispersion
and errors up to a level of +/-36,3% of the average
registered quantities were discovered in NMS. It is
shown that the interactive component of errors
caused by interaction of the optical fiber probe and
surveyed object gives the main contribution to the
total uncertainty of the measurement results.
The direct comparison of the diagnostic data
when using different probes with different distances
between fibers in the cord shows that for each DV
the constructive parameters of each optical fiber
probe should be standardised to have comparable
results. Also, a professional qualification of doctors
as well as a precisely formulated diagnostic route of
the inspection of patients are important components
of actions to reduce errors in NMS.
REFERENCES
Jenny, G., Biallas, M., Trajkovich, I., Fauchere, J-C.,
Bucher, H., Wolf, M., 2011. Reproducibility of
cerebral tissue oxygen saturation measurements by
near-infrared spectroscopy in newborn infants. J.
Biomed. Opt. 16. 097004.
Kutai-Asis, H., Kanter, I., Barbiro-Michaely E.,
Mayevsky, A., 2008. Classification of tissue
pathological state using optical multiparametric
monitoring approach. Proc. SPIE. 7280. 72801K.
Lim, L., Nichols, B., Rajaram, N., Tunnell, J., 2011. Probe
pressure effect on human skin diffuse reflectance and
fluorescence spectroscopy measurements. J. Biomed.
Opt. 16. 011012.
Nishidate, I., Maeda T., 2007. Visualizing depth and
thickness of a local blood region in skin tissue using
diffuse reflectance images. J. of Biomed. Opt., 12(5),
054006.
Pochivalik, M., Pichler, G., Zotter, H., Tax, N., Muller,
W., Urlesberger, B., 2011. Regional tissue oxygen
saturation: comparability and reproducibility of
different devices. J. of Biomed. Opt., 16, 057004.
Reif, A., Amorosino, M., Calabro, K., A’Amar, O., Singh,
S., Bigio, I., 2008. Analysis of changes in reflectance
measurements on biological tissues subjected to
different probe pressures. J. Biomed. Opt. 13(1).
010502.
Rogatkin, D., Prisnyakova, O., Moiseeva, L., 1998.
Analysis of the accuracy of clinical laser fluorescence
diagnosis. Measurement Techn. 41(7), 670-674.
Rogatkin, D., Lapaeva, L., 2003. Prospects for
development of noninvasive spectrophotometric
medical diagnosis. Biomed. Engin. 37(4). 217-222.
Rogatkin, D., Lapaeva, L., Petritskaya, E., Sidorov, V.,
2009. Multifunctional laser noninvasive spectroscopic
system for medical diagnostics and metrological
provisions for that. Proc. SPIE. 7368. 73681Y.
Rogatkin, D., Dunaev, A., Lapaeva, L., 2010.
Metrological support of methods and devices for non-
invasive medical spectrophotometry. Biomed.
Engineering. 44(2). 66-70.
Tchernyi, V., Rogatkin, D., Gorenkov, R. Karpov, V.,
Shumskiy, V., 2006. Complex noninvasive
spectrophotometry in examination of patients with
vibration disease. Proc. SPIE. 6078. 60782.
BIODEVICES2013-InternationalConferenceonBiomedicalElectronicsandDevices
238
