
INFERENCE OF GENE REGULATORY NETWORKS BY
EXTENDED KALMAN FILTERING USING GENE EXPRESSION
TIME SERIES DATA
Ramouna Fouladi
1
, Emad Fatemizadeh
1
and S. Shahriar Arab
2
1
Department of Electrical Engineering, Sharif University of Technology, Azadi ave., Tehran, Iran
2
Department of Biophysics, Faculty of Biological Sciences, Tarbiat Modares University, Tehran, Iran
Keywords: Gene expression, Extended Kalman filtering, Gene regulatory network modelling.
Abstract: In this paper, the Extended Kalman filtering (EKF) approach has been used to infer gene regulatory
networks using time-series gene expression data. Gene expression values are considered stochastic
processes and the gene regulatory network, a dynamical nonlinear stochastic model. Using these values and
a modified Kalman filtering approach, the model’s parameters and consequently the interactions amongst
genes are predicted. In this paper, each gene-gene interaction is modeled using a linear term, a nonlinear
one, and a constant term. The linear and nonlinear term coefficients are included in the state vector together
with the gene expressions’ true values. Through the extended Kalman filtering process, these coefficients
are updated in such a way that the predicted gene expressions follow the ones observed. Finally,
connections between each two genes are inferred based on these coefficients.
1 INTRODUCTION
Gene expression is a process in which gene products
are synthesized using inherent information in genes.
Regarding different expression levels of different
genes in a cell, proteins present in the cell will vary
both in amount and the kinds. Thus, the cell can be
in different states, e.g. growth or death. Different
genes’ products can affect the rate of expression of a
specific gene in a direct or indirect way. Gene
Regulatory Networks map these interactions in the
form of a network. One of the important challenges
is the development of efficient algorithms to infer
these underlying connections using gene expression
time series data without performing complicated
time-consuming laboratory experiments.
One of the methods for modelling gene
expression data is dynamic modelling of gene
regulatory networks. Some of these models are
Boolean network models (Chen and Aihara, 1999);
(D'haeseleer et al., 1999); (Holter et al., 2001),
(Wang et al., 2008a), Bayesian model (Ghahramani,
1998); (Liu et al., 2006); (Murphy and Mian, 1999),
state space models ; (Rangel et al., 2004); (Wu et al.,
2004)) and stochastic model (Cook et al., 1998);
(Tian and Burrage, 2003); (Wang et al., 2008b).
Several factors should be considered in
proposing methods for modelling gene regulatory
networks. First of all, it is widely accepted that gene
expression is a stochastic process, so the model
defining the interactions should be able to handle the
stochastic nature of the network. Nonlinearity of the
interactions is another issue which should be taken
into account. In addition, gene regulatory networks
are usually a function of a large number of variables
but the available time series data only consists of a
small number of observations. Another issue is the
inherent noise in gene expression data due to the
nature of the process in which DNA microarray
experiments are performed. A comprehensive model
is the one which handles all these issues. Still, most
available methods in the literature have not
considered all. The use of extended Kalman filtering
seems to be a proper solution.
In this paper, gene expression values are
considered as stochastic processes .each gene-gene
interaction is modelled using a linear term, a
nonlinear one, and a constant term. The linear and
nonlinear term coefficients are included in the state
vector together with the gene expressions’ values.
Through the extended Kalman filtering process,
these coefficients are updated in such a way that the
150
Fouladi R., Fatemizadeh E. and Shahriar Arab S..
INFERENCE OF GENE REGULATORY NETWORKS BY EXTENDED KALMAN FILTERING USING GENE EXPRESSION TIME SERIES DATA.
DOI: 10.5220/0003754801500155
In Proceedings of the International Conference on Bioinformatics Models, Methods and Algorithms (BIOINFORMATICS-2012), pages 150-155
ISBN: 978-989-8425-90-4
Copyright
c
2012 SCITEPRESS (Science and Technology Publications, Lda.)

predicted gene expressions follow the ones
observed. Finally, connections between each two
genes are inferred based on these predicted
coefficients. Four real-world gene expression data
sets are used to demonstrate the effectiveness of the
proposed algorithm.
The paper is organized as follows: section 2
describes the parameter estimation using EKF. Our
proposed method is discussed in section 3. The
experimental evaluation and discussions are given in
section 4, followed by conclusion and future works
in the final section.
2 PARAMETER ESTIMATION
USING EKF
In general, the nonlinear system dynamics and a
measurement are described by (Wang et al., 2009):
( 1) ((), ) ()
x
kfxk k
(1)
() ((), ) ()zk gxk vk
(2)
()k
and
()vk
are the process and measurement
noises which are assumed to be drawn from zero
mean multivariate normal distributions with
covariances.
k
Q
and
k
R
respectively. These two
noises are two independent white noises.
is the
vector of the unknown parameters and is included in
the state vector
() [(), ()]
T
X
kxkk
(3)
In order to use the Kalman or Extended Kalman
filters, some assumptions should be made.
Alongside the properties said for process and
measurement noises, we should assume Gaussian
probability distributions for the state variables. The
resulting dynamic equations are
(1) (()) ()
X
kFXkwk
(4)
() ( ()) ()zk GX k vk
(5)
Where
() [ (),0]
TT
wk k
(6)
( ()) [ ((), ()), ()]
TTT
F
Xk f xk k k
(7)
( ( )) ( ( ), ( ))GXk gxk k
(8)
Equations (4) and (5) serve as the state transition and
observation models respectively. Through a two
phase estimation process, the state vector is updated
in each step regarding the observations available.
A gene regulatory network containing
n
genes is
described by the following discrete-time nonlinear
stochastic dynamical system (Chen and Aihara,
1999), Where
ij
a
identifies the linear regulatory
relationship between genes
i
and
j
and
ij
b
identifies
the nonlinear relationship between genes
i
and
j
,
11
(1) () ((),)
( )
1, 2,..., 0,1, 2,..., 1
nn
iijjijjjj
jj
oi i
xk ax k bf x k
Ik
ink m
(9)
1
(, )
1
j
jj j
x
fx
e
(10)
function
f
is a sigmoid function and is easily
differentiable. When a detailed description is
lacking, a sigmoid function is often used.
3 THE PROPOSED METHOD
In our algorithm, the model (9) is written for each
pair of genes in the network. So equation (9) for
genes 1 and 2 turns into:
11111221111
12 2 2 01 1
(1) () () (())
( ( )) ( )
x
kaxkaxkbfxk
bf xk I k
22112222111
22 2 2 02 2
(1) () () (())
( ( )) ( )
x
kaxkaxkbfxk
bfxk I k
(11)
Setting
11 2 2
( ( )) [ ( ( )), ( ( ))]
T
fxk fxk f x k
model (9)
can be written in vector form as follows:
0
(1) () (()) ()
x
k Axk Bf xk I k
(12)
() () ()
y
kxkvk
(13)
if
11 21 12 22
[, , , ]
T
Aaaaa
and
11 21 12 22
[, , , ]
T
Bbbbb
,
the vector of unknown parameters would be
0
[ ]
TTT
A
BI
. Regarding equation (11), the
expression value of gene 1 at time step
k
is a linear
and a nonlinear function of the expression value of
the same gene at time-step
1k
and a linear and
nonlinear function of the expression value of gene 2
at time-step
1k
. In this paper, the coefficients
11
a
,
22
a
,
11
b
,
22
b
are set to zero in each time-step so that
each gene is bound to construct its expression values
at each time step from the expression values of the
other gene at the previous step, not its own. After
running the algorithm, we would have 4 time-series,
12
a
,
21
a
,
12
b
,
21
b
. For deducing the effect of gene 2
on gene 1, we first added up the absolute values of
INFERENCE OF GENE REGULATORY NETWORKS BY EXTENDED KALMAN FILTERING USING GENE
EXPRESSION TIME SERIES DATA
151

12
a and
12
b and then took an average over all time-
steps. The calculated number is indicative of the
strength of the regulatory influence of gene 2 on
gene 1. We did the same for finding the effect of
gene 1 on gene 2. After performing this process on
all pairs of genes, we would have an
nn
matrix (n
is the number of genes in the network), let’s call it
M
.
(, )
M
ij
denotes the effect of gene
j
on gene
i
. The final interactions between genes are deduced
from the elements of the matrix
M
. By setting a
threshold, directed interactions would be inferred
based on these numbers. We should assert that in
each run of the algorithm (for each pair of genes),
the initial condition of the state vector and standard
deviation of the process and measurement noises are
kept constant so that the conditions are equal for all
cases.
The threshold is set in a way that at most
12%A
upper values of the elements of the matrix
are chosen. A is the percentile of true connections to
all possible connections. So, with an approximate
knowledge of the number of connections, nearly all
of them can be extracted by our method, See table 1.
Table 1: Threshold derivation based on percentile of real
interactions.
Data set name
percentile of
True
connections
percentile of
chosen
elements
Yeast Data Set 27.27% 25%
E-coli first Data Set 12.5% 18.75%
E-coli 2nd Data Set 51% 50%
IRMA (Switch on) 32% 44%
IRMA (Switch off) 32% 44%
4 RESULTS AND DISCUSSIONS
Our algorithm was evaluated and compared with
ARACNE (Margolin et al., 2006), TDARACNE
(Zoppoli et al., 2010), dynamical Bayesian Networks
implemented in the Banjo package (Yu et al., 2004)
and ODE implemented in the TSNI package (Bansal
et al., 2006), with gene expression data of yeast cell
cycle (Spellman et al., 1998), two SOS signalling
pathways in E. coli (Ronen et al., 2002); (Gardner,
2003) and an in vivo synthetic network, called
IRMA (Cantone et al., 2009).
The performance is measured in terms of
Positive Predictive Value (PPV), Recall and F-score.
PPV is the percentage of inferred connections which
are correct and Recall is the percentage of true
connections which are correctly inferred by the
algorithm. Suppose TP = number of True Positives,
FP = number of false positives and FN = number of
false negatives,
TP TP
PPV= Recall=
TP+FP TP+FN
The overall performance depends on both the PPV
and Recall. The F- score is the geometric mean of
PPV and Recall and is a good indicator of
performance:
2(PPV.Recall)
F-score
PPV+Recall
(14)
4.1 Yeast Data Set
Next, we selected an eleven gene network from
yeast S. Cerevisiae cell cycle.
Selected genes are Cln3, Cdc28, Mbp1, Swi4, Clb6,
Cdc6, Sic1, Swi6, Cln1, Cln2, and Clb5. Here the
cdc15 dataset was used as it has the maximum
number of gene expression measurements.After data
normalization and interpolation using cubic-spline
interpolation, the algorithm was run. The results
were evaluated using Pathway studio software and
summarized in Table 2.
Table 2: Comparison of our algorithm with previous methods. The displayed values are in percent.
Our method TD ARACNE TSNI BANJO
PPV Recall F-Score PPV Recall F-Score PPV Recall F-Score PPV Recall F-Score
Yeast Data set
41 38 39 41 22 29 29 19 23 43 28 34
E-coli SOS pathway (first data set)
33 50 40 85 75 80 13 25 17 18 38 24
IRMA network
Our Algorithm TD-ARACNE TSNI BANJO ARACNE
PPV Recall F-score PPV Recall F-score PPV Recall F-score PPV Recall F-score PPV Recall F-score
Switch-ON data
54 88 67 71 67 69 80 50 61 30 25 27 50 60 54
Switch-OFF data
55 75 63 37 60 46 60 38 46 60 38 46 25 33 28
BIOINFORMATICS 2012 - International Conference on Bioinformatics Models, Methods and Algorithms
152
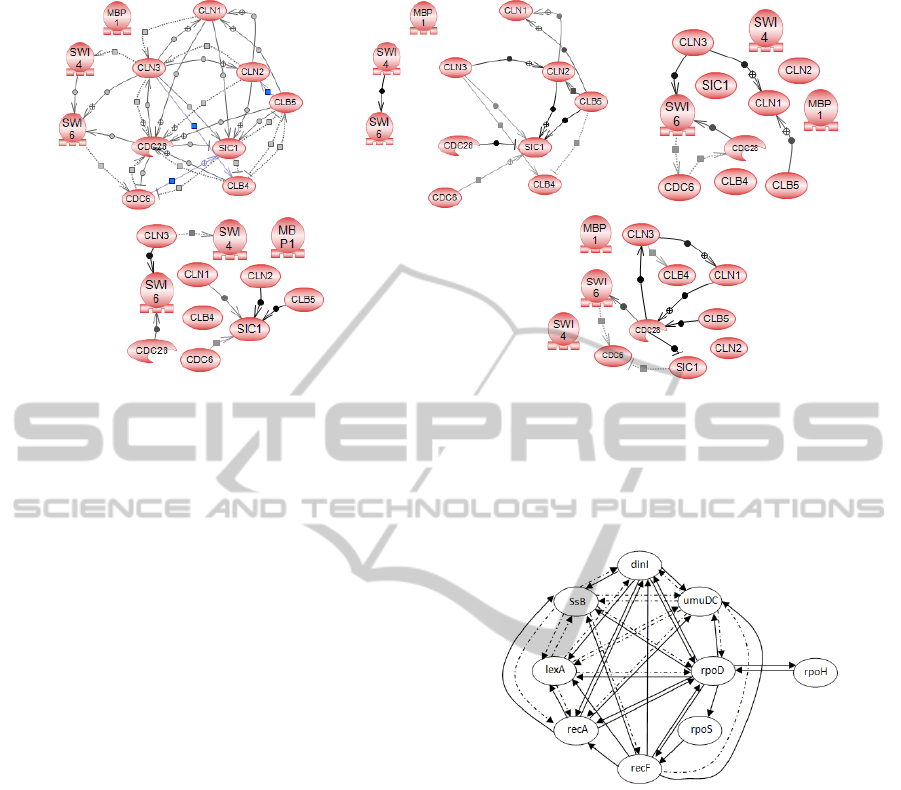
Figure 1: Yeast cell cycle pathways in Pathway Studio and inferred by 4 algorithms; from top left to bottom right. Pathways
in Pathway Studio software, inferred graph by our algorithm, by TSNI, by TD-ARACNE, by Banjo. True connections are
shown with direct lines. The conections inferred with false direction are considered False positives and not displayed.
The network built by Pathway Studio Software and
the inferred network is displayed in Figure 1.The
color density of the lines define the number of
credible references acclaiming the connection. As
can be seen, our algorithm mostly recovers the most
confident interactions
4.2 e-Coli SOS Pathway (First Data
Set)
We also tested the proposed algorithm using eight
genes in E. coli SOS pathway. The SOS pathway is
activated in response to DNA damage in which the
cell cycle is arrested and DNA repair is induced. The
selected genes for this experiment are polB, uvrA,
lexA, uvrD, recA, uvrY, ruvA and umuDC. The
results are displayed in Table 2. The true network
and the inferred network are displayed in Figure 3.
4.3 e-Coli SOS Pathway (Second Data
Set)
We also tested the algorithm on nine other genes of
the SOS pathway in E-Coli. Selected genes are dinI,
rpoS, rpoD, umuDC, Ssb, recA, lexA, recF and
rpoH. We compared the network that we found with
the one that was identified in (Gardner, 2003) and
with a literature survey of the known interactions
among these nine genes (Fig. 2). Apart from self
feedbacks, the network has 43 connections. TSNI
algorithm could find 20 connections correctly
(Bansal et al., 2006) while NIR found 22
connections correctly out of 43 known connections.
We could predict 30 of the connections correctly
with PPV=69.7%, recall=71% and F-score=70%
Figure 2: Gene regulatory interactions between nine genes
of SOS network in E-Coli (second dataset) known in
literature. Positive effects are shown as line, and negative
ones as dashed lines.
4.4 IRMA Network
In (Cantone et al., 2009), a synthetic network was
built in the yeast Saccharomyces cerevisiae.
In this study, they tested the transcription of
network genes when culturing cells in galactose or
glucose. There are two sets of gene profiles, Switch
ON and Switch OFF. The first one corresponds to
shifting of the growing cells from glucose to
galactose and the second one corresponds to the
reverse shift. The inferred graph and true network
are displayed in Figure 4. The results are also
displayed in Table 2.
INFERENCE OF GENE REGULATORY NETWORKS BY EXTENDED KALMAN FILTERING USING GENE
EXPRESSION TIME SERIES DATA
153
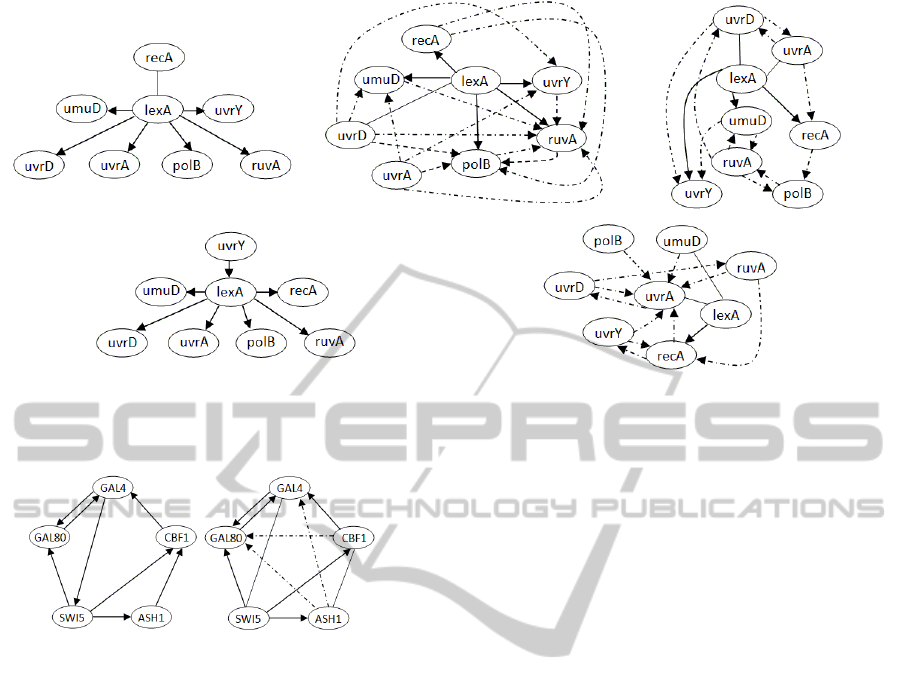
Figure 3: e-Coli SOS true pathway and inferred by 4 algorithms; from top left to bottom right, Original pathways, inferred
graph by our algorithm, by Banjo by TD-ARACNE, by TSNI. True positives are shown by direct lines and false positives
by dashed lines. Missing verse on the connection means that the algorithm recovers the wrong verse.
Figure 4: Left: Yeast synthetic network, right: network by
our algorithm (switch OFF dataset). Missing verse on the
connection means that the algorithm recovers wrong verse
As can be seen, in case of Yeast, we have a
considerable increase in Recall, which means the
proposed method can infer more of the true
interactions. It should be noted that this increase in
Recall not only hasn’t caused the PPV to decrease
but also has led to a larger F-Score. In case of the
first E-Coli dataset, PPV, Recall and F-Score have
increased considerably comparing the results of
TSNI and Banjo. In case of IRMA switch ON data,
PPV, Recall and F-score is greater than those of
ARACNE, Banjo and TSNI. Although the proposed
method has an F-Score almost equal to that of TD
ARACNE, the Recall value is greater. In case of
IRMA Switch OFF dataset, F-Score has an increase
around 20% compared to the best result by other
methods.
5 CONCLUSIONS
An algorithm was developed in this paper using
extended Kalman filtering. Results were good for
medium networks, but as said, the interactions are
deduced based on a two by two process. The
algorithm should be extended so that inference of
much larger networks is possible without much
computational cost. Using a clustering method prior
to running the algorithm and performing the
algorithm in each cluster separately seems a good
solution. In addition, in the expression profiles, only
the mRNA concentration is measured, while with
taking into account other biological data, better
results can be gained.
REFERENCES
Bansal, M., Della Gatta, G. and DI Bernardo, D., 2006.
Inference of Gene Regulatory Networks and
Compound Mode of Action from Time Course Gene
Expression Profiles. Bioinformatics, vol. 22, no. 7,
815-822.
Cantone, L., Marucci, L., Lorio, F., Ricci, M., Belcastro,
V., Bansal, M., Santini, S., DI Bernardo, M., DI
Bernardo, D. and Cosma, M., 2009. A Yeast Synthetic
Network for In Vivo Assesment of Reverse-
Engineering and Modeling Approaches. Cell, 137,
172-181.
Chen, T. and Aihara, K. Year. Modeling Gene Expression
with Differential Equations. In: proc. pacific symp.
Biocomputing, 1999. 29-40.
Cook, D. L., Gerber, A. N. and Tapscott, S. J. Year.
Modeling Stochastic Gene Expression: Implications
for Haploinsufficiency. In: Proc. Nat'l Academy of
Science, USA, 1998. 15641-15646.
D'haeseleer, P., Wen, X., Fuhrman, S. and SOMOGYI, R.
Year. "Linear Modeling of mRNA Expression Levels
BIOINFORMATICS 2012 - International Conference on Bioinformatics Models, Methods and Algorithms
154

during CNS Development and Injury,". In: Proc.
Pacific Symp. Biocomputing, 1999. 41-52.
Gardner, T. 2003. Inferring genetic networks and
identifying compound mode of action via expression
profiling. Science, vol. 301, 102-105.
Ghahramani, Z. 1998. Learning Dynamic Bayesian
Networks. Adaptive Processing of Sequences and
Data Structures, Springer-Verlag, 168-197.
Holter, N. S., Maritanm, A., Cieplak, M., Fedoroff, N. V.
and Banavar, J. R. 2001. "Dynamic Modeling of Gene
Expression Data,". Proc. Nat'l Academy of Science.
USA.
Liu, T., Sung, W. and Mittal, A. 2006. Model Gene
Network by Semi-Fixed Bayesian Network. Expert
Systems with Applications, vol. 30, no.1, 42-49.
Margolin, A. A., Nemenman, I., Basso, K., Wiggins, C.,
Stolovitzky, G., Dalla Favera, R. and Califano, A.
2006. ARACNE: an algorithm for the reconstruction
of gene regulatory networks in a mammalian cellular
context. BMC Bioinformatics, 7 Suppl 1, S7.
Murphy, K. and Mian, S. 1999. Modeling Gene
Expression Data Using Dynamic Bayesian Networks.
technical report, Univ. of California.
Rangel, C., Angus, J., Ghahramani, Z., Lioumi, M.,
Sotheran, E. A., Gaiba, A., Wild, D. L. and Falciani,
F. 2004. Modeling T-Cell Activation Using Gene
Expression Profiling and State Space Models.
Bioinformatics, vol. 20, no. 9, 1361-1372.
Ronen, M., Rosenberg, R., Shraiman, B. and Alon, U.
Year. Assigning Numbers to the Arrows:
Parameterizing a Gene Regulation Network by Using
Accurate Expression Kinetics. In: Proc Nat'l Academy
Science, USA, 2002. 10555-10560.
Spellman, P., Sherlock, G., Zhang, M., Iyer, V., Anders,
K., Eisen, M., Brown, P., Botsein, D. and B, F. 1998.
Comprehensive Identification of Cell Cycleregulated
Genes of the Yeast Saccharomyces cerevisiae by
Microarray Hybridization. Molecular Biology of the
Cell, vol. 9, no. 12, 3273-3297.
Tian, T. and Burrage, K. Year. Stochastic Neural Network
Models for Gene Regulatory Networks. In: Proc. 2003
IEEE Congress Evolutionary Computation, 2003. 162-
169.
Wang, Z., Gao, H., Cao, J. and Liu, X., 2008a. “On
Delayed Genetic Regulatory Networks with Polytopic
Uncertainties: Robust Stability Analysis,”. IEEE
Trans. NanoBioscience, vol. 7, no. 2, 154-163.
Wang, Z., Liu, X., Liang, J. and Vinciotti, V., 2009. An
Extended Kalman Filtering Approach to Modeling
Nonlinear Dynamic Gene Regulatory Networks via
Short Gene Expression Time Series. IEEE/ACM
Transactions on Computational Biology and
BioinformaticS, vol. 6, no. 3, 410-419.
Wang, Z., Yang, F., Ho, D. W. C., Swift, S., Tucker, A.
and Liu, X. 2008b. Stochastic Dynamic Modeling of
Short Gene Expression Time Series Data. IEEE Trans.
NanoBioscience, vol. 7, no. 1, 44-55.
Wu, F., Zhang, W. and Kusalik, A. J. Year. Modeling
Gene Expression from Microarray Expression Data
with State-Space Equations. In: Proc. Pacific Symp.
Biocomputing, 2004. 581-592.
Yu, J., Smith, V., Wang, P. and Hartemink, A. 2004.
Advances to Bayesian Network Inference for
Generating Causal Networks from Observational
Biological Data. Bioinformatics, vol. 20, no. 18, 3594-
3603.
Zoppoli, P., Morganella, S. and Ceccarelli, M. 2010.
TimeDelay-ARACNE: Reverse engineering of gene
networks from time-course data by an information
theoretic approach. BMC Bioinformatics, 11, 154.
INFERENCE OF GENE REGULATORY NETWORKS BY EXTENDED KALMAN FILTERING USING GENE
EXPRESSION TIME SERIES DATA
155
