
EXTRACTING TOPOLOGICAL INFORMATION FROM
GRID MAPS FOR ROBOT NAVIGATION
David Portugal and Rui P. Rocha
Institute of Systems and Robotics, University of Coimbra, 3030-290 Coimbra, Portugal
Keywords:
Robot navigation, Graphs, Topological maps, Voronoi diagrams.
Abstract:
In many robotic navigation-related tasks, abstracting the environment where mobile robots carry out some
mission can be of a great benefit. In particular, extracting a simple topological graph-like representation from
a more complex and detailed metric map is often required for path-planning and navigation. In this work, an
approach to perform such extraction in grid maps is presented. The focus is not only on obtaining a diagram or
visual representation of possible paths, but also to propose a new way to obtain graph data information related
to the connectivity of the environment that can be passed to robots or to a centralized planner, in order to assist
the navigation task. The approach proposed is based on image processing techniques. Simulation results prove
its simplicity, accuracy and efficiency.
1 INTRODUCTION
In the context of robotics, it is very important for au-
tonomous mobile robots to learn and preserve models
of the environment. Without an internal description
of the environment, and information of their position
and orientation with respect to this map, most mobile
robotic tasks, like driving while avoiding collisions
and navigating, would become impractical.
In navigation tasks, it is normally assumed that
the environment is known a priori. On the other
hand, exploration is generally related to completely
or partially unknown environments. For both cases,
maintaining or building internal representations of the
infra-structure is one of the key issues to the success-
ful completion of the task.
The two major distinct paradigms for mapping in-
door environments are grid-based maps and topologi-
cal maps (Thrun, 1998). In the present work, we focus
on the latter one.
Grid-based methods produce accurate metric
maps, are easy to build, represent and maintain, but
often suffer from memory space and time complex-
ity, because of its fine resolution restrictions which
results in memory problems and also harder efficient
planning and navigating in large-scale infrastructures.
Topological maps, on the other hand, produce graph-
like maps that can be used much more efficiently.
They are simpler, permit efficient planning and do
not require accurate determination of the robot’s posi-
tion. In these maps, vertices correspond to important
places or landmarks, which are connected by edges
that represent paths between them. However, its in-
accuracy makes it harder to maintain consistency in
large scale environments, which results in difficulties
in recognizing similar places that look alike. There
are some other constraints related to navigation us-
ing topological maps. Some limitations previously
identified (Zimmer et al., 1994) were: handling in-
accurate position and orientation information and de-
tecting neighbor vertices in the topological map by
traversing them, as opposed to sensing or recogniz-
ing them. Despite these constraints, the path planning
method that was used produced adequate results.
In addition, map validation and self-localization in
topological maps is also an important issue for correct
robot navigation, which has been extensively stud-
ied (Dudek et al., 1997). As seen before, topologi-
cal maps can be a very important tool for most tasks
using mobile robots. Many works exploit this simple
representation to employ correct robot navigation. In
Ferreira et al. (Ferreira et al., 2007), a robot drives
around the environment and self-localizes, while us-
ing a place recognition technique to build 3D point
cloud sets for monitoring changes that might take
place in the environment.
In this work, the focus is mainly on obtaining a
global topological abstraction from a preexisting met-
ric representation of an environment. For example,
for surveillance, monitoring and patrolling tasks with
137
Portugal D. and P. Rocha R..
EXTRACTING TOPOLOGICAL INFORMATION FROM GRID MAPS FOR ROBOT NAVIGATION.
DOI: 10.5220/0003746401370143
In Proceedings of the 4th International Conference on Agents and Artificial Intelligence (ICAART-2012), pages 137-143
ISBN: 978-989-8425-95-9
Copyright
c
2012 SCITEPRESS (Science and Technology Publications, Lda.)

multiple robots, it is common to rely on topological
maps for navigation issues. In a previous work (Por-
tugal and Rocha, 2010), we presented a novel multi-
robot patrolling algorithm based on topological maps.
In this article, we describe in detail how complete
topological information is extracted from an existing
2D grid map representation of the area to be patrolled,
which in turn can be obtained with a state-of-the-art
robotic mapping technique, e.g. (Thrun et al., 2000).
The next section presents a survey of previous
techniques for extracting topological representations
like diagrams and graphs from metric representations
given a priori. Typically, these metric representations
are occupancy grids, which are probabilistic maps
wherein each cell of the grid contains a probability
value that indicates whether the related location is free
space or part of an obstacle (Elfes, 1989). These grids
are usually obtained in a preceding exploration phase.
In Section III, we state the problem to be addressed
and Section IV presents the algorithm proposed to
solve it. Later on, results are presented and the article
ends with conclusions and future work.
2 RELATED WORK
In the literature, there are a few existing techniques to
extract topological representations using metric maps.
In particular, Voronoi Diagrams (Voronoi, 1908) have
been extensively used to plan a path that stays away
from obstacles as far as possible. In addition, the Gen-
eralized Voronoi Diagram (GVD) (Wallgr
¨
un, 2004)
was described as a “retraction of the free space of
the working space onto a network of one-dimensional
curves reflecting the connectivity of free space” and
a hierarchically organized Voronoi-based route graph
representation for robot navigation in indoor scenar-
ios was proposed.
Furthermore, the Extended Voronoi Graph (EVG)
(Beeson et al., 2005) has been presented more re-
cently. In this new approach, the diagram (or skele-
ton) computation overcomes limitations in the sen-
sory horizon of robots by clearly defining a tran-
sition from corridor-following to wall-following in
large rooms. Although defined as a graph, beyond the
actual diagram no information about vertices or edges
is available after the final computation.
Additionally, Kolling and Carpin (Kolling and
Carpin, 2008) proposed a method to extract graph
representations from occupancy grids for surveillance
tasks, based on the GVD. Graph modifications, called
contractors, are promoted to simplify the surveillance
problem towards solving it using fewer robots.
Another commonly used technique when extract-
ing graphs is the Delaunay triangulation (DT) (Delau-
nay, 1934). In fact, the DT of a discrete point set gen-
erally corresponds to the dual graph of the Voronoi
diagram for the same point set.
Katsilieris et al. (Katsilieris et al., 2010) extract
the traversability graph from the original metric map
in the context of searching intruders with a team of
robots. Firstly, the obstacle-free area is triangulated
and then triangles are merged to form large convex
regions where the vertices are extracted. The set of
edges consists of all pairs of regions that share a side.
In addition, a technique called Reduced Con-
strained Delaunay Triangulation to build graphs is
also becoming popular. This technique is based on
a DT computation together with a mechanism to re-
duce the graph by minimizing the distance each robot
has to traverse. It was applied by Fazli et al. (Fazli
et al., 2010) in the context of a multi-robot area cov-
erage task in a known and static 2D environment.
Another method presented in the literature to ex-
tract the graph of an environment is the visibility
graph (Lozano-P
´
erez and Wesley, 1979), which is
composed of straight lines joining a sequence of ver-
tices that are normally placed near the limits of obsta-
cles in the environment (considering the dimension
and pose of the robot). The graph is created connect-
ing all vertices that can “see” each other, hence the
name visibility graph.
Among the most used techniques are also thinning
(Ko et al., 2004) and skeletonization (Szab
´
o, 2004)
methods. These are operations used to remove the
foreground pixels from binary images, analogously
to peeling an onion. They provide a skeleton of the
image, reducing all lines to a single pixel thickness.
The output of such techniques is similar to the GVD.
Szab
´
o (Szab
´
o, 2004) also refers in his work some
other methods for extracting topological maps from
occupancy grids, namely sparse pixel approaches and
matching opposite contours. Moreover, another tech-
nique called C-cells can be found in the literature
(Machado, 2002). It has the principle to divide the
space not occupied by obstacles into convex polygons
and the vertices of the graph are positioned in the cen-
ter of those polygons, having each vertex connected in
a straight line to the closest visible vertex.
Most previous works mentioned above present
methods to visually extract the topological represen-
tation. However, many of these do not correctly char-
acterize vertices and edges on the graph (like Voronoi
Diagrams, EVG, thinning or skeletonization). As for
those that do, the methods which are based on De-
launay Triangulation need a manual definition of the
vertices in the environment to compute the topology
and usually generate non-elegant and unbalanced rep-
ICAART 2012 - International Conference on Agents and Artificial Intelligence
138

resentations. In the case of visibility graphs, highly
inadequate topologies are produced since the vertices
are positioned very close to obstacles, which is unnat-
ural for robot navigation. The Generalized Voronoi
Graph (GVG), which consists of a vertex for every
meet and end point of the GVD and edges reflect-
ing the connectivity of the GVD, results in very com-
plex graphs with a large number of vertices and edges
that are mostly redundant, especially when consid-
ering navigation tasks for robots. In addition, all of
these methods assume that the edges connecting pairs
of neighboring vertices must be a straight line, which
is not necessarily true for robots with the ability to
locally plan paths between two vertices.
In this work, we intend to go further ahead, by
firstly extracting an elegant topological representation
and then focusing on identifying vertices, edges and
their length (i.e., their weight) and obtaining relevant
data concerning the vertices and the connectivity be-
tween areas of the map so as to assist robots navi-
gation in tasks like patrolling, coverage, monitoring,
surveillance, pursuit-evasion and others.
3 PROBLEM STATEMENT
In this work, the environment is assumed to be known
a priori and a metric representation, typically with the
form of an occupancy grid, is available. The goal is
to abstract the environment through a topological rep-
resentation, i.e., a graph, and obtain all information
about the graph’s connectivity.
The techniques described in the previous section
will lead to different graph representations, like plac-
ing vertices close to obstacles, inserting them halfway
between obstacles or positioning them in a uniform
way along the terrain. Having this in mind, a careful
choice should be made, considering the applications
in which the extraction is applied.
We start with a skeleton representation and then
focus on extracting topological information to char-
acterize the connectivity of the environment. There
are several techniques to compute the initial skele-
ton as seen previously in section II. In this work, it
is obtained via the EVG computation, mainly because
of its results in terms of producing visually attrac-
tive path representations that stay away from obsta-
cles and that consider the sensing range of the robots
as an input of the method. Additionally, it is a rela-
tively recent technique, which is open source and is
easily adaptable to the code that was developed. Hav-
ing the representation of the skeleton, the graph is ob-
tained through image processing techniques by cor-
rect identification of vertices and edges. The topolog-
ical map is modeled as an undirected graph. Vertices
represent places and edges represent the connectivity
(in both directions) between those places.
In the next section, we present the algorithm to
extract the complete topological information and its
simplicity and efficiency becomes clear.
4 THE ALGORITHM
In a previous work (Portugal and Rocha, 2010) a pa-
trolling simulator was used to validate a multi-robot
patrolling approach based on balanced graph parti-
tioning. Here, we show how the pre-assumed graph
is provided to the patrolling simulator. The algorithm
is comprised of 4 steps which are detailed below.
4.1 Acquiring the Skeleton
A tool named EVG-THIN developed by Patrick Bee-
son (Beeson et al., 2005) was used to acquire skele-
tons from occupancy grids in this project. “EVG”
stands for the Extended Voronoi Graph, which al-
though being called a graph, does not present out-
put related to information about vertices and edges
on the graph, giving instead an enhanced skeleton
on top of a grid map, when compared to the GVD.
“THIN” accounts for the pixel-based thinning algo-
rithm that finds skeletons of bitmaps, which is a fast
approximation of the Voronoi diagram. Its code was
written to be applied in real-time to occupancy grids,
where cells are either occupied, free, or unknown,
but it also works on any grayscale bitmap image in
other domains. This command-line application runs
in any Linux console upon the definition of some pa-
rameters, such as the pixels’ threshold for considering
them free, unknown or occupied; or the robot’s mini-
mum distance to an obstacle to account for the robot’s
geometric dimension and sensing range when navi-
gating in the map. Setting these parameters correctly
is important, because the computed skeleton and final
topology depends substantially on those parameters.
The Patrolling Simulator interface displays a win-
dow to set all the input parameters reusing and evolv-
ing the EVG-THIN’s code, which is run in back-
ground
1
, obtaining the 1 pixel-thin skeleton of the en-
vironment, as seen on Figure 1 (right).
1
Note that this program is released under the GNU Gen-
eral Public License (GPL), which is intended to guarantee
the freedom to share and change free software.
EXTRACTING TOPOLOGICAL INFORMATION FROM GRID MAPS FOR ROBOT NAVIGATION
139
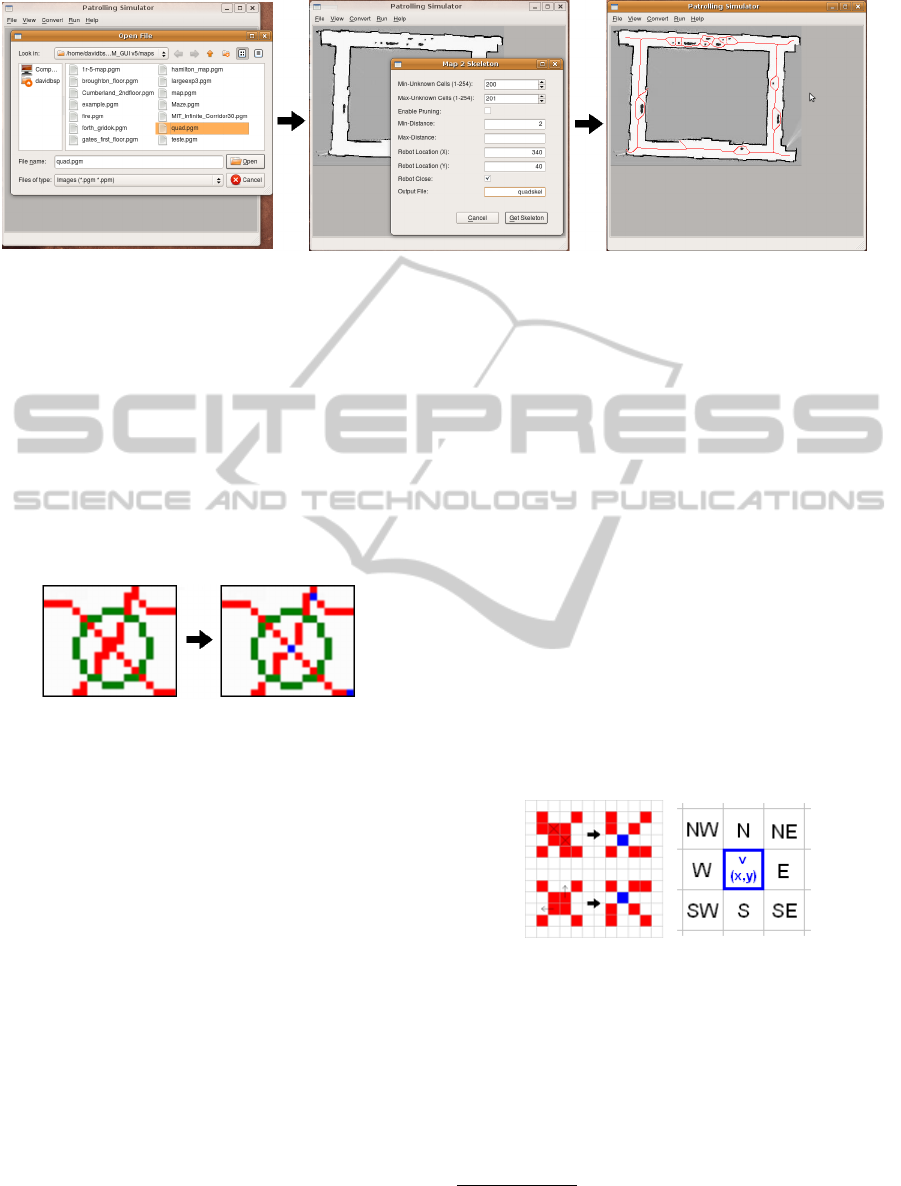
Figure 1: EVG-THIN incorporated in the simulator.
4.2 Cluster Image Removal
Due to aliasing, sometimes the skeleton representa-
tion generated in the previous section presents clus-
ters, i.e., sets of 4 pixel squares, as shown on Figure 2.
These clusters are problematic, in the sense that they
interfere with the subsequent detection of vertices in
the graph, due to the 1 pixel-thin skeleton assumption.
Therefore, an intermediate phase to avoid future data
corruption when detecting the vertices and edges is
necessary: Cluster Removal.
Figure 2: Cluster detection and correction. The blue dots
correspond to vertices subsequently identified.
A protective filter was developed to detect and re-
move such clusters. Basically, it sweeps the image
and when a cluster is detected, two actions are possi-
ble:
• Pixel Removal: Eliminate unnecessary pixels
from the cluster;
• Pixel Shifting: Move pixels to the cluster’s
neighborhood.
These actions are conducted without affecting the
connectivity of the graph. In Figure 3, on the left side,
two examples of their application are shown. On top,
the 2 pixels marked by a cross are removed, because
they are unnecessary to guarantee the connection be-
tween all branches.
When a cluster is identified, the filter checks the
implications of removing pixels; more specifically it
guarantees that no disconnections resulting from eras-
ing pixels will exist, by inspecting all the neighbor
pixels around the cluster.
Erasing pixels is not always possible, as it can be
observed in the bottom left of Figure 3, where remov-
ing red pixels would create gaps in the skeleton un-
derneath. Hence, a pixel shifting strategy was created
to remedy such situations.
4.3 Detecting Vertices
Having the cluster-free skeleton, the next step is ex-
tracting all vertices of the graph by image process-
ing, which is done on top of the previously generated
skeleton. The process is fairly simple, due to the 1-
pixel thin assumption. Vertices correspond to single
pixels that are placed in two specific locations:
• Dead-ends: Pixels that typically only have one
neighbor pixel that also belongs to the skeleton. They
originate vertices with degree
2
one.
• Branch intersections: Crucial pixels that corre-
spond to crossings of the branches of the skeleton.
They usually have three or more neighbor pixels that
also belong to the skeleton, within the eight pixels
around them. They originate higher degree vertices.
Figure 3: On the left side: Cluster Analysis - Pixel removal
on top and pixel shifting below. On the right side: Possible
neighbor directions.
The process shown in pseudo-code by Algorithm
1 is conducted to identify all vertices in the graph.
Basically, the intent is to inspect the 9-pixel window
centered on the analyzed pixel of the skeleton and ver-
ify if it is a dead-end or a branch intersection. When
the vertex is identified, a single blue pixel is drawn in
2
“The degree (or valency) d
G
(v) = d(v) of a vertex v
is the number |E(v)| of edges at v (...), this is equal to the
number of neighbours of v” (Reinhard, 2010).
ICAART 2012 - International Conference on Agents and Artificial Intelligence
140
1 foreach pixel p of the image do
2 if p is red then
3 count ← number of red pixels inside
9-pixel window centered on p;
4 else
5 count = 0;
6 end
7 if count > 3 then // Exclude pixels with 3 or
more neighbors that do not correspond to
branch intersections.
8 foreach two adjacent red pixels around
p do
9 count = count −1;
10 end
11 foreach three adjacent red pixels
around p do
12 count = count −2;
13 end
14 else if count = 3 then // Dead-end (with more
than one neighbor pixel)
15 if two adjacent red pixels around p then
16 count = count +1;
17 end
18 end
19 if count > 3 ∨ count = 2 then
20 p is a vertex ⇒ blue pixel in p;
21 end
22 end
Algorithm 1: Pseudo-Code of the vertex detection process.
the correct spot. Note that this algorithm relies on the
fact that no clusters exist in the graph.
After running the algorithm, the visual represen-
tation of the graph on top of the grid is complete, as
it will be shown on the results section, where the ver-
tices were highlighted for better identification.
4.4 Extracting Relevant Topological
Information
The last step of the algorithm is to compute the rest
of the topological information to completely charac-
terize the graph (edges, connectivity, etc.). In this
work, each vertex data structure will have the follow-
ing fields associated to it:
• ID
• Coordinates (x, y)
• Degree
• Neighbors (Vertex Degree)={ID, direction, edge
weight}
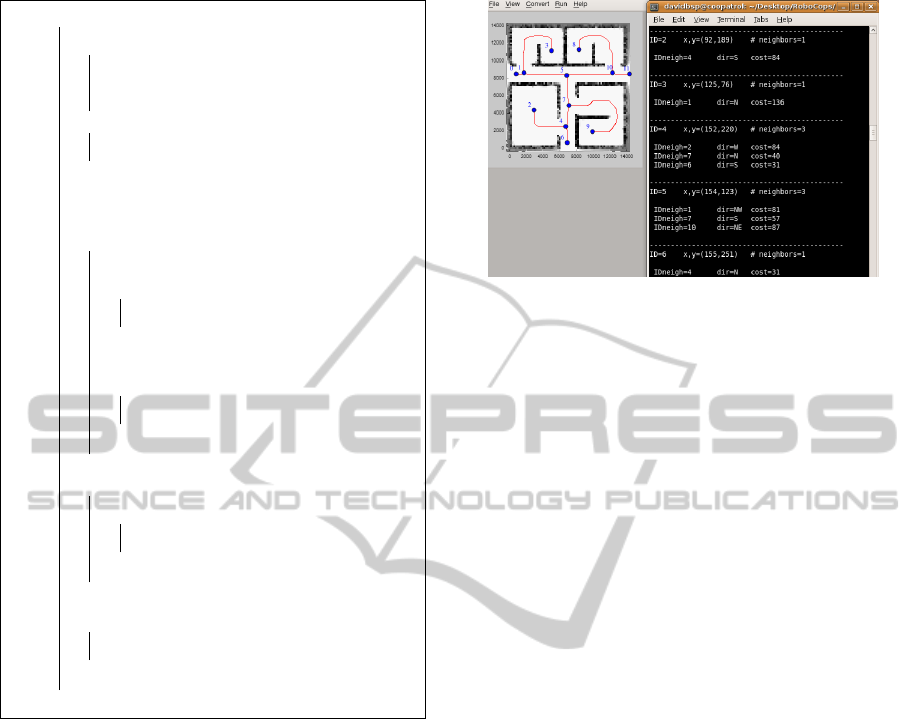
Figure 4: Extracting the graph and relevant topological in-
formation. Example of a simple tree-like graph with 12 ver-
tices.
In this step, the main concern is to convert visual
information into graph data that can be used by robots
to abstract the environment.
The ID and coordinates (x, y) of each vertex are
easily extracted by looking for the blue pixels in the
picture and assigning them ID’s and saving their (x,
y) pixel coordinates.
The other fields are obtained subsequently, also by
image processing, by following all branches leaving
the vertices via the red pixels’ routes. When a blue
pixel is found at the end of a route, a neighbor ver-
tex is recognized, therefore the degree of the initial
pixel is incremented, and a new entry to the neigh-
bors table of the initial vertex is filled: the ID of the
newly-detected neighbor vertex, its direction related
to the initial vertex and the edge weight between the
2 vertices.
The ID is obtained by relating the coordinates of
the newly-detected vertex to the ID list previously
computed. The direction is defined in a similar way
to the compass rose designation, as show on the right
side of Figure 3, e.g., if the direction of the route lead-
ing to the neighbor vertex starts in the pixel above
the examined vertex, than the direction is defined as
North (N). Also, the edge weight between vertices is
defined as the cost of travelling from one vertex to an-
other in pixel units, more specifically, the number of
red pixels in the edge between both vertices.
Every vertex is identified by a single blue pixel, as
shown previously in Figure 2. After obtaining all the
data fields, each vertex will have a table of neighbors
with the size of its degree and all the edges and the
connectivity between neighbor vertices will be well
characterized. This is clear in Figure 4. Having all
this information, the framework for agents’ naviga-
tion in the Patrolling Simulator is finally created.
EXTRACTING TOPOLOGICAL INFORMATION FROM GRID MAPS FOR ROBOT NAVIGATION
141
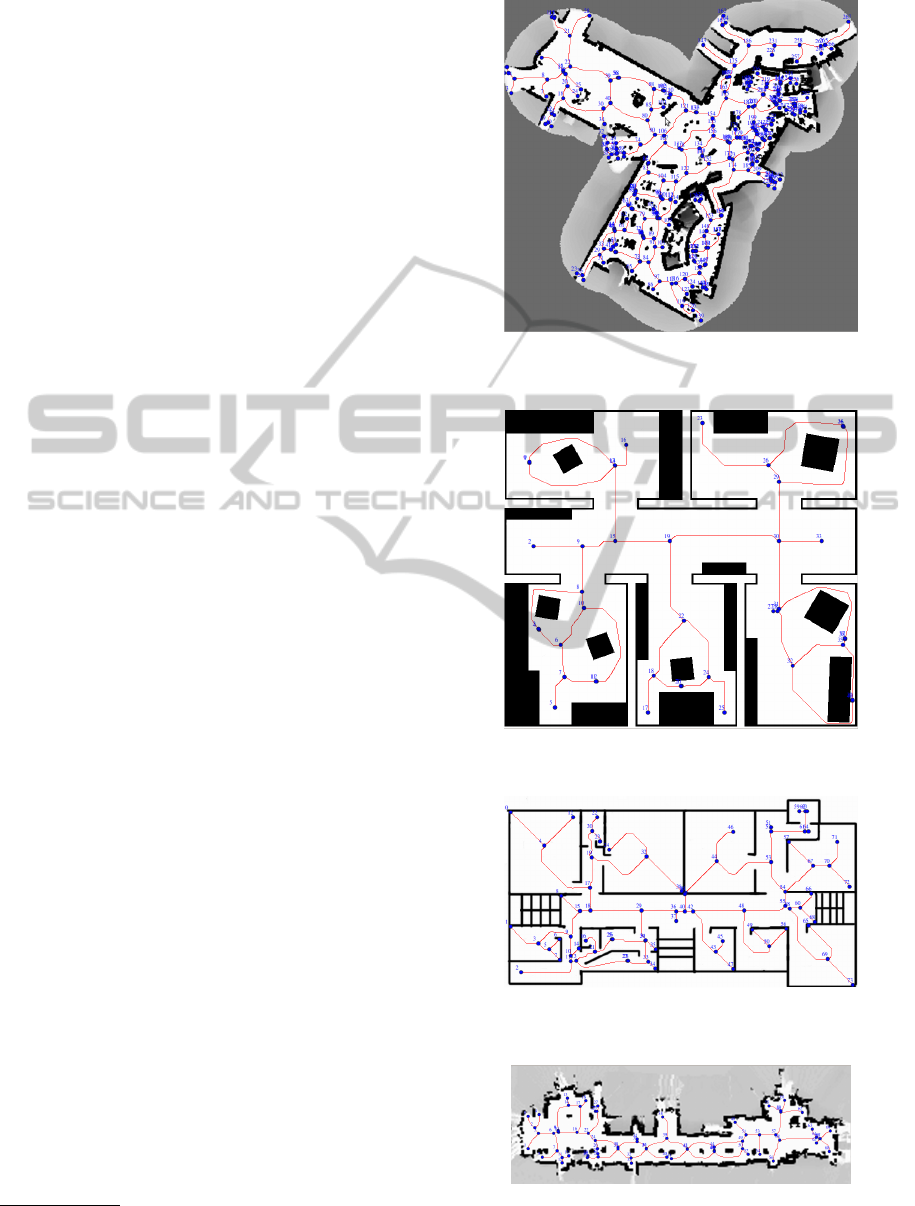
5 RESULTS AND DISCUSSION
The algorithm presented in this article was tested us-
ing a large diversity of maps that generated elegant
and balanced representations that range from simple
topologies to complex ones. An important aspect is
that the complexity of the topological maps extracted
has no relation to the dimension of the environment
(in terms of Cartesian distances). The algorithm at-
tained clear and visually attractive graph representa-
tions from metric maps of all sizes and shape, pre-
senting no vertices with self-loops, staying away from
obstacles and considering the sensing range of the
robots; showing that it scales well in terms of envi-
ronment, as shown in Figures 5-8. Beyond the ac-
curate results obtained, the algorithm has shown to
be computationally efficient. The C++ programming
language was used and the Graphical User Interface
(GUI) for the Patrolling Simulator was implemented
using QT Open Source Edition 4.4.3, which is also
based on C++ Language
3
. The system ran on Ubuntu
8.10 Intrepid on an AMD Athlon 64 Processor 3500+,
2.21GHz, with 1GB RAM.
Table 1 illustrates the time taken by the algorithm
to extract all information from diverse metric maps,
which is dependent not only on the amount of pix-
els in the free area of each metric map, as well as the
complexity of the generated graph. Around 95% of
the time values shown is spent computing the skele-
ton of the environment (first step of the Algorithm),
which is the responsibility of EVG-THIN. The three
other steps of the approach are computed in a few
hundredths of second, which is extremely fast con-
sidering the application for which it was designed for.
The image pixels presented in the table do not re-
late in the same way, for every case, to the free pixels
detected in each image. It is also clear that the com-
putation time does not depend exclusively on this. It
also depends on the graph’s dimension as, for exam-
ple, the fourth and fifth line of the table highlights.
These results attest to the applicability of the
method proposed herein. It is a valuable method for
obtaining a topological map of the environment from
either an a priori known metric map or a metric map
being built on the fly.
6 CONCLUSIONS AND FUTURE
WORK
In this article, a novel way to extract topological maps
3
The Patrolling simulator code is available at:
http://paloma.isr.uc.pt/%7Edavidbsp/packages
Figure 5: Results for a complex graph (268 vertices) with
high connectivity.
Figure 6: Results for a medium graph (41 vertices) with
defined connectivity.
Figure 7: Results for a medium graph (74 vertices) with
defined connectivity.
Figure 8: Results for a graph with 70 vertices and a few
connectivity constraints.
ICAART 2012 - International Conference on Agents and Artificial Intelligence
142

Table 1: Computation time for different metric maps.
Image Pixels # Vertices Time (s)
90K 12 0.40
341K 74 1.38
379K 20 1.42
343K 66 1.57
509K 206 1.61
544K 268 1.63
815K 135 3.62
and connectivity information from standard grid-like
grayscale representations is described. The approach
presented gains advantage from its simplicity, accu-
racy and performance. One possible disadvantage of
using the EVG-THIN method to compute the skeleton
of the grid map is the dependency on the correct pa-
rameterization, which is not straightforward for most
cases. However, the approach presented in this pa-
per is not limited to the use of EVG-THIN to extract
the skeleton, other techniques like those mentioned in
Section II, can also be used.
Unlike most previous works in this area, here the
intent is not to present solely a representation of the
graph on top of the grid, but also to give one step
ahead by proposing a way to convert visual informa-
tion into data structures, by means of image process-
ing techniques as described.
The proposed approach offers, as output, a com-
plete characterization of the topological aspects of the
environment, which has the ability to assist robot’s
navigation in a broad spectrum of activities, espe-
cially those that include path planning.
As for future work, it would be interesting to test
this approach using different methods in the literature
to obtain the underlying diagram to check whether it
is possible to speed up the first step of the algorithm
without losing quality on the topological representa-
tion. Additionally, some questions are still left open
like addressing fast update of the Voronoi Diagram
given dynamic changes in the environment as well as
considering 3D models and deal with topological nav-
igation using mobile robots in real world scenarios.
REFERENCES
Beeson, P., Jong, N., and Kuiper, B. (2005). Towards au-
tonomous topological place detection using the ex-
tended voronoi graph. In Int. Conf. on Robotics and
Automation (ICRA’05), pages 4373–4379, Barcelona.
Delaunay, B. (1934). Sur la sph
´
ere vide. Izvestia Akademii
Nauk SSSR, Otdelenie Matematicheskikh i Estestven-
nykh Nauk, 7(6):793–800.
Dudek, G., Jenkin, M., Milios, E., and Wilkes, D. (1997).
Map validation and robot self-location in a graph-like
world. Robotics and Autonomous Systems, 22(2):159–
178. Elsevier, Ltd.
Elfes, A. (1989). Using occupancy grids for mobile robot
perception and navigation. Computer, 22(6):46–57.
Fazli, P., Davoodi, A., Pasquier, P., and Mackworth, A.
(2010). Fault-tolerant multi-robot area coverage with
limited visibility. In 2010 IEEE Int. Conf. on Robotics
and Automation (ICRA’10), Anchorage, Alaska, USA.
Ferreira, F., Davim, L., Rocha, R., Dias, J., and Santos, V.
(2007). Presenting a technique for registering images
and range data using a topological representation of a
path within an environment. J. of Automation, Mobile
Robotics & Intelligent Systems, 1(3):47–55.
Katsilieris, F., Lindh
´
e, M., Dimarogonas, D.,
¨
Ogren, P., and
Johansson, K. (2010). Demonstration of multi-robot
search and secure. In Int. Conf. on Robotics and Au-
tomation (ICRA’10), Anchorage, Alaska, USA.
Ko, B., Song, J., and Lee, S. (2004). Realtime building
of thinning-based topological map. In lnt. Conf. on
Intelligent Robots and Systems, Sandal, Japan.
Kolling, A. and Carpin, S. (2008). Extracting surveil-
lance graphs from robot maps. In IEEE/RSJ Interna-
tional Conference on Intelligent Robots and Systems
(IROS’08), pages 2323–2328, Nice, France.
Lozano-P
´
erez, T. and Wesley, M. (1979). An algorithm for
planning collision-free paths among polyhedral obsta-
cles. Communications of the ACM, 22(10):560–570.
Machado, A. (2002). Patrulha multiagente: Uma an
´
alise
emp
´
ırica e sistem
´
atica. Master’s thesis, Centro de
Inform
´
atica, Universidade Federal de Pernambuco
(UFPE), Recife, Brasil.
Portugal, D. and Rocha, R. (2010). Msp algorithm: Multi-
robot patrolling based on territory allocation using
balanced graph partitioning. In 25th ACM Sympo-
sium on Applied Computing (SAC’2010), pages 1271–
1276, Sierre, Switzerland.
Reinhard, D. (2010). Graph Theory. Springer-Verlag Hei-
delberg, New York, electronic edition.
Szab
´
o, R. (2004). Topological navigation of simulated
robots using occupancy grid. Int. J. of Advanced
Robotic Systems, 1(3):201–206.
Thrun, S. (1998). Learning maps for indoor mobile robot
navigation. Artificial Intelligence, 99:21–71. Elsevier
Science Ltd.
Thrun, S., Bugard, W., and Fox, D. (2000). A real-time al-
gorithm for mobile robot mapping with applications to
multi-robot and 3d mapping. In Int. Conf. on Robotics
and Automation, pages 321–328, San Francisco.
Voronoi, G. (1908). Nouvelles applications des param
`
etres
continus
`
a la th
´
eorie des formes quadratiques. Journal
f
¨
ur die Reine und Angewandte Mathematik, 134:198–
287.
Wallgr
¨
un, J. (2004). Hierarchical voronoi-based route graph
representations for planning, spatial reasoning, and
communication. In 4th Int. Cognitive Robotics Work-
shop (CogRob-2004), pages 64–69.
Zimmer, U., Fischer, C., and Puttkamer, E. V. (1994). Nav-
igation on topologic feature-maps. In 3rd Interna-
tional Conference on Fuzzy Logic, Neural Nets and
Soft Computing, pages 131–132, Fukuoka, Japan.
EXTRACTING TOPOLOGICAL INFORMATION FROM GRID MAPS FOR ROBOT NAVIGATION
143
