
Intelligent Decision Support using Pattern Matching
Victoria J. Hodge, Tom Jackson and Jim Austin
Department of Computer Science, University of York, U.K.
Abstract. The aim of our work is to develop Intelligent Decision Support (IDS)
tools and techniques to convert traffic data into intelligence to assist network
managers, operators and to aid the travelling public. The IDS system detects
traffic problems, identifies the likely cause and recommends suitable
interventions which are most likely to mitigate congestion of that traffic
problem. In this paper, we propose to extend the existing tools to include
dynamic hierarchical and distributed processing; algorithm optimisation using
natural computation techniques; and, using a meta-learner to short-circuit the
optimisation by learning the best settings for specific data set characteristics and
using these settings to initialise the GA.
1 Introduction
Intelligent Decision Support (IDS) systems are an important computerised tool in
many problem domains. The aim of our work is to provide an IDS tool to assist traffic
network operators to optimally manage traffic. Within the FREEFLOW transport
project (http://www.freeflowuk.net/), we have developed a pattern matching tool for
Intelligent Decision Support [1, 2, 3, 4, 5]. The tool is able to:
• detect traffic problems,
• identify likely causes,
• recommend suitable control interventions,
• predict future traffic flows.
The pattern matching tool implements the k-nearest neighbour data mining
algorithm [6, 7]. It uses the Advanced Uncertain Reasoning Architecture (AURA) for
pattern matching [8, 9] to find the nearest neighbours. AURA is based on binary
associative neural networks and can store large amounts of data and allows fast
searches [8, 9, 10]. The AURA pattern matching tool employs a unified framework
for both intervention recommendation and traffic state prediction. The only variation
lies in how the matches are post-processed. It can fuse data from various traffic
sources such as sensors embedded in the road, journey times, queue lengths, weather,
time of day, etc. It can identify the cause of traffic problems by matching and cross-
referencing historical data and use the results to make recommendations to traffic
network managers [1, 3, 4, 5]. The AURA pattern matching tool can also predict
traffic variable values to plug gaps in the data [2]. It can predict values to overcome a
sensor failure or to look ahead and anticipate congestion problems, for example. We
Jackson T., Austin J. and Hodge V. (2011).
Intelligent Decision Support using Pattern Matching.
In Proceedings of the 1st International Workshop on Future Internet Applications for Traffic Surveillance and Management, pages 44-54
DOI: 10.5220/0004473000440054
Copyright
c
SciTePress

call the AURA pattern matching tool that implements the k-nearest neighbour
algorithm AURA k-NN. A brief description of how we implement AURA k-NN for
both intervention recommendation and traffic state prediction is given next. For a
more detailed description see [1, 2, 3, 4, 5, 8, 9].
2 AURA Pattern Matcher
The foundation of AURA is the Correlation Matrix Memory (CMM). A CMM is a
binary matrix used to store and retrieve binary vectors. All matrix elements are
initialised to zero as in equation (1).
0
0
=
CMM (1)
AURA k-nearest neighbour (AURA k-NN) is an implementation of the k-nearest
neighbour (k-NN) [6, 7] classification or prediction method [1, 2, 3, 4, 5, 9, 11] using
AURA. K-NN is a widely used data-mining algorithm that uses similar procedures for
clustering [12], outlier detection [13, 14], classification and prediction by examining
the distances to the nearest neighbours. In the AURA implementation of k-NN, each
column of the CMM is a tuple or record (set of traffic variable observations) and each
row indexes a variable value. For traffic data, each column represents a date/time
record of traffic variable observations. The variable observations can encompass
sensor readings, weather data, journey times, queue lengths etc. In one column, the set
of all rows represents all values for all variables for that date/time record.
Training. In AURA in general [15] and in the AURA k-NN implementation, the
CMM is trained by learning associations between a binary input vector I
n
which
indexes matrix rows and a binary output vector O
n
which indexes matrix columns as
shown by equation (2) and Fig. 1.
T
kkkk
OICMMCMM •⊕=
−1
(2)
The data are quantised and binned prior to training allowing numeric data to map onto
the binary input vectors required for CMM training. Each row of the CMM represents
a bin (range of variable values). Thus, an input vector representing the quantised
variable values for a record is associated with an output vector uniquely identifying
that record for all N records in the data set.
Recall. Recall involves identifying the best matching patterns stored in the CMM (the
best matching columns). The recall procedure varies across AURA implementations
[15]. In AURA k-NN recall, the query vector Q is a weighted (positive integer) vector
that activates rows in the CMM with integer-valued scores. To emulate Euclidean
distance, AURA k-NN applies parabolic kernels to the query vector [1, 2, 3, 4, 5, 8].
There is one kernel per variable and each kernel is centred on the value of that
variable in the query. The kernel scores represent distance. The score is at a maximum
at the query variable value and decrease with bin distance from the query value. To
retrieve the k nearest neighbours, AURA effectively calculates the dot product of the
integer-valued query vector Q and the CMM as in equation (3).
45
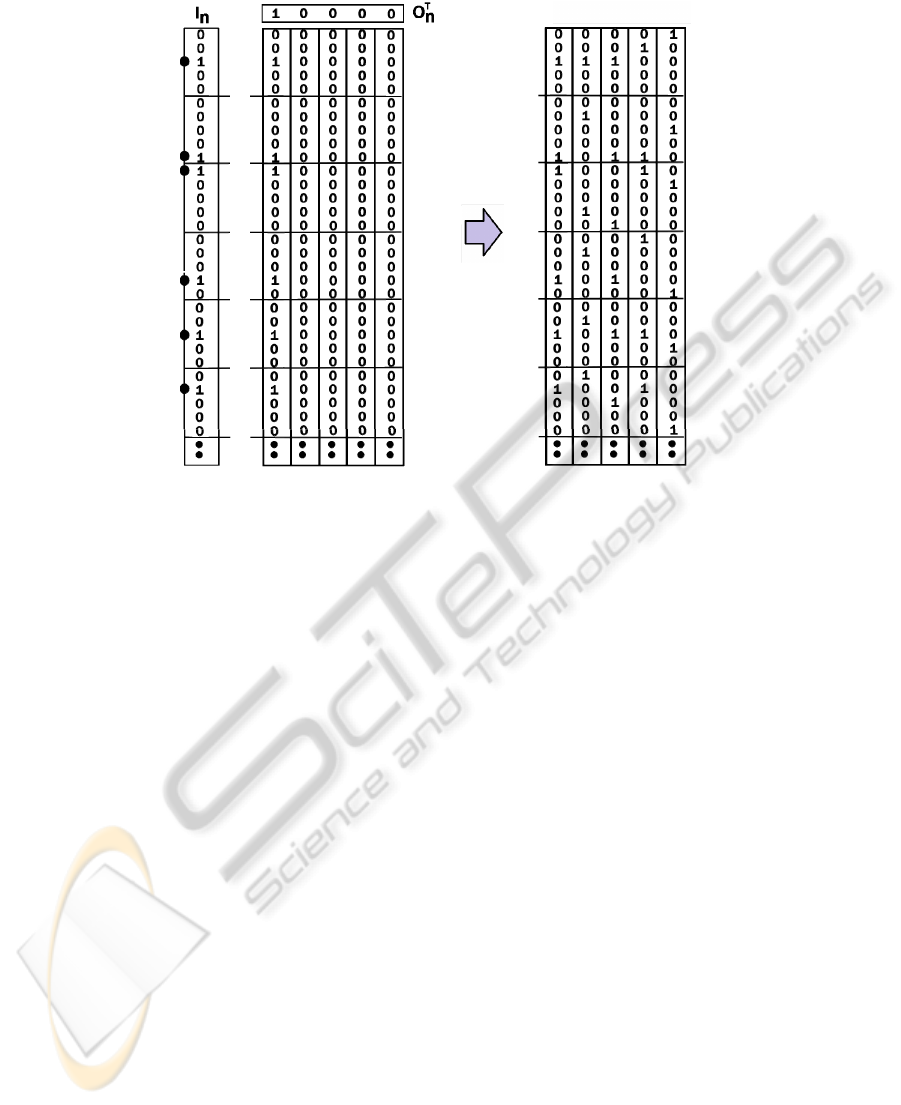
Fig. 1. Showing the CMM storing the first association I
0
×O
0
on the left and a CMM trained
with five associations on the right.
∑
•= QCMMS
T
(3)
The columns of the matrix are summed according to the value on the rows
indexed by the integer-valued query vector
Q producing a positive integer-valued
output vector S (the summed output vector). This output vector S is thresholded by
selecting the
k columns in S with the highest scores. Thresholding produces a binary
thresholded vector (T) with a bit set in each of the k highest scoring columns. Thus,
after thresholding, T effectively lists the top k matching columns from the CMM thus
identifying the top
k matching records. These k nearest neighbours can then be used to
provide a traffic intervention recommendation [1, 3, 4, 5] or to produce a traffic state
prediction [2].
Results. The AURA k-NN has been applied to real-time intelligent transport
monitoring [1, 2, 3, 4, 5]. For both recommendation and prediction, the AURA k-NN
identifies similar historical traffic patterns: time periods in the past when the traffic
state, as represented by a set of traffic sensor readings, is as close to the current state
as possible. The only variation between recommendation and prediction lies in
processing these matches. For recommendation, the set of traffic control interventions
implemented during these similar historical time periods are cross-referenced from
the historical data and recommended to the traffic operator for implementation, [1, 3,
4, 5]. For prediction, AURA k-NN extrapolates and produces a prediction of the
future traffic value by averaging the variable value across the set of matches [2].
Results include tests of the AURA k-NN for recommendation performed using data
from Hyde Park Corner (HPC) in London, UK [3]. There are 32 traffic sensors in the
46
HPC area with five serious or severe congestion events during the data recording
period. We compared the state (congested/uncongested) of the top 5 matches selected
by AURA k-NN against the recorded (actual) state for each sensor for each
congestion event giving 800 sensor comparisons. AURA k-NN produced only 43
errors from the 800 sensor comparisons.
2.1 Hierarchical
We propose extending this AURA k-NN framework to a hierarchical distributed
approach for intervention recommendation across large-scale networks.
A hierarchical processing approach allows the geographical location under
consideration to be varied according to the spread of the traffic problem. The location
could vary from a single junction up to a large city area as appropriate. We will fuse
traffic and other relevant data from multiple locations, detect the spread of congestion
at regular intervals and search for similar historical incidents with similar spreads of
congestion, i.e. at a similar level in the hierarchy. Thus, the location and spread can
vary dynamically at each time interval as the congestion spreads or contracts. AURA
permits partial matching so historical incidents that are most similar with respect to
both the incident features and the geographical spread will be found. The process is
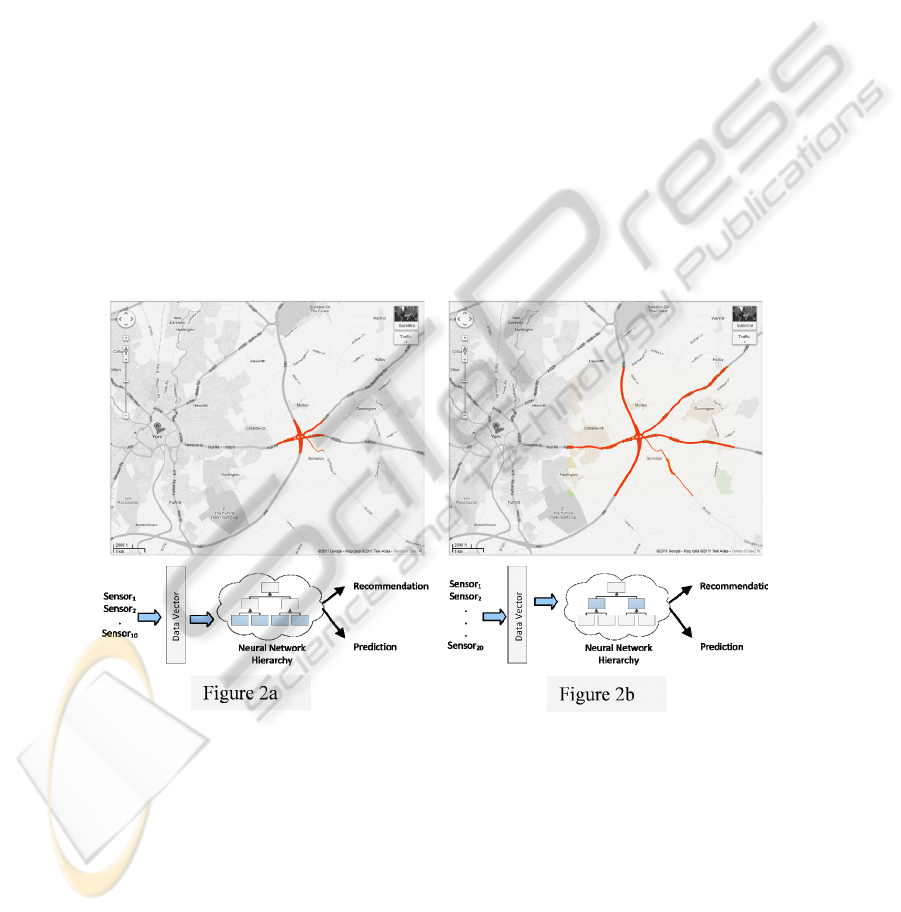
illustrated conceptually in Fig. 2.
Fig. 2. In figure 2a, congestion is detected over a small area (10 sensors) and the neural
network is used for recommendation and prediction against the data vector for the 10 sensors.
In figure 2b, the congestion has spread to cover 20 sensors so the data vector for the 10 sensors
expands to cover 20 sensors.
We can achieve a hierarchical representation using CMM row masking. Masking
varies the number of variables to query. Thus, for a CMM storing data for forty
sensors, to query sensors 1-10 we only examine the CMM rows that relate to those ten
47

sensors and “mask off” all other rows, i.e., we do not activate those other rows. To
query sensors 1-40, we examine all CMM rows (four times as many rows). This
allows a simple, efficient “hierarchical” representation with no data repetition.
Masking means that the number of sensors to query can be varied dynamically
according to the geographical spread of congestion on the road network. Only sensors
within the region of congestion need to be queried. The partial match capability of
AURA allows the AURA k-NN to find the best match with respect to both the
variables (sensor readings, weather etc.) and the geographical spread of the
congestion.
The levels in the hierarchy represent different sized geographical locations and
store data for different numbers of traffic sensors. The levels may represent just a few
sensors at the bottom of the hierarchy but the levels at the top of the hierarchy may
represent large geographical areas covering, potentially, thousands of sensors. Storing
and processing data for large numbers of sensors requires careful consideration with
respect to memory usage and processing speed. Storing data for more sensors
increases the size of the CMM in the AURA k-NN which increases memory usage
and slows processing [8]. However, the hierarchical processing approach described
above lends itself to distributed processing. This could be processing the traffic data
at the same geographical location across multiple compute nodes (parallel search) or
even processing the traffic data at multiple geographical locations and assimilating the
results (distributed processing). When the number of sensors is large but the sensor
data is stored in one location then parallel searching is preferable, for example, sensor
data for all traffic sensors of one local government authority area stored at one site.
Where the number of traffic sensors is large and the data is physically spread across
geographical locations such as traffic sensors covering multiple local authority areas
where each authority stores data for its own sensors then distributed searching across
the multiple sites is preferable.
Parallel. In [16], we demonstrated a parallel search implementation of AURA. This
entails “striping” the data across several parallel CMM subsections. The CMM is
effectively subdivided vertically across the output vector as shown in Fig. 3. In the
traffic data, the number of variables
m (sensor readings, journey times, weather data
etc.) is much less than the number of records N (date/time records). Hence, m << N.
Therefore, we subdivide the data along the number of records
N (column stripes) as
shown in Fig. 3.
Splitting the data across multiple CMMs using the date/time dimension (columns)
means that the CMM can store data for all sensors, journey times, and weather data as
separate rows within a single stripe. Each date/time is a separate record all contained
within a single stripe.
Each separate CMM stripe (each separate date/time section) outputs a thresholded
vector containing the top
k records from that CMM stripe and their respective scores.
All top k matches from all CMM stripes are aggregated and the top k matches overall
can then be identified by finding the
k matches with the overall highest scores.
Note: if the number of variables is large (for a large city area there may be a high
number of sensors and other data) then it is possible to subdivide the data across
multiple CMMs. The CMM is divided by the data/time of the records (column stripes)
and then the column stripes are subdivided by the input variables (row stripes).
48
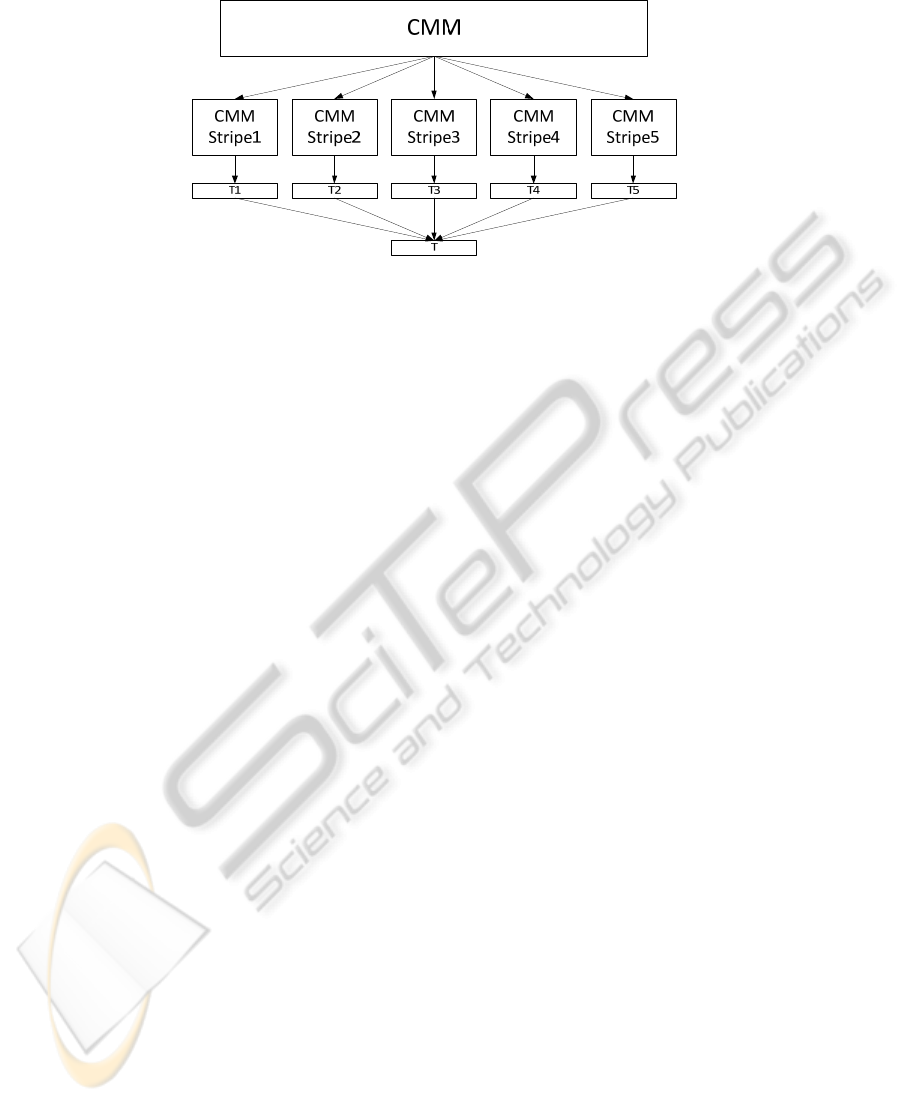
Fig. 3. The CMM covers a large time period so, to speed processing, the CMM is subdivided
(striped) across a number of CMM stripes. Each CMM stripe produces a thresholded output
vector T
n
containing the top k matches (and their respective scores) for that stripe. All T
n
are
aggregated to form a single thresholded output vector T that lists the top k matches overall.
Dividing the CMM using the variables (row stripes) makes assimilating the results
more complex. Each row stripe produces a summed output vector containing column
subtotals for those variables within the stripe. The column subtotals need to be
assimilated from all row stripes that hold data for that column. Thus, we sum these
column subtotals to produce a column stripe vector
C holding the overall sum for
each column in that stripe and find the k top scoring columns as previously. Row
striping involves assimilating integer vectors of length
c where c is the number of
columns for the column subdivision (column stripe).
Distributed. A distributed approach for AURA search has been proven in the context
of condition monitoring for civil aerospace [17]. We wish to extend the principles
developed in that domain and apply to them to the challenges of city or region wide
monitoring of traffic patterns. There are two central challenges; maintaining a
distributed data archive such that sensing and traffic data does not have to be moved
to a central repository and secondly, orchestrating the search process across the
distributed data. The distributed data issue can be addressed with existing software
solutions, such as Hadoop and Storage Request Broker [18, 19].
To address the requirements for orchestrated search we have developed a grid
solution that relies on a middleware stack for farming search queries across the
distributed data resources. This component is termed the Pattern Match Controller
(PMC). It provides a mechanism by which a front-end grid/web service client with an
IDS system can submit queries to all of the known data resources in a parallel,
asynchronous manner, and to manage the processing and analysis of the data at the
remote repositories. Enforcing the pattern matching process to take place at the
remote data repositories removes the costly requirement to shift large volumes of data
during the search. The PMC builds on the Storage Request Broker (SRB) service to
permit the virtualization of data repositories and data assets. This combination of
technologies provides a scalable, high-volume, solution for pattern matching in
complex signal processing and diagnostic domains. These methods are able to operate
on Terabytes of data and hence are potentially scalable to wide regional traffic
monitoring. We wish to extend this architecture to incorporate the requirements of
49
IDS for transport management, particularly the addressing the issues of impact
analysis on changing traffic conditions in one area of a city, and investigating the
consequences that may extend to other regions. We also wish to explore how the
system can integrate traffic information from diverse sources, for example
Government as well as regional traffic authorities, weather stations, smart sat-
navigation systems and satellite information. There are many challenges with
optimising the search process in highly distributed systems of this nature, and these
issues are addressed in the following section.
3 Optimisation
One particular research focus is the area of pattern match optimisation. As with most
machine-learning algorithms, AURA k-NN has parameters that need to be optimised
to ensure highest accuracy. Optimisation is a combinatorial problem and traffic is
dynamic over time so the AURA system needs re-optimising periodically to model
the new data and keep the AURA memory up-to-date.
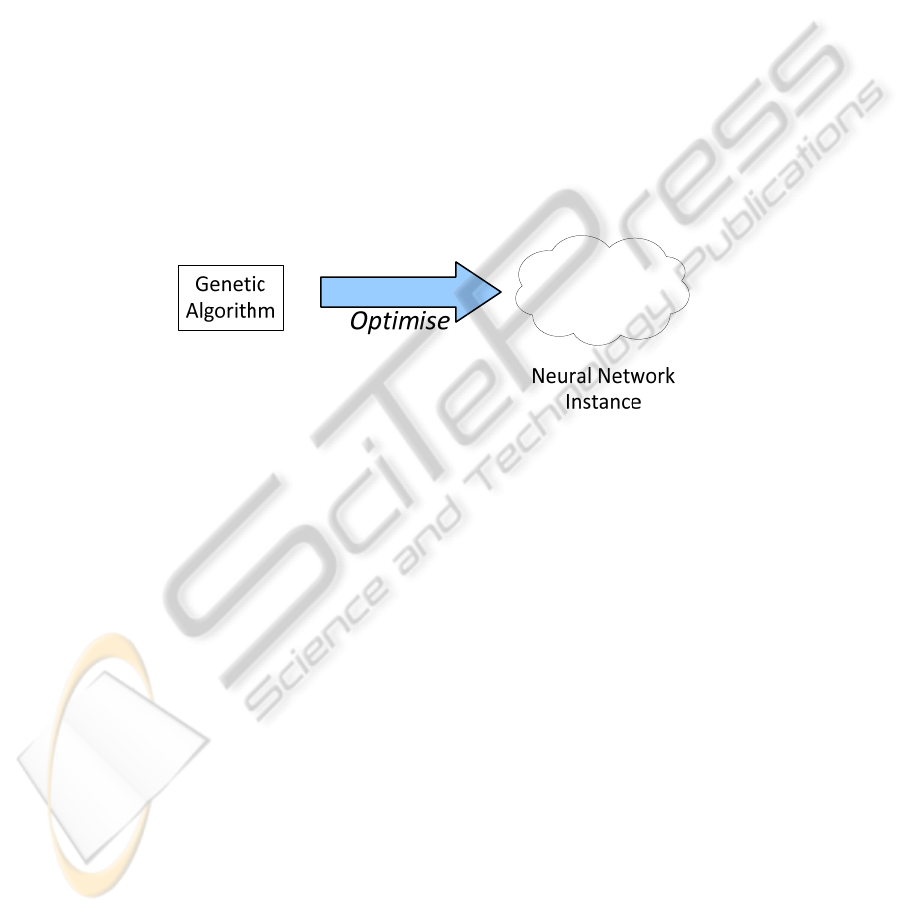
Fig. 4. The neural network parameter settings are optimised using a genetic algorithm.
We propose optimising a single node AURA system using, for example, genetic
algorithms (GAs) or particle swarm optimisation (PSO) which have been used widely
in the literature for this problem. In the following, we discuss using a genetic
algorithm for optimisation as an example as shown in Fig. 4.
3.1 Optimisation using a GA
Genetic algorithms [20, 21] are inspired by Darwin's theory of evolution. In a GA, a
chromosome represents a solution for the problem and chromosomes are selected
according to their fitness; chromosomes with higher fitness stand a better chance of
being selected. New chromosomes are produced using the genetic operators: cross-
over and mutation. Generating the population of chromosomes involves the following
stages.
1. Produce a random population of
n chromosomes
2. Compute the fitness (score) for each chromosome, c, using a fitness function f(c).
3. Repeat until the stopping criterion is met and the population is complete:
• Select chromosomes from a population according to their fitness
50
• Apply cross-over to the selected chromosomes to create new chromosomes
• Apply mutate to the new chromosomes at each locus (position in chromosome)
• Compute the fitness of each new chromosome
• Update the population by replacing old chromosomes with the new
chromosomes
The fundamental task in GAs is mapping the function to be optimised on to the
chromosome. We propose using a binary valued chromosome where each gene
encodes a parameter value of the AURA k-NN. This requires
log
2
(r) bits per
component where r represents the range of the values to optimise over and the log
2
value is rounded up to the nearest integer. For example, to optimise the k value for k-
NN across a range of values 5 ≤
k ≤ 50 has a range of 45 then log
2
(45) → 6. Hence,
optimising k requires a gene of 6 bits and the k values are encoded into their binary
equivalents using 6 bits. This is illustrated in Fig. 5.
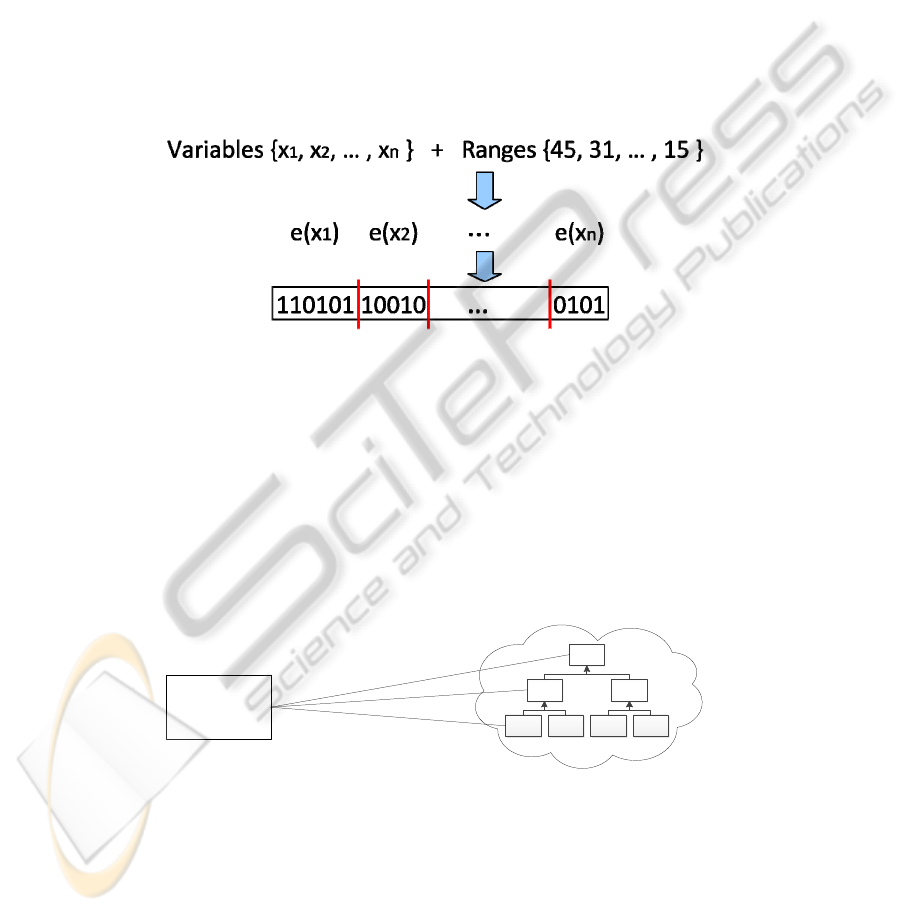
Fig. 5. Diagram demonstrating how the variables (parameter settings) are encoded in a GA
chromosome. The range of value determines the number of bits in the gene. Here, variable x
1
has range 45 and uses 6 bits; variable x
2
has range 31 and uses 5 bits.
Each cycle of the GA generates a new chromosome that contains the parameter
values to use for the AURA k-NN on that iteration. Running AURA k-NN with those
parameter values produces a fitness score. This fitness score is either the recall
accuracy for classification or the prediction accuracy for variable prediction. A high
score reflects a set of parameters that work well. The chromosome is associated with
that score and forms part of the chromosome population. Low scoring chromosomes
“die” and are removed from the population. This process is repeated until the stopping
criterion is met.
Fig. 6. The parameter settings for each separate CMM in the hierarchy are optimised using a
genetic algorithm.
Neural Network
Hierarchy
Genetic
Algorithm
Optimise
51
We then propose expanding this optimisation to the hierarchical representation so
an identical GA optimisation process would run against each node in the hierarchy as
shown in Fig. 6. In the hierarchy, each AURA k-NN is processing a different portion
of the overall data set, from small regional areas to large geographical areas. These
different data portions are likely to require different algorithm and data settings.
Hence, a GA needs to be run against each AURA k-NN within the hierarchy to
optimise its algorithm and data parameters.
3.2 AURA Meta-learner
GAs are easily parallelisable and do not get stuck in local minima. However, they are
computationally expensive. The optimisation process needs to be rerun periodically to
accommodate new data into an existing historical database or, if the road layout
changes, then the appropriate database needs to be remodelled etc. Hence, we finally
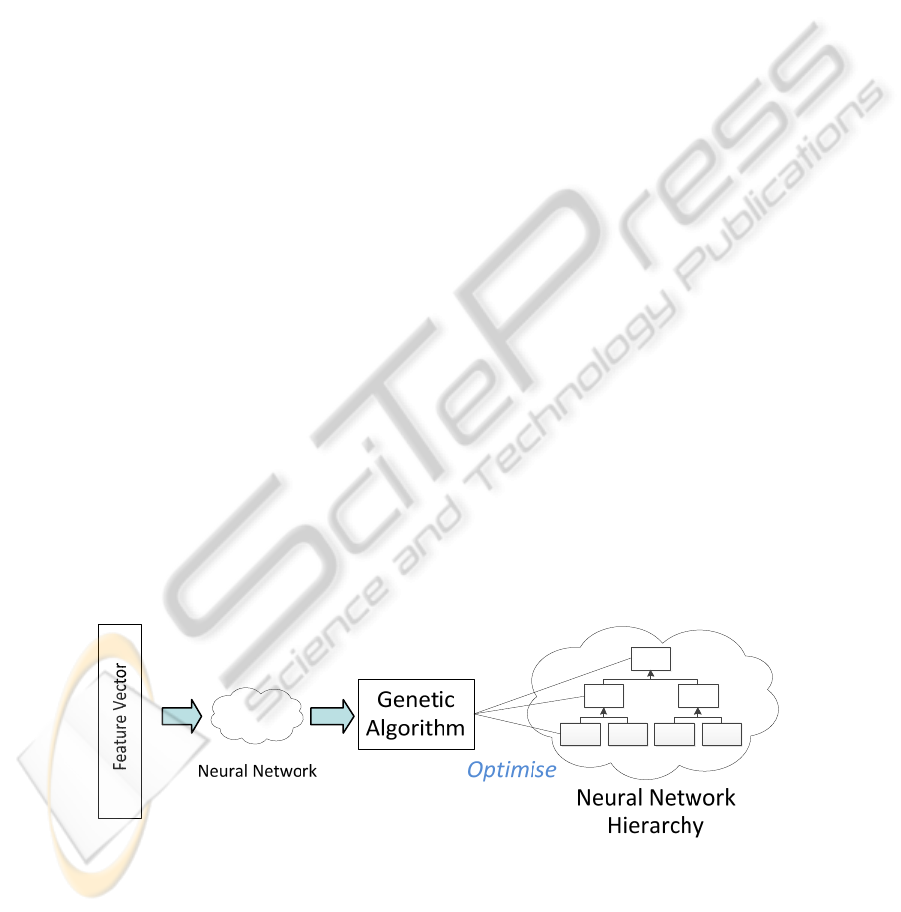
propose a k-NN-based meta-learner as shown in Fig. 7.
Authors have considered using a k-NN based meta-learner for selecting datasets
that are similar to the current data set. Learning algorithms that performed best on the
most similar previous dataset can then be selected for use for the current data set [22].
Our approach will use an instance of the AURA k-NN to store the results of the
optimisations run previously and learn the best data and parameter settings for the
AURA k-NN that were used to process previous data sets. These best settings may
then be used to bootstrap future optimisations and short-circuit the optimisation
process which is a combinatorial problem and, hence, computationally intensive. The
AURA k-NN distance function to calculate data set similarity will be based on the
features of the dataset such as the data types (integer-valued, real-valued or
symbolic), the data ranges or the data set size (number of variables or number of
records). Matching the features of the new data set against the features of the stored
data sets using AURA k-NN will elicit the most similar data sets (neighbours). The
AURA k-NN can then cross-reference the parameter settings used to process the most
similar dataset(s) (nearest neighbours), that is, the best settings to use to initialise the
GA for optimising the current dataset. These AURA k-NN parameter settings can
then be used to initialise the GA, i.e., produce an initial set of chromosomes and,
hopefully, reduce the search space of the GA through focused initialisation of the GA
chromosomes.
Fig. 7. A neural network can function as a meta-learner to retrieve the best initialisation settings
for the GA using characteristics (features) of the data set.
52

4 Conclusions
The paper describes an Intelligent Decision Support tool for pattern matching aimed
at data processing, optimisation, recommendation and prediction. The tool is based on
a binary neural implementation of the k-nearest neighbour algorithm, AURA k-NN.
AURA k-NN is fast and scalable. It can vary the region of interest dynamically,
process data in parallel by subdividing processing using the time dimension and
process data across a number of sites using distributed processing. We propose using
a genetic algorithm (or similar) to optimise the algorithm and data settings for the
pattern matcher. Additionally, the pattern matcher itself can be used to store
initialisation settings for the genetic algorithm thus short-circuiting the optimisation
process of the genetic algorithm which is computationally intensive. The pattern
matcher stores characteristics of the data sets as feature vectors and matches the
characteristics of the new data set against the stored data sets to find the most similar
stored data set. The optimisation settings that were used for this stored data set can
then be used to initialise the genetic algorithm for optimising the new data set.
References
1. Hodge, V., Krishnan, R., Austin, J. and Polak, J. (2010). A computationally efficient
method for online identification of traffic incidents and network equipment failures.
Presented at, Transport Science and Technology Congress: TRANSTEC 2010, Delhi, Apr.
4-7, 2010.
2. Hodge, V., Krishnan, R., Jackson, T., Austin, J. and Polak, J. (2011). Short-Term Traffic
Prediction Using a Binary Neural Network. Presented at, 43rd Annual UTSG Conference,
Open University, Milton Keynes, UK, Jan. 5-7, 2011.
3. Krishnan, R., Hodge, V., Austin, J. and Polak, J. (2010a). A Computationally Efficient
Method for Online Identification of Traffic Control Intervention Measures. Presented at,
42nd Annual UTSG Conference, University of Plymouth, UK: Jan. 5-7, 2010.
4. Krishnan, R., Hodge, V., Austin, J., Polak, J. and Lee, T-C. (2010b). On Identifying Spatial
Traffic Patterns using Advanced Pattern Matching Techniques. In, Proceedings of
Transportation Research Board (TRB) 89th Annual Meeting, Washington, D.C., Jan. 10-14,
2010. (DVD-ROM: Compendium of Papers).
5. Krishnan, R., Hodge, V., Austin, J., Polak, J., Jackson, T., Smith, M. and Lee, T-C.
(2010c). Decision Support for Traffic Management. In, Proceedings of 17th ITS World
Congress: (CD-ROM), Busan: Korea, Oct. 25-29, 2010.
6. Cover, T. M. and Hart, P. E. (1967). Nearest neighbor pattern classification. IEEE Trans.
Inform. Theory, 13(1):21–27.
7. Fix, E. and Hodges, J. L. (1951). Discriminatory analysis, nonparametric discrimination:
Consistency properties. Technical Report 4, USAF School of Aviation Medicine, Randolph
Field, Texas.
8. Hodge, V. and Austin, J. (2005). A Binary Neural k-Nearest Neighbour Technique.
Knowledge and Information Systems, 8(3): pp. 276-292, Springer-Verlag London Ltd,
2005.
9. Hodge, V., Lees, K. and Austin, J. (2004). A High Performance k-NN Approach Using
Binary Neural Networks. Neural Networks, 17(3): pp. 441-458, Elsevier Science, 2004.
10. Hodge, V. and Austin, J. (2001). An Evaluation of Standard Retrieval Algorithms and a
Binary Neural Approach. Neural Networks, 14(3): pp. 287-303, Elsevier Science.
53

11. Weeks, M., Hodge, V., O’Keefe, S., Austin, J. and Lees, K. (2003). Improved AURA k-
Nearest Neighbour Approach. In, Proceedings of IWANN-2003, Mahon, Spain. June 3-6,
2003. Lecture Notes in Computer Science (LNCS) 2687, Springer Verlag, Berlin.
12. Bubeck, S. and von Luxburg, U. (2009). Nearest Neighbor Clustering: A Baseline Method
for Consistent Clustering with Arbitrary Objective Functions. Journal of Machine Learning
Research, 10(10): 657-698.
13. Hodge, V. and Austin, J. (2004). A Survey of Outlier Detection Methodologies. Artificial
Intelligence Review, 22: pp. 85-126, Kluwer Academic Publishers.
14. Hodge, V. (2011). Outlier and Anomaly Detection: A Survey of Outlier and Anomaly
Detection Methods. Lambert Academic Publishing (LAP), ISBN-13: 978-3846548226
15. AURA -- Advanced Computer Architectures Group web page (accessed 15/12/11) http://
www.cs.york.ac.uk/arch/neural-networks/technologies/aura
16. Weeks, M., Hodge, V. and Austin, J. (2002). A Hardware Accelerated Novel IR System. In,
Proceedings of the 10th Euromicro Workshop (PDP-2002), Las Palmas de Gran Canaria,
Canary Islands, Jan. 9–11, 2002. IEEE Computer Society, CA.
17. Austin, J., Davis, R., Fletcher, M., Jackson, T., Jessop, M., Liang, B. and Pasley, A. (2005).
DAME: Searching Large Data Sets within a Grid-Enabled Engineering Application.
Proceedings IEEE - Special Issue on Grid Computing, 93(3): 496-509, ISBN 0018-9219
18. Shvachko, K., Hairong K., Radia, S. and Chansler, R. (2010). The Hadoop Distributed File
Store System. In, Proceedings of 2010 IEEE 26
th
Symposium on Mass Storage Systems and
Technologies (MSST), 28 June 2010.
19. SDSC Storage Request Broker [Online] (accessed 15/12/11). Available: http://
www.sdsc.edu/srb/index.php/Main_Page
20. Goldberg, D.E. (1989). Genetic Algorithms in Search, Optimization and Machine Learning
Addison-Wesley Pub. Co. ISBN: 0201157675
21. Holland, J.H. (1975). Adaptation in natural and artificial systems: An introductory analysis
with applications to biology, control, and artificial intelligence, University of Michigan
Press.
22. Brazdil, P. B., Soares, C. and Da Costa, J.P. (2003). Ranking Learning Algorithms: Using
IBL and Meta-Learning on Accuracy and Time Results. Machine Learning, 50(3): 251-277.
54
