
STATISTICAL EDUCATION AT THE UNIVERSITY OF NATURAL
RESOURCES AND LIFE SCIENCES IN VIENNA
Karl Moder
Institute for Statistics and Computing, University of Natural Resources and Life Sciences
Gregor Mendelstrasse 33, A-1180 Vienna, Austria
Keywords:
Assessing student learning, Online programme, Large class size.
Abstract:
Introductory statistics courses at the University of Natural Resources and Life Sciences in Vienna suffer from a
very high number of participants. Correcting written tests is almost impossible because of a lack of personnel
resources. As an alternative an online programme has been developed. It considerably reduces the time
required by instructors and it seems to intensify the cooperation among students.
1 INTRODUCTION
At the University of Natural Resources and Life Sci-
ences in Vienna the number of newly enrolled stu-
dents increased from 696 to 2584 within the last 9
years. About 20% out of these 2584 students are non
Austrian citizens. The ratio of male to female students
changed within this time period from 1.11 to 1.01.
During the winter semester 2010/2011 and depending
on their branch of study 1534 out of 2584 students
had to attend an introductory statistics course which
was supervised by the scientific staff of the statistical
institute.
The following table shows the branches of study
and the corresponding number of students.
Table 1: Branches of study and corresponding number of
attending students in 2010/2011.
number of
branch of study students
Agricultural Sciences 297
Environment and Bio-Resources
Management
461
Food Science and Biotechnology 374
Landscape Architecture and
Landscape Planning
343
Viticulture, Enology and Wine
Economics
59
1534
At the moment the scientific staff of the statistical
institute consists of 3 people. Because of this small
number of statisticians, students from the first and last
branch of study shown in table 1 are taught together.
Since there are students from higher semesters who
failed this course in previous years, the number of
participants in the courses increased, e.g. in Environ-
ment and Bio-Resources Management to more than
500. Because of the low personal equipment and the
high number of participants of introductory statistics
courses an online-program was developed to reduce
the burden of statistical education for the staff of the
statistic institute.
2 OUTLINE OF STATISTIC
COURSE
The following description of the statistics course is
based on lectures of the author for students of ”Land-
scape Architecture and Landscape Planning”. Stu-
dents attend this course in their first semester of stud-
ies. In 2010 a total of 351 students (60% female, 40%
male) registered to the course. About 25% of all par-
ticipants abandon the course within the first 5 weeks
because they leave university. The drop out rate for
the remaining students is about 7% – 9% and rather
stable over the last 10 years.
Roughly 50% to 60% of students attend the lecture
until the end of the term. There is no obligation to at-
tend the lecture; this flexibility is permitted because
about 50% of students have a job beside their stud-
ies. The lecture takes two hours per week during the
whole semester. Its contents are based partly on books
like (Essl, 1987) or (Rasch et al., 2007). A script can
77
Moder K. (2011).
STATISTICAL EDUCATION AT THE UNIVERSITY OF NATURAL RESOURCES AND LIFE SCIENCES IN VIENNA.
In Proceedings of the Second International Conference on Innovative Developments in ICT, pages 77-81
DOI: 10.5220/0004472000770081
Copyright
c
SciTePress
be downloaded from the ELearn platform of the uni-
versity or can be bought at the institute. In addition to
this script there are several examples, pictures and an-
imations which can be downloaded, too. All lectures
are recorded via lecturnity software and can either be
be watched on the Internet or downloaded.
Until 10 years ago students had to pass 2 written
tests and a final oral exam. Since this was very time
consuming, an online programme was developed for
examination purposes.
This means, at the moment statistical education
consists of three parts:
• Students have to chose 10 online examples and
complete the task presented.
• They have to complete 3 different tasks in SAS.
• Finally they have to pass a written test, consisting
of 2 parts. Part 1 concerns statistical basics. In
part 2, 5 – 6 data sets are provided and students
have to determine which method to use to solve a
certain statistical problem.
As mentioned, this is for students of ”Landscape
Architecture and Landscape Planning”. For other
branches of study the number of online examples is
12, and 4 tasks have to be completed with SPSS or
R. This paper describes a programme which creates
online examples that students can use to practice, to
accomplish the required tasks and receive feedback
until they are ready to take a final test.
2.1 The Online Programme
One prerequisite for the use of this programme is a
computer and an internet connection. Surveys among
students of Landscape Architecture and Landscape
Planning in the last 3 years showed that all of them
had the necessary access. Those who think they might
have problems using a computer can attend a basic IT-
course; in the past, hardly anyone did so. Addition-
ally, a detailed description of SAS, SPSS and R nec-
essary for the exercises, that students have to do by
using those programmes can be downloaded from the
ELearn-platform of the university. All of these pro-
grammes and introductions are located on servers and
can be accessed from home (and are also available for
readers of this article).
To attend the statistic course, students have to en-
roll by name, branch of studies and student ID. These
data are stored in a MySQL database. After enrol-
ment, students are allowed to use the online pro-
gramme. At the moment, the programme offers the
following 14 possibilities.
By modifying a list of indexes in the PHP pro-
gramme the order as well as the number of tasks can
Table 2: Methods offered by the online programme.
descriptive methods
stem & leaf diagram
boxplot
parametric tasks
confidence intervals
sample size determination
one sample t-test
two sample t-test
one way ANOVA
two way ANOVA with interaction
paired t-test
block analysis
regression and correlation
non parametric tasks
contingency tables
Kolmogorov-Smirnov-test
Kruskal-Wallis-test
be changed easily. In a second list the number of
points which students can obtain for each example is
determined. Students may only sit the written exam
if the reach at least 50% of the maximum number of
points obtainable for every example they have dealt
with. 80 to 88 percent of participants archieve more
then 90% of the maximum number of points for each
example. To use the online material students have to
identify the programme and select the exercise they
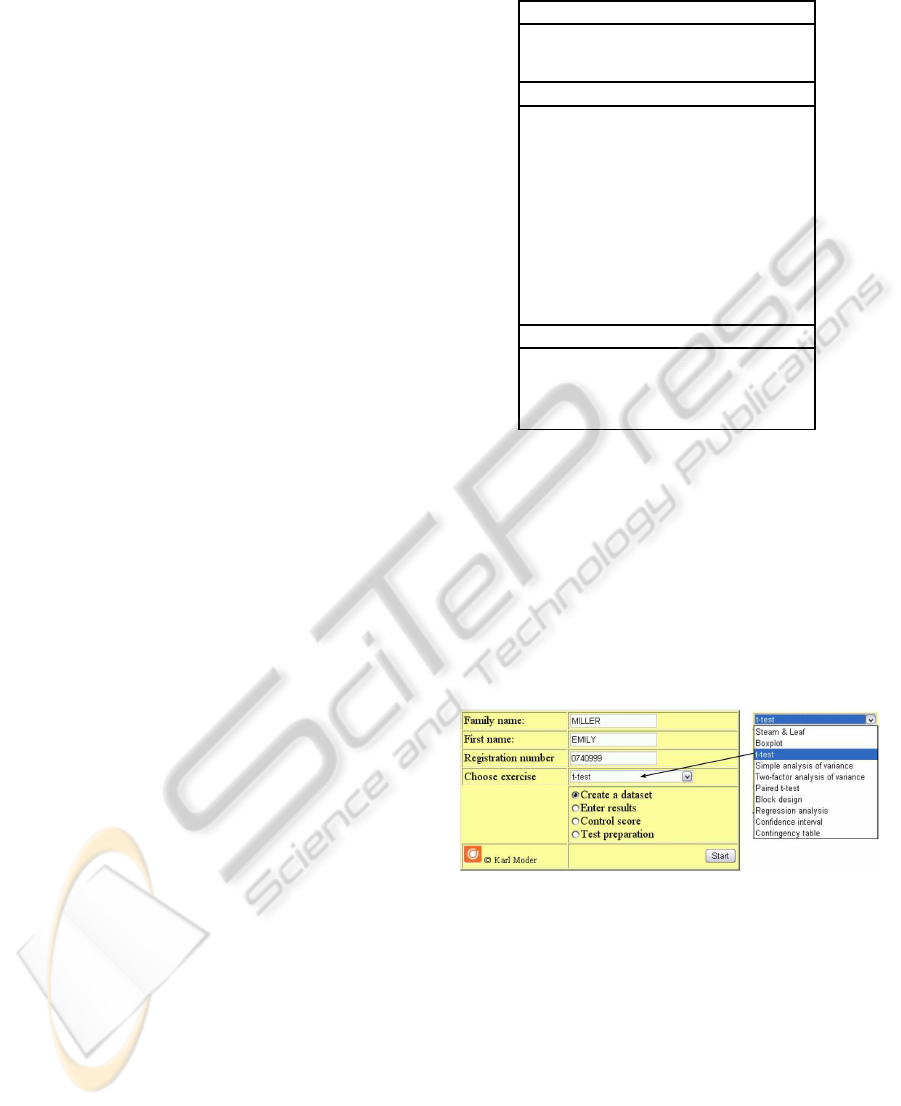
want to deal with (figure 1).
Figure 1: Identification and task selection frame.
After a task has been selected, input parameters
are listed. If ”Create a dataset” is then chosen and as
soon as input is confirmed, each student gets his/here
own data set of his own (figure 2).
These data sets are created rather flexible. For ex-
ample, if one selects t-test, 10 different texts are avail-
able at the moment (in principle, there is no limit to
the number of texts). For the creation of data sets, the
following parameters have to be set to obtain plausi-
ble ”observations”:
1. minimum and maximum number of observations
for the first (e.g. 7 – 11) as well as for the second
INNOV 2011 - Second International Conference on Innovative Developments in ICT
78
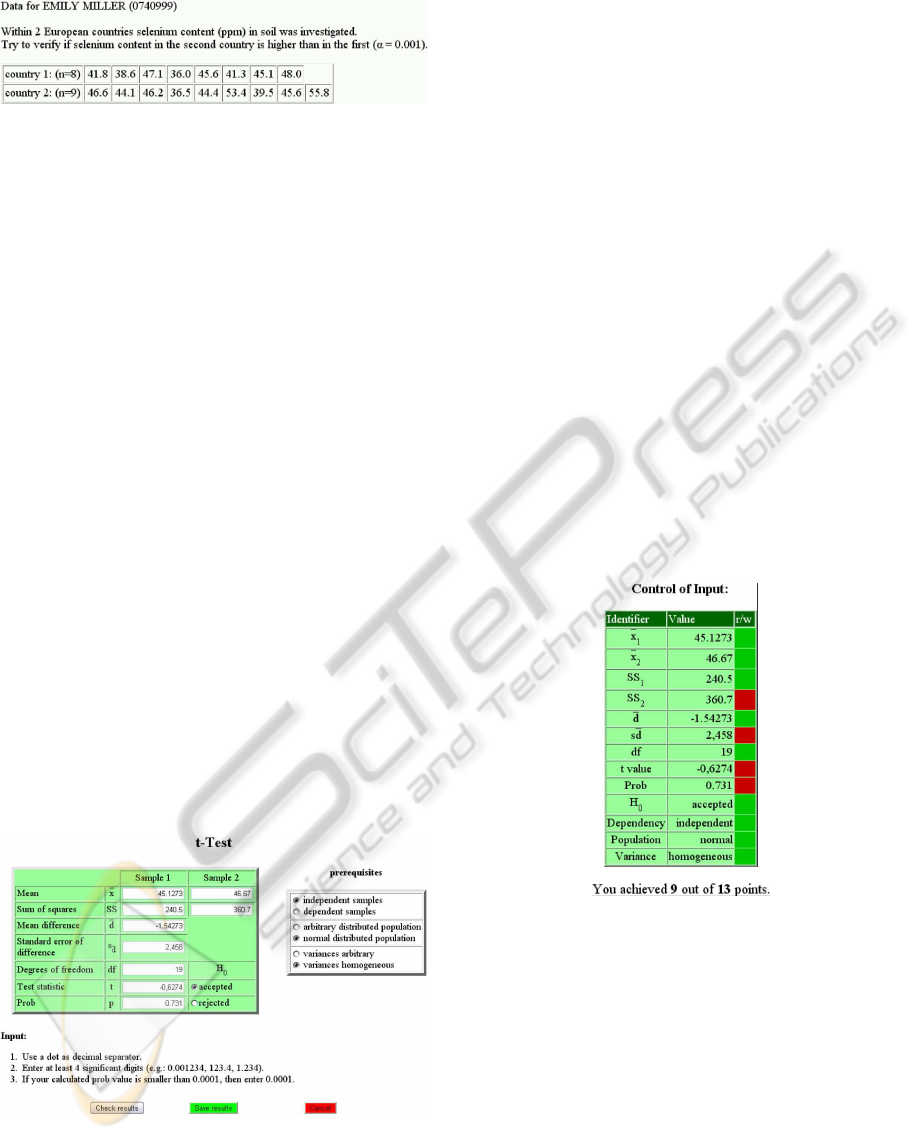
Figure 2: An individual data set for a certain student and
exercise.
sample (e.g. 7 – 11),
2. decimal points for observations (if this value is
set as ”1” all digits following the first digit after
the decimal point are set as”0”, e.g. 27.1 means
27.10000),
3. a distribution for the generation of observations
(normal distribution or uniform distribution are
available at the moment),
4. a range for the observations according to each text
(for the example above that would be 30 to 60).
These data are stored in an external definition file and
can be changed with the help of any text editor. Four
different α values are chosen randomly (0.1, 0.05,
0.01, 0.001) by the programme. For a t-test, a one-
sided or two-sided test situation is chosen at random.
The programme is adjusted in such a way, that about
20% of datasets lead to a significant result (but this is
different for different examples and can be modified
easily).
Within a certain time limit (7 – 14 days) students
have to accomplish their task and enter their results
(figure 3). If one uses a registration number from 1 to
99 there is no time limit for any task, but in that case
results are not considered for grading purposes. Most
of the frames require the input of calculated results as
well as some basic theoretical answers.
Figure 3: Input frame for the results.
Once a student has entered his answers he/she can
check if they are correct by clicking the ”Check re-
sults” button. By doing so, students obtain a table
showing correct and incorrect answers (figure 4). A
green field beside a value indicates a correct result, a
red one an error. As generated data are exact in the
sense that all digits behind the decimal point which
are not shown are 0 (with some limitation to the repre-
sentation by the computer (McCullough, 1998)) there
are only very few problems with rounding errors if
students use a calculator or SAS, SPSS or R, because
the online programme tolerates a deviation from the
exact value of up to 1% (this value is defined in the
PHP programme and can be altered without any prob-
lem). The tolerance value should not be too large;
for example in a one way analysis of variance stu-
dents compute the sum of square value for total (SS
T
)
and for the factor (SS
F
). The sum of square value for
the error term (SS
E
) is calculated as the difference be-
tween these two values. Even if the value for SS
T
is
wrong by less than 1% this can lead to a wrong SS
E
.
In any next step the deviation from the exact value is
possibly bigger than 1% in relation to the size of this
value. So students get confused because SS
T
and SS
F
seem to be correct but the difference (SS
E
) is not.
If students are satisfied with their results, they can
save them. Otherwise they can go back and correct
their input.
Figure 4: Check validity of entered data for a specific ex-
ample.
At each point in time students can get information
about the total score they have so far achieved until
the last input (figure 5).
Within a time window of about 7 to 14 days stu-
dents have to complete a certain task. Figure 6 shows
the percentage share of finished tasks over time for 3
different online examples (block analysis, regression
analysis and contingency tables).
Whenever block design is used, the input has to
be finished within 10 days, for regression analysis and
contingency tables there are 12 days available for in-
STATISTICAL EDUCATION AT THE UNIVERSITY OF NATURAL RESOURCES AND LIFE SCIENCES IN
VIENNA
79
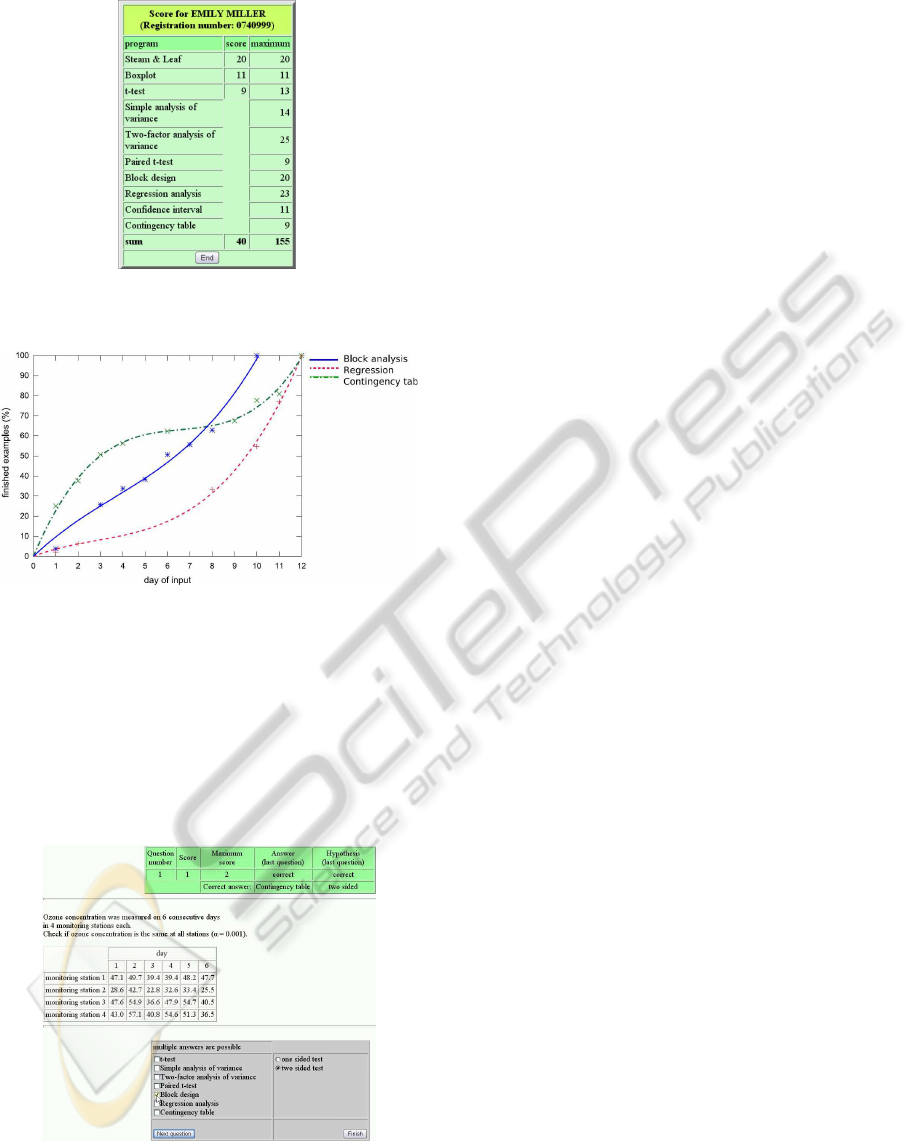
Figure 5: Overall score up to the last input.
Figure 6: Percentage of finished examples over time (day of
input).
put. A regression has to be worked out with SAS.
Maybe this is one reason, why curves in figure 6 dif-
fer that much.
In a final written test students have to identify an
appropriate statistical method to analyse a specific
data set. With the help of the programme they can
enhance their skills to accomplish this (figure 7).
Figure 7: Test preparation programme.
One out of 8 non descriptive statistical methods
(table 2) is randomly selected by the programme and
for this method one out of about 600 data sets is cho-
sen randomly. In some situations (t-test - analysis of
variance, paired t-test - block analysis) multiple an-
swers are possible. Each answer is scored and all
scores are summed up until the last task.
2.2 Realization of the Programme
Data sets and corresponding solutions are created by
means of a FORTRAN-programme (Vaught, 2006).
These data are integrated into a MySQL-table. Cor-
responding PHP programmes produce several online
masks to present tasks, enter solutions, check results
and practice for the written test. The programme is
rather modular and can easily be extended to other
statistical methods. The language is German, as Aus-
tria is a German speaking country. But the language
can be changed easily, because text is stored in a
database and is independent from the generated data
(There are some restrictions to the range of created
data, to make sure that they are plausible in the con-
text provided). Students are invited to invent suitable
texts for online examples. For each text that is ac-
cepted (a maximum of 4) they are credited 1 point for
that part of the final test where they have to select an
appropriate analysis method (the maximum score for
that part is 20 points and a minimum of 10 points is
required to pass). About 30% of the students who fin-
ished the course submitted some text. Most of them
sent 4 texts and 2.1 texts were accepted on average.
3 CONCLUSIONS
Several tools to enhance statistical skills (mostly Java
applets) (e.g. (Dariu, 2006)) and a lot of supplemental
material for statistics courses (e.g. (Pezzullo, 2011))
can be found on the Internet. Multiple choice tests
can be developed with the help of ELearn platforms.
Details about multiple choice randomization can be
found in (I. McLeod, 2003). Other forms of on-
line teaching are demonstrated in (Tudor, 2006) and a
comparison between online teaching and class teach-
ing can be found in (Dutton and Dutton, 2005). But
to my knowledge, no course comparable to the one
presented here is available.
Experience gained over the last ten years leads to
the following impressions:
• Although only 50% of the maximum score need
to be achieved to be permitted to sit the final writ-
ten test, between 80 and 88 percent of participants
reach more then 90% of the maximum score.
• Students try to improve their outcomes.
INNOV 2011 - Second International Conference on Innovative Developments in ICT
80

• More then 4% of the students improve their re-
sults within the input time window although they
already gained a sufficient number of points with
their first input. Three of them did this 3 times.
How often results are entered within a day cannot
be evaluated.
• The programme is widely used to practice the de-
termination of appropriate statistical methods for
the analysis of a given dataset.
• Drop out rates among students as well as their
grades are very similar for the online programme
and the old version of the course (about 7% to
10% of those who continue their studies at the uni-
versity).
• Correspondence via email and within the scope of
an online forum shows that the programme en-
courages students to cooperate. There are more
than 300 entries in this forum, where students on
the one hand ask for help while others post an-
swers to their questions.
The online programme started in 2003 for one branch
of studies and is now used by various lecturers in 4
different branches of studies. In 2010 the course was
evaluated as one of the ten best lectures of the Univer-
sity of Natural Resources and Applied Life Sciences.
No commercial software is needed to run the pro-
gramme. All online masks and database connections
are based on PHP. For database management MySQL
is used. To run the programme on the World Wide
Web, access to a webserver is necessary. Data and
solutions for online examples are generated by means
of a Fortran programme, but can be done in any pro-
gramming language. Since the experiences with this
kind of online teaching has been very positive, it will
be continued. The source code for the online pro-
gramme is available from the author. Since other
disciplines beside statistics show interest in the pro-
gramme, it is planed to reprogramme the source in
Java in such a way that online masks can be generated
without any knowledge of a programming language.
There are 2 variations of the programme depend-
ing on the branch of study. If one enters a reg-
istration number between 1 and 99 the online pro-
gramme can be used by everyone without any re-
striction (http://statlap.boku.ac.at/index.php). As far
as the theoretical part of the final test is concerned a
multiple choice module containing theoretical ques-
tions is planned.
Three datasets of the online programme have to
be analyzed by means of a statistical package (SAS,
R, SPSS). The results with suitable explanation have
to be uploaded to an ELearn platform and results ob-
tained with the help of these packages have to be en-
tered into the online programme, too.
The lecture is accompanied by an ELearn course
where students get some help regarding all aspects of
the programme and the lecture. An online forum ex-
ists, which is widely used by participants to commu-
nicate with each other and with lecturers.
To sum up it seems that the program presented
embedded in several introductory courses is very suc-
cessful. The burden for the statistical staff is bearable
and the quality of education seems to be comparable
to former practice.
REFERENCES
Dariu, P. (2006). Environments to experiment.
http://lstat.kuleuven.be/env2exp/.
Dutton, J. and Dutton, M. (2005). Characteristics and per-
formance of students in an online section of business
statistics. Journal of Statistics Education, 13(3).
Essl, A. (1987). Statistische Methoden in der Tierproduk-
tion.
¨
Osterreichischer Argrarverlag, Wien.
I. McLeod, Y. Zhang, H. Y. (2003). Multiple-choice ran-
domization. Journal of Statistics Education, 11(1).
McCullough, B. D. (1998). Assessing the reliability of sta-
tistical software: Part i. The American Statistician,
52(4):358–366.
Pezzullo, J. C. (2011). Statpages.net. http://statpages.org/.
Rasch, D., Verdooren, L. R., and Gowers, J. I. (2007).
The Design and Analysis of Experiments and Surveys.
Oldenborg Wissenschaftsverlag Gmbh, Wien.
Tudor, G. E. (2006). Teaching introductory statistics online
satisfying the students. Journal of Statistics Educa-
tion, 14(3).
Vaught, A. (2006). G95. http://www.g95.org/.
STATISTICAL EDUCATION AT THE UNIVERSITY OF NATURAL RESOURCES AND LIFE SCIENCES IN
VIENNA
81
