
ASSESSING MESSAGING ACTIVITY IN AN ONLINE
DISCUSSION FORUM USING AN INNOVATION ADOPTION
APPROACH
Steven Abrantes
Institute Polytechnic of Viseu, Viseu, Portugal
Luis Borges Gouveia
Faculty of Science and Technology, University Fernando Pessoa, Porto, Portugal
Keywords: Higher education, Computer messaging, Online discussion forum, Innovation adoption.
Abstract: This paper aims is to validate which of the students, involved in this study, are in the initial and the majority
market of adopters and also classify what type of messages do these different kind of students send when
using an online discussion forum. One hundred and twelve students in a higher education context were
involved in this research. This study is based on the categories proposed by Roger (2003) for the adoption of
innovations theory, and by Mesquita (2007) proposal for the classification of messages. In terms of adoption
of innovation we concluded that the first 16%, i.e., the initial market contains 14 respondents and the next
84%, which are those that belong to the market majority, consisted on 67 respondents. Regarding the
number of messages sent by each kind of students in terms of innovation, we concluded that the students
that belong to the initial market, sent more messages, in terms of the average messages sent, than the
students that belong to the majority market.
1 INTRODUCTION
The use of computers in classrooms brought a
significant change to the teaching and learning
process, i.e., learning focuses more on the student’s
needs and knowledge, where teachers act as mentors
rather than "talking heads" (a clear allusion to the
prevalence of transmitting knowledge) in front of a
live audience. This process of teaching and learning
promotes an attitude of exploration and discovery
and also where the access to education is
transcended by the barriers of time and space
(Geoghegan, 1994).
Information and communication technologies
have already been integrated in our current
education systems. Some teachers have adopted
those technologies in classroom context, modifying
the traditional education system, based on a board,
chalk and a set of slides. However, there are still
teachers who tend to resist to the new information
and communication innovations.
Despite the potential that the information and
communication technologies brought to our today’s
education, the use of these in schools have been
shown as incoherent and in many cases, ineffective
(Reinders, 2009).
One reason for this is the challenge for teachers
to integrate technology into their classrooms. The
use of technology in the classroom requires both
pedagogical and technical knowledge and therefore
a substantial investment of time and resources, both
for the institution and teacher (Reinders, 2009).
The adoption of technologies for teaching and
learning is an innovation that challenges the
structure, culture and practice of universities and
higher education institutions (Anderson et al., 1998).
The introduction of the information and
communication technologies, by some teachers, in a
given environment, has a long tradition of being
based in knowledge transmission throughout a
classroom, which can be seen as a classic case of a
diffusion of innovation (Anderson et al., 1998).
Due to the increased use of information and
communication in the context of higher education,
54
Borges Gouveia L. and Abrantes S. (2011).
ASSESSING MESSAGING ACTIVITY IN AN ONLINE DISCUSSION FORUM USING AN INNOVATION ADOPTION APPROACH.
In Proceedings of the Second International Conference on Innovative Developments in ICT, pages 54-59
DOI: 10.5220/0004471600540059
Copyright
c
SciTePress

we can see a growing use of online discussion
forums by those involved in education (Meyer,
2004). Also, more recently, a number of Web 2.0
tools are in place. However, the use of online
discussion forums can provide a number of
advantages for the teacher
Also, online discussion forums have the
advantage of leaving all that was discussed recorded
to then be analyzed and discussed later (Meyer,
2004) – allowing the realization of studies like the
one presented here.
The problem of evaluation, associated with the
use of online discussion forums, has been a relevant
aspect when instilled in the process of evaluating a
particular course. Evaluation may be considered a
very complex process leading to several questions
and uncertainties for the evaluators.
2 EVALUATING ONLINE
DISCUSSION FORUMS
Although the use of forums in the context of higher
education is already widely used, some issues
associated with its utilization arise, such as, what is
its potential and how can we make its own
evaluation.
The evaluation issue is quite complex and raises
many questions and uncertainties to the evaluator.
According to Santos (2003), this fact “... certainly
has to do with the meanings and concepts of
assessment practices that each teacher has, as well
as their own evaluative experience” (Santos, 2000).
So what does the term “evaluate” mean? In the
dictionary (Priberam, 2009) the term “evaluate”
means “to determine the value of”, “understand”,
“judge”, “appreciate”. Evaluating student's results is
an understanding, appreciation and judgment of their
work, by the teacher, using different set of
instruments in order to determine a qualitative or
quantitative value.
Another important issue, for this research, will
be the evaluation of students participating in online
discussion forums. There are a number of studies
using various forms of assessment to get in use in
online discussion forums (Drops, 2003, Mesquita,
2007, Meyer, 2004, Maor, 1998).
With the simple counting of posts of each
participant in an online discussion forum, you
cannot measure the quality of interactions.
Moreover, we can state that quality is not
synonymous with quantity (Drops, 2003).
Meyer used four different kinds of methods to
analyze seventeen online forums of a doctoral
program in order to validate its efficiency (Meyer,
2004). In particular, for the present study, we
considered the approach proposed by (Mesquita,
2007), who follows a model that basically follows
three steps:
Classify each message of each student as being
significant or not significant. This is, messages like
“Thank you”, “until tomorrow”, “Hello”, are
classified as non-significant and other messages that
are related to the content of the topic in question are
classified as significant.
Once each message has been classified, we
should classify each one according to a scale of 1 to
3 (1 - Positive, 2 - Good, 3 - Very Good). Finally,
calculate the number of meaningful messages
through their multiplication factor, this is, multiply
the number of messages with a classification of very
good by three, multiply the messages with a
classification of good by two and finally multiply
the messages with a classification of positive by 1,
adding in the end, all these components. After this
operation is performed, it is necessary to convert
these values to a qualitative classification. As for the
conversion of these values we can use as basis, the
student who has more meaningful messages, this
will be awarded with 20 points and the others will
use the direct proportionality. In this model, the
student who has written more posts does not
necessarily have better ratings than the student who
has participated less.
This is the algorithm described by Mesquita
(2007) that serves as the base for the current
evaluation of the quality and the participation of the
students in an online discussion forum. This
approach assumes that we are in a collaborative
learning environment and that the teacher has with
him an evaluation grid in order to grade each of the
messages of the various participants.
In conclusion, the formula follows:
Partial classification of the student = nrespx * ntipo1
+ nrespx * ntipo2 + nrespx * ntipo3.
Where nrespx represents the number of
significant responses and ntipo refers to a scale of 1
to 3 (1 - Positive, 2 - Good, 3 - Very Good)
The student's final grade is calculated on the
basis of the student who has more meaningful
messages (partial classification of the student) who
will be awarded with 20 points and the other using
the proportionality rule.
ASSESSING MESSAGING ACTIVITY IN AN ONLINE DISCUSSION FORUM USING AN INNOVATION
ADOPTION APPROACH
55
3 INNOVATION AND DIFFUSION
IN TECHNOLOGY
The diffusion process can be understood as a
communication of a innovation through certain
channels over time among members of a social
system. Diffusion is a special type of
communication in which messages are perceived as
new ideas (Rogers, 2003).
The decision of an innovation is not an
instantaneous act, but a process that occurs over time
and consists on a series of actions (Rogers, 2003):
Knowledge, Persuasion, Decision, Implementation
and Confirmation.
Users seek efficiency, reliability, low cost and
convenience. Besides this, new customers enter the
market as the technology matures. In the early stages
the pioneers are willing to invest in new technology
because they felt that the benefits exceeded the
costs. Customers more conservative wait until the
technology proves itself as being a reliable product
(Norman, 1998).
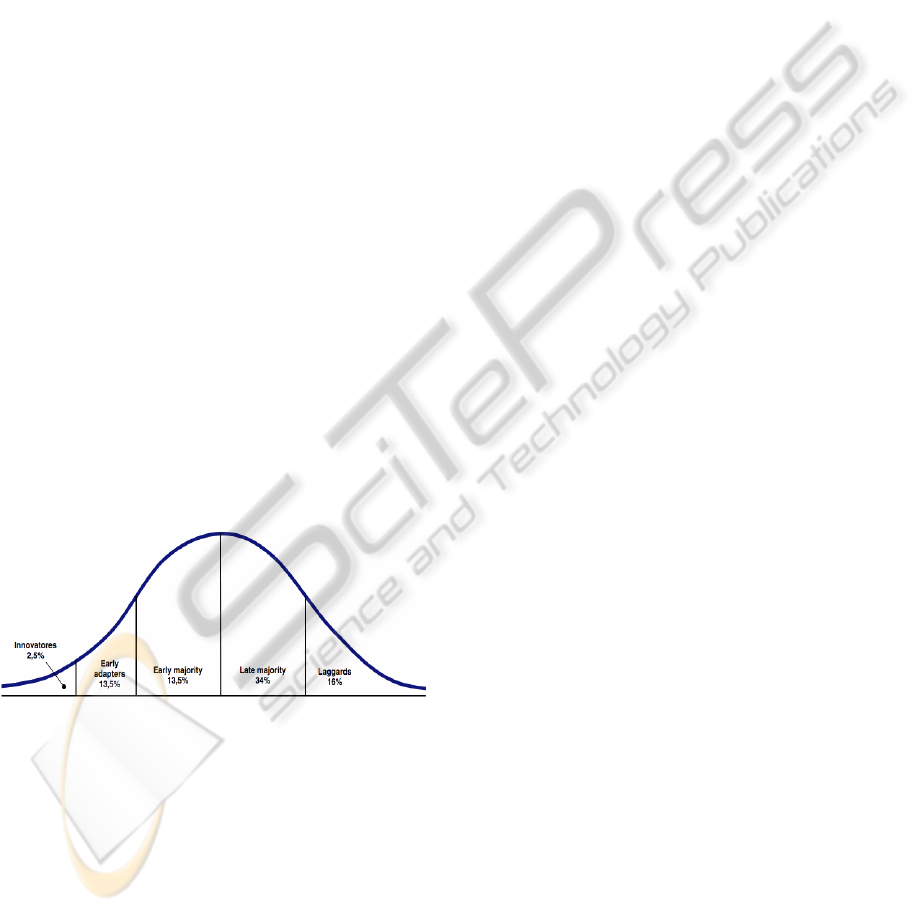
The adoption of innovation has been a research
subject studied by Everett M. Rogers, who identified
the individuals in a range from innovators to
laggards (Figure 1) (Rogers and Scott, 1997).
Individuals who adopt an innovation at different
points over time, differ from one another in a series
of social and psychological characteristics, which is
their willingness to accept and adapt to the changes
inherent in innovation, and determine the attitude of
the next user (Geoghegan, 1994).
Figure 1: Categories of innovation (Rogers, 2003).
A successful innovation will be adopted by the
members of these groups in order, starting with the
innovators, followed by early adopters, early
majority and the final and perhaps the laggards
(Geoghegan, 1994).
Moore (2001) examined the issue of innovation
adoption and stated that there is a "break in the
normal curve", between the early adopters and the
early majority.
Moore (2001) observes that there is a chasm
between the innovators and the early adopters who
are quick to appreciate the nature and benefits of
new products, and the other categories, representing
the rest of the adopters, these are people who want
the benefits of new technologies, but they do not
want to "experience" in all its complicated details.
One can consider the transition between these two
states difficult to achieve and time consuming.
More than anything else, this problem arises
from the significant differences between the early
adopters and the early majority (Geoghegan, 1994).
The crossing of the chasm means that when a
product has just achieved great success in its initial
release, it gains success at the initial market, but for
this same product to be carried forward to the rest of
the market it is required and extra effort and a
radical transformation (Geoghegan, 1994).
This transition involves changes in the users
habits, leading to an replacement of the existing ones
(Moore, 2001).
While performance, reliability and cost of
technology, is above the needs of customers, the
market is dominated by the early adopters: those
who need the technology and pay a high price to
obtain it. But the vast majority of the customers
belong to the early and late majority. These last two
groups tend to expect that the technology has proven
by itself, and insist on a good user experience and
also a added value for them (Norman, 1998).
Our emerging markets and developed countries,
are demanding more and more new adaptations and
new continuous renewals, not only in times of
difficulty, but also in order to have success (Moore,
2001).
To be able to cross the chasm, those responsible
for the new technologies should listen to the
customers and work with them, in order to take care
of their concerns (Denning, 2001).
New technologies may never complete the cycle
of adaptation of innovation, unless the marketing
strategies are identified, in order to make
innovations attractive to the early adopters,
stabilizing after, for the first two groups of adopters
and staying always in the final market (Elgort,
2005). (Geoghegan, 1994) identifies four factors that
difficulties the crossing of the chasm (ignorance of
the chasm; the alliance of technologists; separation
of end market; and Absence of a compelling reason
to adopt):
Also, (Geoghegan, 1994)) identifies four factors
that might facilitate the crossing of the abyss
(recognition; vertical orientation; convincing value;
and Institutional commitment).
INNOV 2011 - Second International Conference on Innovative Developments in ICT
56

4 THE STUDY
This experiment was carried through, involving
students from a university school. The main tool
used was Google Groups, for this experiment. This
section presents the carried through experiment, the
data obtained, as well as the statistical procedures
applied.
Previously to this study, a test with five students
was done, to analyze the effectiveness of the survey.
From this previous study, we concluded that some
questions were ambiguous for the population
studied.
The survey was passed through the Internet with
the help of "LimeSurvey”. The data collection was
performed in the first week of November 2009.
The Instruments used were Google Groups,
Google Docs and Facebook and a survey consisting
on some questions, in order to classify the students
in terms of innovation and also to measure the type
of messages that these students send to a discussion
forum.
4.1 Sample
This study intends to classify the students in terms of
innovation and what is the quality of the responses
given by the students. The data has been collected
through one hundred and twelve surveys of students.
The surveys have been submitted to a rigorous test,
having not excluded any individual; therefore, the
sample consisted on one hundred and twelve valid
surveys. The criteria of exclusion of inquiries were:
students who had not discriminated their sex or age
in the survey; students with incoherent answers
throughout the survey (e.g answers that always
presented values in the extremities of the scales, or
incompatible); students who left 80% of the survey
in blank. Once, one hundred and twelve valid
inquiries were obtained, the sample is considered
sufficiently satisfactory.
4.2 Data Analysis
In order to classify the category of the respondents
belonging to the initial market (innovators, early
adopters) and the majority market (early majority,
late majority and laggards), the scores of individual
innovation developed by Anderson, Varnhagen and
Campbell (1999) was used. This scoring process was
developed based on the assumption that users of the
initial market used the technology sooner and gained
more experience when compared with the majority
market (Anderson, et al., 1998). We used a scale (6
– none to 1 – Intensively) for each type of
applications used (Google Docs, Google Groups and
Facebook), before and after the completion of the
project. The result is the sum of the six responses.
The minimum value of total responses was 6, which
would classify the most innovative. The maximum
total number of answers would be 36, which would
be the classification of the least innovative. The
values of innovation were between16 and 31.
For the cumulative frequencies, we found that
first 16%, i.e., the initial market contains 14
respondents. The next 84%, which are those that
belong to the market majority, consists on 67
respondents. Those who belong to the latter group
are those with the highest values, which mean they
are less innovative than those belonging to the first
16% of the graph of cumulative frequencies.
4.2.1 Initial and Majority Market with
Quality of the Messages
Relatively to the evaluation of the students for
online discussion forums, we can concluded that
there has been a total of 661 messages, where 238
where messages that has been classified as Very
Good, 150 as Good, 203 as Positive and 70 of the
messages has been classified as not significant, this
is, these messages were considered not being valid
for the discussion between the participants.
Separating these messages for the students who have
used do laptop and the desktop, we can reach to the
conclusion that the students who have used the
laptop have sent more messages (455) then the
students who have used the desktop (136).
For the users who used the laptop, 185 were
considered Very Good, 113 were Good, 157
classified as Positive and 45 classified as not
significant. As for the users of the desktop, 53 were
messages classified as Very Good, 37 classified as
Good, 46 as Positive and 25 as not significant.
However, we need to consider the fact that the
number of users using the laptop is greater than the
number of the desktop users. As result, we provide
in table 1 the average number of messages sent by
each student for the laptop and desktop in order to
allow a comparison based on relative numbers and
taking into account the different dimension of the
two groups.
As we can conclude from Table 1, the average
number of messages sent by each student for the
laptop is greater than for the desktop users.
ASSESSING MESSAGING ACTIVITY IN AN ONLINE DISCUSSION FORUM USING AN INNOVATION
ADOPTION APPROACH
57

Table 1: Average number of messages.
Average number of messages
Nº TWO
1
MMW
2
TW
3
MMW
4
81 455 5,617 938 11,58
31 136 4,38 279 9
1
– Total without multiplication factor
2 –
Average messages without multiplication factor
3 –
Total with multiplication factor
4 -
Average messages with multiplication factor
When comparing the messages with the
multiplication factor, sent by the students, belonging
to the initial market and to the majority market
(Table 2), it appears that students that belong to the
initial market have sent less messages than the
students that belong to the majority market.
Table 2: Number of messages/Innovation - (with
multiplication factor).
IM MM
Nº messages (with multiplication factor) 189 749
Comparing the average number of messages with
the multiplication factor, sent by the students (Table
3), belonging to the initial market and to the
majority market, it appears that students that belong
to the initial market have sent more messages than
the students that belong to the majority market.
Table 3: Average number of messages/Innovation - (with
multiplication factor).
IM MM
Average number of messages (with
multiplication factor)
13.5 11.1
In Table 4 we can see the number of meaningful
messages without their multiplication factor, having
the majority market students sent more messages for
the levels 1, 2 and 3 than the students that belong to
the initial market.
5 CONCLUSIONS
In order to evaluate the potential of collaborative
environments, it was performed an experiment
involving higher education students. This study aims
to classify our population in terms of innovation,
using the scores for the individual innovation
developed by Anderson, Varnhagen and Campbell,
1999. Another purpose of this study is to classify the
type of messages sent by each of the different kind
of users in terms of innovation (Very Good, Good,
Positive and not significant).
Table 4: number of messages/Innovation - (without
multiplication factor).
IM MM
3 2 1 3 2 1
Nº messages
(without
multiplication
factor)
26 18 20 159 95 137
Average nº
messages
(without
multiplication
factor)
1.85 1.2 1.4 2.4 1.4 2
Despite the widespread use of collaborative
environments today, there is a lack of reference to
identify the advantages and disadvantages of these
environments.
The analysis of data allows us to conclude that
the majority of the students were males, had ages
between sixteen and twenty four years and that most
of the students have already used discussion forums.
For the case of the classification of innovation
for the students, we verified that they had a set of
scores that were in a range between 16 and 31.
Regarding the number of respondents in both
groups of innovation (initial and majority market),
the initial market contains 14 respondents while the
majority market contains 67 respondents.
The research conducted can be further enhanced
with more data and further services in order to
deepen the promising findings already achieved,
comparing mobile devices (laptop) and desktop use,
within higher education institutions. This can
provide further insight on how mobile devices can
be used to enhance and empower learning initiatives
for getting more users to become power users.
This report also proposed a formula that allows
us to measure the quality of the interventions by the
various participants in an online discussion forum. It
can be considered, that this algorithm is one of the
possible ways, among others, to assess the
participation of online discussion forums.
To use this algorithm to evaluate a online
discussion forum it is necessary that the evaluator
has the following basic elements: a online discussion
forum, a group of students that interact on the forum,
a unique identifier for each participant, a set of
messages sent by each of the participants and an
evaluation grid, as described above, so that the
evaluator can mark each intervention for each
INNOV 2011 - Second International Conference on Innovative Developments in ICT
58

participant. The analysis of data allows us to
conclude that the students sent a total of 455
messages, being 185 were classified as Very Good,
113 Good, 157 classified as Positive and 45
classified as not significant. Considering the average
number of messages, each user sent 5.617 messages.
Regarding the number of messages sent by each
kind of students in terms of innovation, we
concluded that the students that belong to the initial
market, sent more messages, in terms of the average
messages sent, of the students that belong to the
majority market.
With these statements we can say that students,
when using a collaborative environment, these kinds
of environments, sends more messages classified as
Very Good, Good and Positive than messages
classified as not significant. Another conclusion is
that the most innovative users send more messages
than the other users.
REFERENCES
Anderson, T., Varnhagen, S. & Campbell, K. (1998)
Faculty adoption of teaching and learning
technologies: Contrasting earlier adopters and
mainstream faculty. Canadian Journal of Higher
Education, 28, 71-98.
Denning, P. J. (2001) The profession of IT: crossing the
chasm. Commun. ACM, 44, 21-25.
Drops, G. (2003) Assessing Online Chat Sessions. Online
Cl@ssroom, 1-8.
Elgort, I. (2005) E-learning adoption: Bridging the chasm.
22nd Annual Conference of the Australasian Society
for Computers in Learning in Tertiary Education
(ASCILITE). Australia.
Geoghegan, W. (1994) Whatever Happened to
Instructional Technology? Paper presented at the 22nd
Annual Conference of the International Business
Schools Computing Association.
Maor, D. (1998) How does one evaluate students'
participation and interaction in an Internet-based unit?
IN IN BLACK, B. A. S., N. (Ed.) the 7th Annual
Teaching Learning Forum. The University of Western
Australia.
Mesquita, J. S. (2007) b-learning no ensino secundário
recorrente - Uma Proposta baseada na construção do
conhecimento. DEGEI. Aveiro, Universidade de
Aveiro.
Meyer, K. A. (2004) Evaluating online discussions: Four
different frames of analysis. Journal of Asynchronous
Learning Networks, 8, 101-114.
Moore, G. A. (2001) Crossing the chasm: Marketing and
selling technology products to mainstream customers.,
New York., NY: Harper Business.
Norman, D. A. (1998) The invisible computer : why good
products can fail, the personal computer is so complex,
and information appliances are the solution,
Cambridge, Mass, MIT Press.
Pinto, J. & Santos, L. (2006) A avaliação numa
perspectiva formativa. IN ABERTA, U. (Ed.) Modelos
de Avaliação das Aprendizagens Lisboa.
Priberam (2009) Dicionário Electrónico de Língua
Portuguesa.
Reinders, H. (2009) Teaching (with) technology. The
scope and practice of teacher education for
technology. Prospect. Prospect Journal, 24, 15-23.
Rogers, E. (2003) Diffusion of Innovations, New York,
Free Press.
Rogers, E. M. & Scott, K. L. (1997) The diffusion of
innovations model and outreach from the National
Network of Libraries of Medicine to Native American
Communities. Draft paper prepared for the National
Network of Libraries of Medicine, Pacific Northwest
Region, Seattle, WA.
Santos, A. (2000) Ensino à distância & Tecnologias de
informação, FCA.
ASSESSING MESSAGING ACTIVITY IN AN ONLINE DISCUSSION FORUM USING AN INNOVATION
ADOPTION APPROACH
59
