
A SOFTWARE PRODUCT LINE FOR ENERGY-EFFICIENT
CONTROL OF SUPPLEMENTARY LIGHTING IN
GREENHOUSES
Hans Martin Mærsk-Møller and Bo Nørregaard Jørgensen
The Maersk Mc-Kinney Moller Institute, University of Southern Denmark, Campusvej 55, 5230 Odense M, Denmark
Keywords: Software product line engineering, Software development, Software reuse, Energy-efficient production.
Abstract: In 2009, the industrial-size greenhouses in Denmark consumed 0.8 percent of the national electricity
consumption. The increasing energy costs for heating and supplementary lighting have bankrupt many
growers in 2010 causing an urgent need for remaining growers to reduce the consumption while preserving
production quality. This paper presents a novel approach addressing this issue. We use weather forecasts
and electricity prices to compute cost- and energy-efficient supplementary light plans that achieve the
required plant growth defined by the grower. Experiments performed during the winter of 2009 – 2010
showed 25 percent savings with no negative effect on plant quality. To accelerate the impact of our
approach, we chose to use Software Product Line Engineering, as it enables a greater variety of related
software tools to be created faster. We have created a web-based analysis tool, DynaLight Web, for
computing potential savings of our approach, and a desktop version, DynaLight Desktop, that computes an
optimal supplementary light plan and controls the supplementary lighting accordantly. DynaLight Desktop
is currently being field-tested at five industrial-size greenhouses. The development of these two tools is
described together with the lessons learned from using Software Product Line Engineering in the domain of
greenhouse software development.
1 INTRODUCTION
In 2009, the industrial-size greenhouse growers were
responsible for 0.8 percent of the Danish electricity
consumption, which is equivalent to 256 GWh
(Dansk Energi, 2009). Electricity is the largest single
expenditure for the growers and the increasing prices
of electricity can very well jeopardize their existence
within a few years if they do not find ways to reduce
their consumption. An equally important reason for
reducing the consumption is the need to decrease the
CO
2
emission caused by the production of
electricity. In this paper, we present a novel
approach capable of decreasing both the cost and the
consumption, while keeping the same production
quality.
New plant-physiological research has shown
plasticity in plants to irregular light periods (Kjær &
Ottosen, 2011) and these results enable more
energy-efficient ways to grow plants. They also
disproof the perception that plant growth is harmed
by having many short periods of supplementary light
during the 24 hours of a day instead of fewer, longer
periods. This knowledge allows us to prioritize use
of supplementary lighting when plant growth, i.e.,
the photosynthesis, is highest, instead of prioritizing
consecutiveness of the light hours.
The photosynthesis is dependent on three
parameters: CO
2
level, temperature and light. The
light in the greenhouse has two contributors, the
natural light and the supplementary light. We are
most interested in the photosynthesis contributed by
the supplementary light as this consumes electricity
and is controllable.
The growers have specific daily growth goals to
meet their delivery dates – these can be expressed as
Daily Photosynthesis Integrals (DPIs). Planning the
supplementary light to meet the required DPI by
prioritizing the hours when the photosynthesis gain
is highest was investigated in a preceding project,
and is outside the scope of this paper. Changes in the
way the growers pay their electricity have changed
the applicability of this solution and led us towards
the solutions presented in this paper.
Industrial growers now buy electricity on the
37
Mærsk-Møller H. and Nørregaard Jørgensen B. (2011).
A SOFTWARE PRODUCT LINE FOR ENERGY-EFFICIENT CONTROL OF SUPPLEMENTARY LIGHTING IN GREENHOUSES.
In Proceedings of the Second International Conference on Innovative Developments in ICT, pages 37-46
DOI: 10.5220/0004471400370046
Copyright
c
SciTePress
spot market (more detailed explained in section 1.1),
which means they pay different prices per KWh
dependent on the time of use. The preceding project
did not take the price volatility into account when
creating daily supplementary light plans, but
assumed flat rates on electricity. Flat rate here means
a constant price per KWh independent of time of
use. This fact yields the former solution less
applicable to the growers as supplementary light
usage can be placed in very expensive periods. The
solutions in this paper remedy this shortcoming by
taking the fluctuation of electricity price into
account.
Our portfolio of software uses information from
the electricity spot market, local greenhouse
conditions, and light information from weather
forecasts or historic data. We combine these
information sources with a planning algorithm to
optimize the cost and efficiency of the electricity
utilization in the industrial-size greenhouses,
benefiting both the growers and the environment.
Early on, we identified a need for several
different products, both to increase our impact in the
domain but also to enable us to provide different
solutions to the growers dependent on their
involvement. We wished an option to award those
investing in the research and development with a
competitive edge. We chose to develop these
software products using a Software Product Line
(SPL), because the upfront analysis of the
envisioned products showed extensive
commonalities between the products, and we wished
to take advantage of the reuse benefits the Software
Product Line Engineering (SPLE) paradigm
promises. In this paper, we present two software
applications instantiated as product members of our
software product line and explain the consequences
of developing them using SPLE.
The application, DynaLight Web, is capable of
analyzing historical data and showing how efficient
and cheaper utilization could have been achieved
using our planning algorithm, and the cost savings it
would have given the grower. This gives incentive to
use the planning and control tool called DynaLight
Desktop. This product moves the optimization
capabilities of our algorithm verified by DynaLight
Web on historic conditions into production
conditions. Controlled greenhouse conditions,
weather forecasts and electricity prices are then used
to create a light plan for the forthcoming day.
The following subsections introduce the
electricity market in Denmark, the photosynthesis
model and the optimization algorithm. The
introduction of product-specific elements e.g.
weather forecasts, will be found in the section
belonging to the respective product.
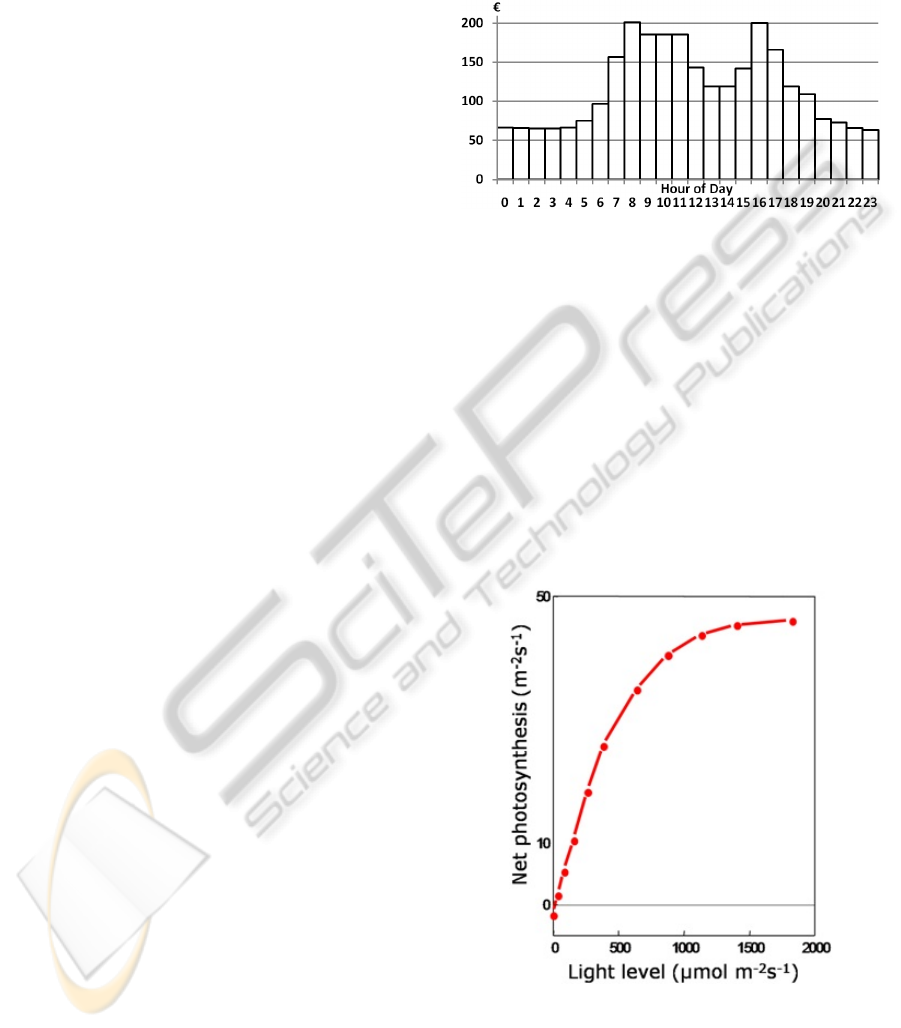
1.1 The Electricity Market
Figure 1: Electricity Price Example.
The industrial-size growers in Denmark, who
consume more than 100,000 KWh, can buy at a flat
rate or buy on the electricity spot market of Nord
Pool Spot (Nord Pool Spot A/S, Lysaker, Norway).
Norway, Finland, Sweden, Estonia and Denmark all
participate on this market. Four of our partners buy
on the spot market while the last buys flat rate.
The electricity prices on the spot market are
settled every day at 1 pm for each of the
forthcoming day’s 24 hours. The prices may vary
significantly from hour to hour (see Figure 1).
1.2 The Photosynthesis Model
Figure 2: Photosynthesis to Light level.
The growth of the plants can be described using a
photosynthesis model. We currently use one
provided by the Faculty of Agricultural Science at
Aarhus University. This model takes light level, CO
2
INNOV 2011 - Second International Conference on Innovative Developments in ICT
38

level and temperature as inputs and outputs the
photosynthesis as CO
2
assimilation (μmol m
-2
s
-1
).
The photosynthesis is not directly proportional to
the variation in light level even when the CO
2
and
temperature levels are kept constant as the
photosynthesis model is non-linear (see Figure 2);
therefore we introduce the term photosynthesis gain.
We define the photosynthesis gain as the difference
between the photosynthesis caused by the natural
light exclusively and photosynthesis caused by the
combination of the natural and the supplementary
light. In other words, it is the growth caused by the
supplementary lighting at a given natural light level.
1.3 The Optimization Algorithm
The semantics of the core in the optimization
algorithm is described in pseudo code in Figure 3.
1.Split period into Days
2.For each Day:
3.Split into hourly Timeslots
4.For each Timeslot:
5.Add Price, CO2, Light Level,
Temperature.
6. Calculate Photosynthesis,
Photosynthesis Gain, Price per
unit of Photosynthesis Gain.
7.Select the hours with the
lowest price per gain until
the DPI is reached or no more
timeslots are available.
Figure 3: Algorithm in Pseudo Code.
The core algorithm uses electricity prices and the
photosynthesis model to create a supplementary
light plan, which fulfils a growth goal chosen by the
grower for the period in scope. This goal is referred
to as the Daily Photosynthesis Integral (DPI).
The algorithm is used in different ways in
DynaLight Web and DynaLight Desktop. For
example DynaLight Desktop does not require
splitting the period into days, as only one day is
analyzed at a time. Other variabilities are hidden
behind abstractions e.g. the light level which is
calculated from weather forecasts in DynaLight
Desktop while extracted from logs in DynaLight
Web.
1.4 Structure of the Paper
Section 2 describes SPLE and relates it to our
context. Section 3 describes the first product,
DynaLight Web and its position as a SPL member.
DynaLight Desktop and its relation to the SPL are
described in Section 4. Section 5 describes the
experimental validations. Our discussion is found in
Section 6 followed by our conclusion in Section 7.
2 SOFTWARE PRODUCT LINE
ENGINEERING
Software Product Line Engineering (SPLE) is the
paradigm dealing with development, maintenance
and evolution a software product line (SPL). It is a
well established field with research being conducted
for more than 15 years. Fundamentally, SPLE builds
on planned reuse contrary to opportunistic reuse,
which empirically has been shown ineffective (Pohl,
van der Linden, & Böckle, 2005).
We agree on the definition of a SPL to be “a set
of software-intensive systems sharing a common,
managed set of features that satisfy the specific
needs of a particular market segment or mission and
that are developed from a common set of core assets
in a prescribed way”(Clements & Northrop, 2001).
The reusable parts are in SPLE terminology
called core assets. These assets are not limited to
source code, but encompass everything from domain
analysis documents, feature graphs, manuals etc.
The variable parts are called variabilities.
The high degree of commonality together with
the assembly plan enable the effective reuse of
SPLE, which causes decreasing development effort,
maintenance cost and time-to-market, while causing
increasing software quality compared to single-
product development. This is to a wide extent only
possible if the SPL is well-managed as the added
complexity of simultaneously developing multiple
products quickly becomes uncontrollable. This
increase in complexity comes from adding one more
level on top of conventional software development
as multiple products need to be designed, developed,
maintained and evolved in coexistence.
Contrary earlier beliefs that only large companies
were able to benefit from applying SPLE,
experiences have shown that small companies can
gain these benefits from adopting the SPLE
paradigm as well (Verlage & Kiesgen, 2005);
(Gacek et al, 2001). That said, SPLE is not ideal for
all as it is very dependent on the degree of
commonality and the possibilities to exploit this. It
is, therefore, important to perform a careful analysis
beforehand.
2.1 SPLE Applied
We analyzed the envisioned product candidates for
A SOFTWARE PRODUCT LINE FOR ENERGY-EFFICIENT CONTROL OF SUPPLEMENTARY LIGHTING IN
GREENHOUSES
39
our SPL using elements of the PuLSE™
methodology (Bayer et Al, 1999) and decided on a
strategy matching our context. We chose an
Extractive Approach leading to a Reactive Approach
(Krueger, 2002). Our strategy was to extract already
existing assets and domain knowledge from a legacy
application called Climate Monitor and use this to
seed our SPL. Afterwards reactively implement the
missing parts to enable instantiation of our products.
Climate Monitor was continuously developed
during the transition to SPL development, which
resulted in the decision to restructure the Climate
Monitor to fit the modular platform architecture we
wanted to use as SPL architecture. This decision was
promoted by the fact that Climate Monitor was
implemented using NetBeans™ Rich Client
Platform (RCP) and that our SPL architecture was
based on the same infrastructure. This facilitated
keeping production online during the transition
process.
All modules needed to be part of a suite from
where the different products could be instantiated.
The first milestone consisted of porting and
refactoring Climate Monitor into the module suite,
called Green Components. The second milestone
was the implementation of custom parts for
DynaLight Web after its core modules could be
instantiated from the suite. The third milestone was
implementation of new modules and refactoring of
old modules to create DynaLight Desktop.
Proceeding milestones and products are planned.
Experiences show that unexpected variability
may arise throughout the life of a software product
line especially in new unstable domains like ours.
We have taken all foreseeable needs for variability
into account, but we have also tried to create a
modular architecture that can handle introduction of
unexpected variability without major restructuring.
3 DYNALIGHT WEB
DynaLight Web uses historical data from
environmental climate computers (ECCs) to analyze
the actual and optimized costs of using
supplementary lighting. The intention is to make the
growers aware of the potential savings, and
indirectly promote DynaLight Desktop.
There are two main vendors of environmental
climate computers (ECCs) in the Danish greenhouse
domain: Senmatic (Senmatic A/S, Søndersø,
Denmark) and Priva (Priva, De Lier, The
Netherlands) and both log all the necessary data to
calculate the historical photosynthesis. They also
store previous set points for the supplementary light,
thereby telling us which hours the light was on and
off. The data can be exported to proprietary text files
for both types of climate computers. DynaLight
Web performs its analysis based on these data,
archived electricity prices and some production
parameters provided by the grower. The analysis is
performed in the following way on the server side.
First the exported text files are cleaned, formatted
and transformed into one standardized data format.
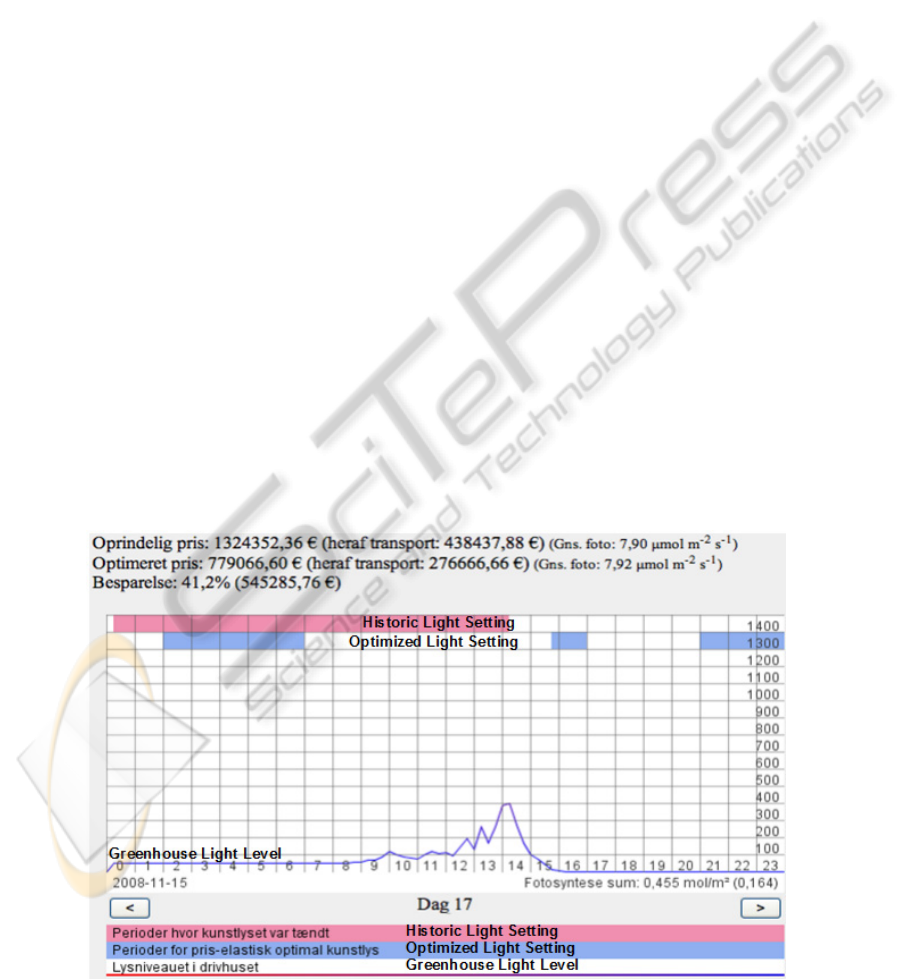
Figure 4: DynaLight Web Screen Flow.
INNOV 2011 - Second International Conference on Innovative Developments in ICT
40

The DPI of days of the past is calculated using the
photosynthesis model and stored. The DPIs are
thereafter used as new DPI goals in the algorithm
described in section 1.3. This returns an optimized
light plan for each of the days of the past. The
historical light set points are then displayed side by
side the virtual setpoints for comparison (see Figure
4). This enables the grower to see the differences
hour by hour between the historical management and
the optimized one. The electricity price of the
historical period is calculated by using the historical
light set points and an electrical price archive. This
result is displayed for the grower together with the
price of optimized set points. The possible savings
are then calculated and displayed (see Figure 4).
DynaLight Web thereby provides an opportunity to
analyze how much the optimization algorithm could
have saved the grower while reaching the same level
of growth.
The solution functions as a website
(http://softwarelab.sdu.dk/DynaLight/) and the
growers are guided through the following five steps.
First, the growers are welcomed and told how to
proceed. Second, the growers are asked for the type
of climate computer they use in order for DynaLight
Web to clean, format and standardize the historical
data correctly, but also to display the correct
guidelines on the next step. The third step displays a
visual guide to the growers on how to export the
data from their particular climate computer. After
the data are exported correctly to a file, the grower
can move on to the next step of the wizard. In this
fourth step, the grower is told to select the path for
the export file and asked whether they belong to the
eastern or western region of Denmark (as it
influences the electricity prices). The growers are
asked for the power consumption of their lamps per
m
2
, their greenhouse size in m
2
and how close the
grower needs the optimization algorithm to match
the historical DPI. The grower uses this last option
to see the effect of using less artificial lighting than
used in the past. The grower clicks ‘Next’ and the
calculations are done on the server side before the
last page is displayed to the grower. This last page
displays the results of the analysis (see Figure 4).
There are eight different totals shown on the top
of the webpage. These cover the whole period being
analyzed. The first line shows the original electricity
price, the part of the price that was used on grid fees
and the average photosynthesis obtained. The second
line shows the price of the optimized light plan, the
included grid fee, and the average photosynthesis
during the period. The third line displays the savings
accomplished by the optimization algorithm both in
percentage and in euro. The grower can navigate
through the days of the past and for each day inspect
the hours the supplementary light was on (the
uppermost coloration), the hours where the
optimization algorithm would have turned the light
on (the coloration just below) and the natural light
level inside the greenhouse (the thin chart line).
The specific results shown in Figure 4 are
calculated on real climate-computer data from an
industrial-size greenhouse. The price of the
historical light set points was 1,324,352.36 €. The
next line shows the price that the optimization
algorithm would have obtained reaching the same
photosynthesis. The price of the optimized plan is
779,066.60 €. Thus the savings would have been
545,285.76 € or equivalent to 41.2 percent. The
resulting average photosynthesis overshoots the
historical result a little bit (7.92 µmol m-2 s-1), so
even with the reduced cost, the algorithm achieves
more growth.
DynaLight Web is instantiated as a SPL member.
The core of DynaLight Web is the three modules:
Electricity Prices, Photosynthesis Model and
Supplementary Light Analysis. All of these are part
of Green Components.
The website part was developed as a NetBeans™
Web-Project and as this project type is not able to be
included in a NetBeans™ module suite it had to be
kept outside Green Components. The Web-Project
includes the html, jsp-server pages and the servlet
that shows the website to the grower, retrieves the
data, delegates the data and shows the results. All
the data processing as well as the optimization
algorithm are implemented as reusable modules. The
reusable modules are also used in Climate Monitor
(which is being phased out) and DynaLight Desktop.
The current instantiation of DynaLight Web works
by building the modules and referencing the
resulting jar-files as external dependencies from the
DynaLight Web Web-Project.
4 DYNALIGHT DESKTOP
DynaLight Desktop is a computer-aided planning
tool for optimizing supplementary light use in
industrial-size greenhouses. The optimization is
based on expected photosynthesis and electricity
prices of the forthcoming day’s 24 hours. The
optimization algorithm (section 1.2) is given the DPI
goal for the day, and the algorithm placed the
supplementary light hours where the cost-
effectiveness is highest. The CO2 and temperature in
step 5 of the algorithm is controlled by the ECC and
A SOFTWARE PRODUCT LINE FOR ENERGY-EFFICIENT CONTROL OF SUPPLEMENTARY LIGHTING IN
GREENHOUSES
41
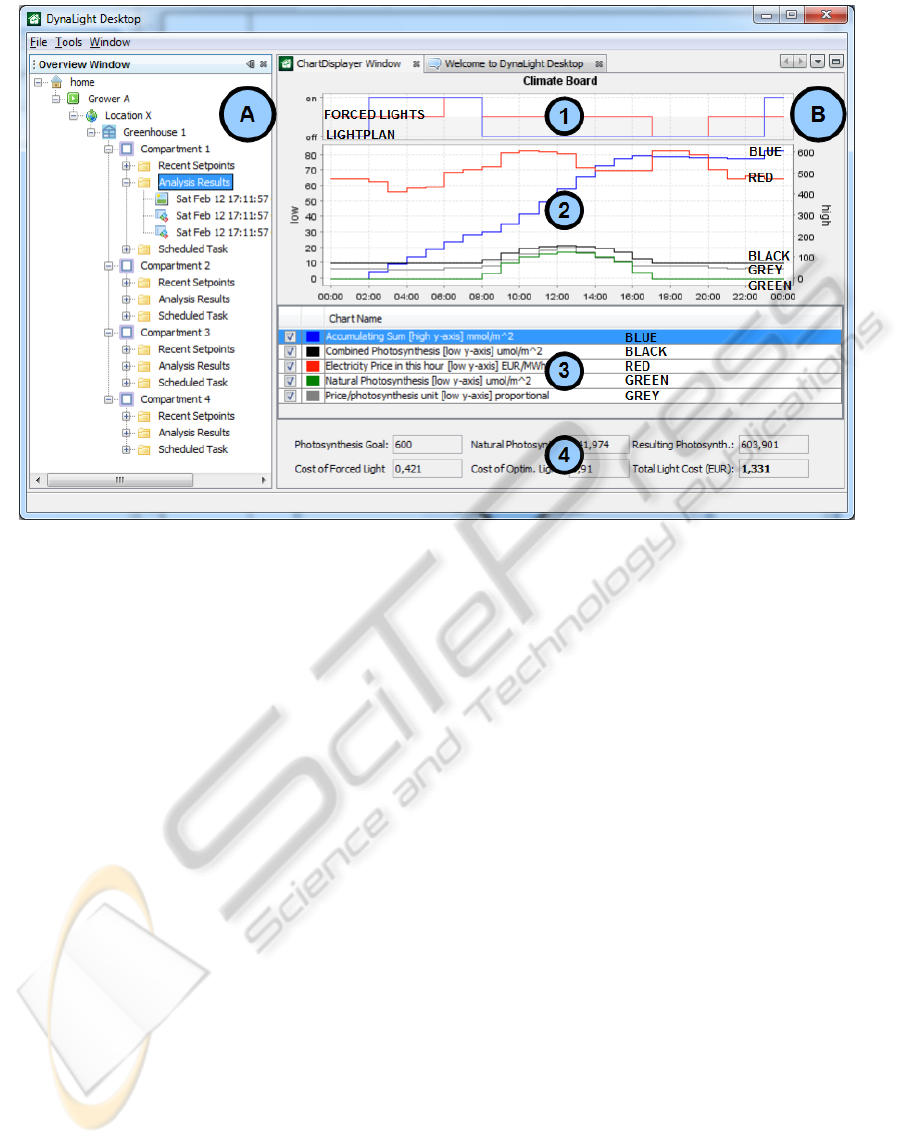
Figure 5: DynaLight Desktop Main Screen.
therefore set to constant levels according to the ECC
settings, while light level is calculated based on
weather forecasts (sun irradiation) and a
mathematical model of the light penetration of the
greenhouse glass. The electricity prices of the
upcoming day are retrieved from the webpage of
Nord Pool Spot. The algorithm thereby has the
necessary inputs to create a supplementary light plan
for the forthcoming day. The software also has the
capability to control the supplementary light in the
greenhouse according to plans using the ECC. The
whole process of creating light plans can be
automated to run every day and write set points.
The optimization algorithm saves money on the
electricity bill and reduces the electricity
consumption by placing the supplementary light
hours where cost-effectiveness is highest.
Superfluous light hours are removed by being better
to predict the resulting daily photosynthesis. The
reduced electricity consumption reduces the CO
2
footprint of the production.
The software product is a desktop application
implemented in Java™ able to run on different
operating systems. DynaLight Desktop is currently
used by leading industrial-size growers in Denmark,
by the Faculty of Agricultural Science of Aarhus
University’s test facility at Aarslev and has been
showcased by U.C. Berkeley.
The Danish Metrological Institute provides us
with forecasts of the sun-irradiation levels, 36 hours
into the future, twice daily in hourly resolution. The
first forecast is provided at 5:45 am and covers only
until afternoon the next day, thus the next day is first
fully covered when the second forecast arrives,
preventing any analysis before 5:26 pm. The
weather forecasts provide the outdoor sun
irradiation, and the algorithm expects the indoor
light level. Therefore, we use a mathematical model
of the greenhouse windows to convert the outdoor
light level to indoor light level before using it in the
optimization algorithm (described in section 1.3).
The main screen of DynaLight Desktop is shown
in Figure 5. The explorer window (A) displays a tree
structure with greenhouses and compartments. The
compartments are one of the central concepts of
DynaLight Desktop. Compartments are separately
controlled areas within the greenhouses. The
properties of these compartments are configured
based on the real-life counterparts. Next to the
explorer window is the editor window called Chart
Displayer (B). All the analyses results are shown in
this window. It contains the light plan chart (1),
where the resulting light plan is shown (marked
LIGHTPLAN) and indications of forced on or off
light conditions (marked FORCED LIGHTS). We
will return to this later. The main chart area (2)
shows different kinds of data. These are described
by the legend below (color names for B/W prints)
INNOV 2011 - Second International Conference on Innovative Developments in ICT
42
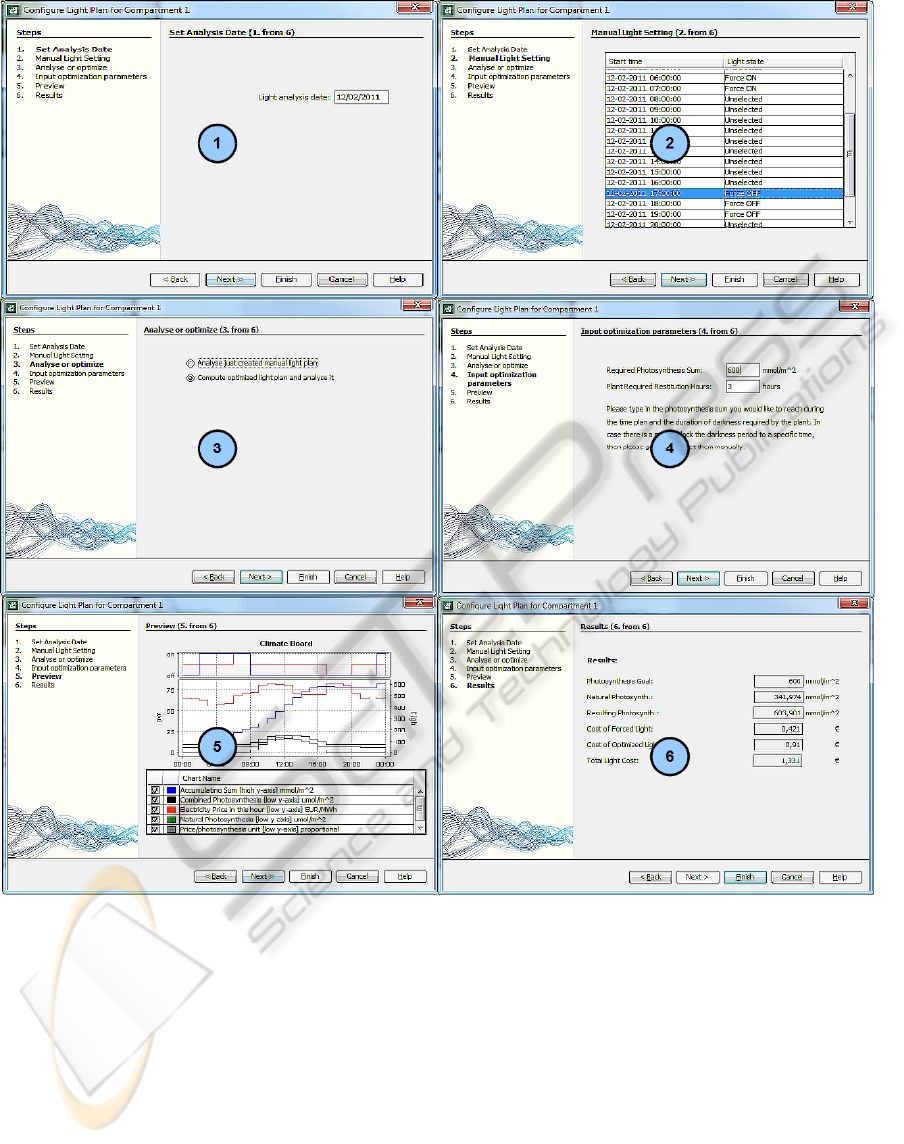
Figure 6: DynaLight Desktop Wizard Flow.
(3) e.g. the line (marked RED) shows the electricity
prices over the day. At the bottom of the Chart
Displayer is (4) the numeric results displayed,
among these the total electricity cost, the DPI goal
and the resulting DPI.
The use case for creating a supplementary light
plan is shown in Figure 6. The grower is first asked
for date being processed in (1). The grower is then
provided with the possibility to force specific hours
on/off in (2). The forced hours are then outside the
control of the algorithm. This can be required if the
grower is using the supplementary light as work
light, or has specific deals with the electricity
supplier not to use electricity within certain hours of
the day. Then the grower is asked if he only wants
the manually selected forced hours to be analyzed or
if the optimization algorithm should help to create a
light plan in (3). The grower is asked for the DPI
and the amount of consecutive hours of darkness
required by the plants in (4). The darkness hours
need to be placed when it is dark enough inside the
greenhouse and not in the dusk and dawn periods i.e.
the hour after sunset and the hour before sunrise.
Previews of the results are given in (5) and (6), these
resemble the results shown later in the Chart
Displayer (Figure 5 (B)).DynaLight Desktop is
A SOFTWARE PRODUCT LINE FOR ENERGY-EFFICIENT CONTROL OF SUPPLEMENTARY LIGHTING IN
GREENHOUSES
43

based on the same three core modules as DynaLight
Web: Electricity Prices, Photosynthesis Model and
Supplementary Light Analysis. This core was
extended with modules handling weather forecasts,
persistency, product branding, graphical user
interfaces, automation of the planning process and
plan execution, and connectivity for writing set
points to the ECCs for the third milestone. The three
core modules were improved by the DynaLight Web
developers during DynaLight Desktop’s
development. The improvements migrated instantly
because of our SPL and single system view. This
advantage was facilitated by well-defined
responsibilities and interfaces of the reusable
modules because we planned and designed it that
way.
5 EXPERIMENTAL VALIDATION
DynaLight Desktop has been used in production
since the winter and the program is currently
running at the Faculty of Agricultural Science of
Aarhus University’s test-facility at Aarslev and at
the companies: Rosa Danica A/S (120,000 m
2
),
PKM A/S (190,000 m
2
), Alfred Pedersen & Son
ApS and Knud Jepsen A/S. DynaLight Desktop is
considered successful based on the fact that these
companies have used the software in their
production.
DynaLight Web is publicly available at
http://softwarelab.sdu.dk/DynaLight. The service
has been tested with several datasets extracted from
ECCs of our collaborating growers to validate
functionality and it is working appropriately. This
yields a successful working solution from a software
developer’s perspective.
Measuring the benefits of using SPLE for
developing the two products is difficult, but the
perceived advantages from reusing the modules of
Photosynthesis Model, Light Analysis and
Electricity Price are big. The modules did not need
to be redeveloped for DynaLight Desktop, which
clearly reduced the development costs, and the
improvements performed by DynaLight Web’s
developers instantly made DynaLight Desktop
benefit from this. The undergoing maintenance and
evolution has not caused any code dependencies to
break or given any unexpected annoyances, which is
perceived a sign of good interface design. The
validation of SPLE as development paradigm for our
energy efficient systems might become clearer when
more of the planned products are derived.
The Department of Agriculture on University of
Aarhus performed experiments during the spring of
2010 which showed a decrease in energy
consumption of 25% without affecting the growth or
quality, compared to a reference culture. The cost
reduction on electricity was 26% (Kjær & Ottosen,
2011). These experiments, which grew plants with
three different DPIs and had one reference culture,
are thoroughly described by Kjær & Ottosen, 2011.
These experiments validate the effectiveness of the
algorithm in the dynamics of the domain. Further
validation of the algorithm is outside the scope of
this paper, as the main focus is usage of SPLE to
produce energy-efficient systems.
6 DISCUSSION
Why is the combination of SPLE and the
development of energy-efficient systems for
greenhouses interesting? Many equivalent functional
features between our previously developed
solutions, current solutions and our planned
solutions were identified and reused through SPLE
was concluded suitable. The applicability from this
perspective has more to do with the technical aspects
of the domain and less to do with energy efficiency
and greenhouses. Another good reason is that
innovative ideas for better and more energy-efficient
greenhouse production are continuously conceived
and needs to be evaluated by performing
experiments. Several of these build on the same
structure of information sources, mathematical
models, system interfaces and graphical user
interfaces. SPLE facilitates faster prototyping and
shorter time from idea conception to experimental
validations which is particular interesting for this
domain.
How does our SPL solution differ from reuse of
a library of modules? The difference is the move
away from opportunistic reuse to planned reuse. The
modules cannot be composed by coincidence, but
because we planned it. The SPL can be viewed as a
software system for producing software products – a
software factory. Thus, the work can be focused on
improving and evolving one system.
How can our system construction be extended to
other fields? The novel idea of using weather
forecasts, electricity spot market and a planning
algorithm for sculpting the electricity load is
applicable in many other domains, and is currently
being investigated for electricity savings in
computer clusters, charging of electrical cars, use of
air conditioning in buildings, and several other
fields. The quality effects of these approaches can be
INNOV 2011 - Second International Conference on Innovative Developments in ICT
44

difficult to measure e.g. change in productivity level
in offices as a result of controlling the indoor
climate. In contrast, the growth and quality are
measurable in our domain, displaying the effects of
load sculpting (planning the supplementary light).
Which refinements could be made to the
algorithm? There are several limitations that affect
the refinement of the algorithm. The prices and
weather forecasts only have hourly resolution, the
lamps currently in use can only be switched on or
off (instead of continuously as e.g. LED lamps), the
prices for the next day are not available before 1 pm,
and so forth. Refinements could be made, so the
algorithm could take several days into account. This
could result in scenarios where supplementary light
would not be switched on during a cloudy day if the
weather forecast shows sunny days at the end of the
period, or supplementary light not being switched on
if the preceding days had resulted in surplus growth.
Corrective behavior based on real-time local
measurements could also be an improvement, so the
light would be switched off if the level was higher
than expected and vice versa. Another improvement
could be introduction of a maximum price, so the
growers could specify the highest price they were
willing to pay. And yet another is creating models
predicting the percentage of renewable energy on the
grid, and controlling the consumption accordingly.
What are the expected savings from these
refinements? It is difficult to predict the savings
these refinements could lead to. The change to LED
lamps which can be gradually switched on/off, is
expected lead to substantial savings as the
technology uses less electricity to produce the same
photosynthesis, and that light level could be
controlled within range where the photosynthesis to
light-level gradient is highest. This is already a
planned SPL member. The other enhancement and
refinements are part of our future research.
Are there un-investigated side effects of the
planning algorithm? The algorithm places the
supplementary light where the price of the gain is
smallest; ergo when the price of an hour is low, it
receives a higher ranking. As the prices on the grid
are based on supply-demand, one would expect that
a surplus caused by renewable, non-dispatchable
energy sources would lower the prices, hence
improve the utilization of renewable energy when it
is available. This is a topic of further investigation.
Why the algorithm is considered optimizing?
Finding the optimal plan with respect to cost and
gain is a combinatorial optimization problem called
a bounded knapsack problem, which is NP-
complete. Our solution includes a greedy
approximation algorithm, which does not necessarily
find a global optimal solution. However, it is very
fast (linear time) and it performs better than standard
management with respect to electricity consumption
and cost, and this is validated by experiments. We
explain the optimization success with the dynamics
of our domain, but it is out of the scope of this paper
to prove this. We consider the algorithm optimizing,
but not optimal.
7 CONCLUSIONS
In this paper, we presented two software products
that facilitate a decrease in the electricity
consumption of the industrial-size greenhouses, thus
enabling a more environmentally-friendly
production of plants. The two applications were both
products of our Software Product Line.
DynaLight Web informs growers about possible
savings by analyzing logs from their past
production. Archived electricity prices from the spot
market and data from their environmental climate
computers (ECCs) are used for the analyses. The
information of possible savings creates both
awareness of a cheaper and greener production form
and creates an incentive to use the second product -
DynaLight Desktop.
DynaLight Desktop is a computer-aided planning
tool for supplementary light which takes weather
forecasts, predicted growth conditions and electricity
spot-market prices into account to reach a certain
growth goal (DPI) for the forthcoming day.
The two software applications are currently in
use at several industrial-size growers, and in an
experimental facility at the Faculty of Agricultural
Science of University of Aarhus. Their experiments
validate savings of 25 percent of electricity
consumption, while maintaining the same level of
production and quality. We regard the usage and
results of the software products as a success.
The challenge from a software development
perspective is how to efficiently develop, maintain
and evolve a portfolio of software products for this
domain. We addressed this challenge by shifting the
development paradigm to SPLE. The planning,
analysis and development of the SPL has been
successful and have resulted in our two product-line
members, which both are based on the same SPL
core asset modules. There are several more product
members currently planned for production.
We conclude that SPLE can be successfully
applied in the domain of greenhouse agriculture to
limit the environmental footprint and streamline the
A SOFTWARE PRODUCT LINE FOR ENERGY-EFFICIENT CONTROL OF SUPPLEMENTARY LIGHTING IN
GREENHOUSES
45

production. We believe that other similar software
organizations, both inside and outside the area of
green computing, can harvest equal benefits by
shifting to the SPLE paradigm.
ACKNOWLEDGEMENTS
The authors wish to acknowledge the European
Regional Fund, Region South Denmark for the
financial support through Intelligent Energy
Handling in Greenhouses (project number 95-410-
44060).
REFERENCES
Bayer, J., Flege, O., Knauber, P., Laqua, R., Muthig, D.,
Schmid, K., Widen, T., DeBaud, J.-M., 1999. PuLSE:
A Methodology to Develop Software Product Lines.
In Proceeding of the 1999 Symposium on Software
Reusability. ACM, New York, USA.
Clements, P., Northrop, L., 2001. Software Product Lines:
Practices and Patterns. Boston, USA: Addison-
Wesley.
Dansk Energi, 2009. Dansk Elforsyning Statistik 2009,
Dansk Energi. http://www.danskenergi.dk.
Gacek, C., Knauber, P., Schmid, K., Clements, P., 2001.
Successful Software Product Line Development in a
Small Organization A Case Study. In IESE-Repost No
013.01/E Version 1.0 March 15 2001. Fraunhofer.
Kjær, K. H., Ottosen, C., 2011. Flowering and growth of
two companula species when grown in a cost-efficient
light control system with irregular light breaks during
the night. Scientia horticulturae. In press.
Krueger, C., 2002. Eliminating the Adoption Barrier:
Point-Counter Point Column. In IEEE Software,
July/August 2002, Volume 19 issue 4. IEEE Computer
Society.
Pohl, K., van der Linden, F. ,Böckle, G., 2005. Software
Product Line Engineering: Foundation, Principles,
and Techniques. New Jersey, USA: Springer-Verlag.
Verlage, M., Kiesgen, T., 2005. Five years of product line
engineering in a small company. In Proceedings of the
27
th
International Conference on Software
Engineering. ACM.
INNOV 2011 - Second International Conference on Innovative Developments in ICT
46
