
PRESTI
Neuroscience Stimuli Presentation Software
Petr Jaroš, Petr Háka and Roman Mouček
Department of Computer Science and Engineering, University of West Bohemia, Univerzitní 8, Pilsen, Czech Republic
Keywords: Stimulus, ERP experiment, Visual programming, Neuroscience, Performance.
Abstract: This paper summarizes a new approach for creating test scenarios and stimuli presentation in
neuroinformatics ERP experiments. The approach uses visual programming that allows creation of test
scenarios without a need of any programming language knowledge. The newly designed programming
language is described in this paper. Solution for weaknesses of visual programming is provided. The next
part deals with performance of stimuli presentation software to ensure lowest possible latency between
stimuli presentation and synchronisation with electroencephalograph.
1 INTRODUCTION
Stimuli presentation is the major task in ERP (Event
Related Potential) experiments in neuroinformatics.
Stimuli are generated according to a plan called test
scenario. PreSti is a new software tool for designing
and executing of test scenarios. This tool has been
developed in the neuroinformatics research group at
the Department of Computer Science and
Engineering. This research group works with several
stimuli presentation software tools and created
feature requests for this kind of software. Because
no existing software meets at least most of the
requests it was necessary to create a new software.
2 STATE OF ART
The typical ERP experiment involves a number of
stages ranging from designing an experiment, to
stimulus construction and coding, to acquiring data,
to averaging and manipulating data, to measuring
and analysing data, and finally to interpreting and
writing up the findings. (Holcomb, 2010) This work
deals with stimulus construction and coding called
stimuli presentation. There are plenty of stimuli but
we consider only stimuli able to be generated by
computer e.g.: visual stimuli and sound stimuli. The
plan for timing of stimuli during experiment is
called test scenario. The program PreSti is created to
design an execution of test scenarios.
There are more existing software tools for
creating test scenarios and presenting stimuli.
Probably one of the most widely used is program
Presentation by Neurobehavioral Systems where test
scenarios are created in its own programming
language.
3 FEATURE REQUIREMENTS
All software tools for stimuli presentation have a lot
of feature, performance and other requirements. In
the next paragraphs only the important requirements
are stated. Full list of requirements is listed in (Jaroš,
2010)
3.1 Ease of Use
Presentation of stimuli can be done by many
different groups of people (e.g.: researchers, medical
assistants, students, etc.) with different level of
computer knowledge. Most of existing software
requires high experiences in programming during
the design of a new ERP experiment. The new
software must allow any user without programming
knowledge at least to edit existing experiments or
even better to create a new one.
3.2 Functionality Preservation
Despite previous requests, new stimuli presentation
390
Jaroš P., Háka P. and Mou
ˇ
cek R..
PRESTI - Neuroscience Stimuli Presentation Software.
DOI: 10.5220/0003693803900393
In Proceedings of the International Conference on Knowledge Management and Information Sharing (KMIS-2011), pages 390-393
ISBN: 978-989-8425-81-2
Copyright
c
2011 SCITEPRESS (Science and Technology Publications, Lda.)
software must have similar abilities as existing
software applying common approaches for creating
test scenarios.
3.3 Performance
A delay between start of a stimulus and sending of a
synchronisation signal to electroencephalograph
must be around 1ms. The delay cannot exceed 5ms
to not affect experiment results.
4 DESIGN OF ERP
EXPERIMENTS
PreSti uses the concept of visual programming
(Johnston, Hanna, & Millar, 2004). A visual
programming language consists of graphical
symbols. It is possible to set properties to the
symbols and connect them together to create a flow
diagram describing a test scenario. This simple
concept allows users without programming
knowledge to design test scenarios and to make test
scenarios more comprehensible.
4.1 Visual Programming Symbols
Design of visual programming symbols has been
focused on generality, extensibility and simplicity.
Each visual programming symbol represents one
function block, e.g.: stimulus, loop construction,
conditions, input/output device. It is possible to set
properties to symbols according to symbol type. A
symbol can have different shapes and consists of 4
different types of ports which provide connectivity
to the other symbols. The shape of symbols is used
only for resolution between different symbol types
and doesn’t have any impact on function.
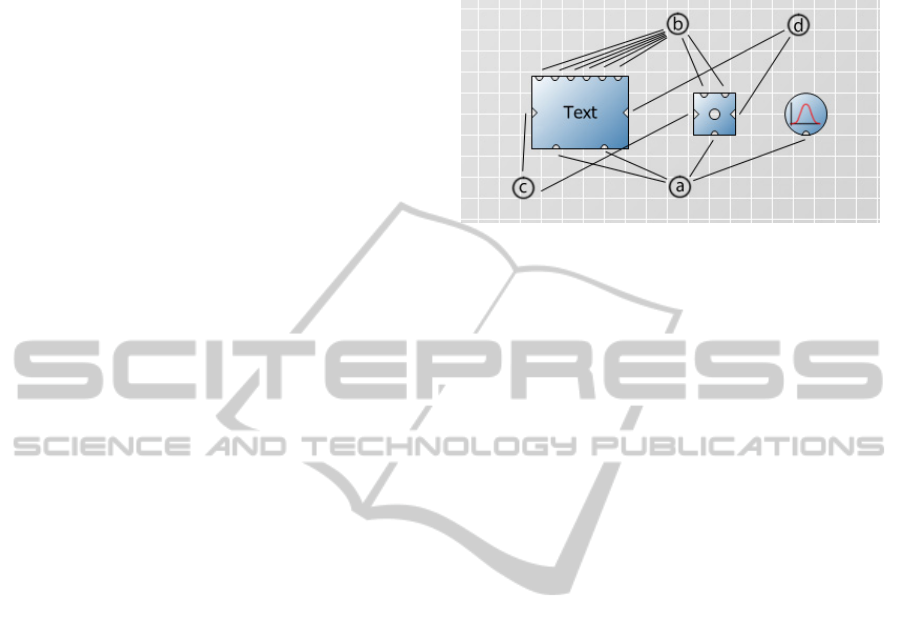
4.1.1 Port Types
An example of port types placed on three different
symbols is in Figure 1. Description of ports is listed
in the following list where letters belong to letters in
the figure.
a) Getter – It is possible to get out properties from
symbols using a getter port.
b) Setter – A setter port gives possibility to change
properties of symbols according to behaviour of
other symbols.
c) Event – A symbol uses event ports to inform
other symbols about an event
d) Action – An action is a reaction to an event
from the other symbols.
Figure 1: Four port types of different symbols.
Ports can be placed anywhere on the shape but
all the shapes in PreSti keep the rule to place events
on the left, actions on the right, getters at the bottom
and setters on the top of the symbol. This rule
assures that program flow is going from the left side
of the diagram to the right side and that values are
transferred from the top to the bottom.
4.2 Connections between Symbols
The flow of the program is made by creating
connections between symbols. There are two types
of connections:
1) Transfer – This connection is made between
getter and setter. It is used to transfer a value of
property from one symbol to another. The transfer
connection is depicted as a solid line.
2) Trigger – This connection is made between
event and action. The trigger has one property –
delay. Using of delays is very often in the special
case of test scenarios. The trigger connection is
depicted as an arrow.
4.3 Creating Test Scenarios
The program is equipped with a set of symbols with
standard functionality. There are symbols for
stimuli, flow control and input/output hardware.
This set can be extended with custom symbols (see
Chapter 4.4).
A user can choose symbols from a palette, place
them in design space and connect them together with
connectors. Every symbol has various properties
which can be set statically in graphical user interface
or dynamically using transfer connections.
PRESTI - Neuroscience Stimuli Presentation Software
391
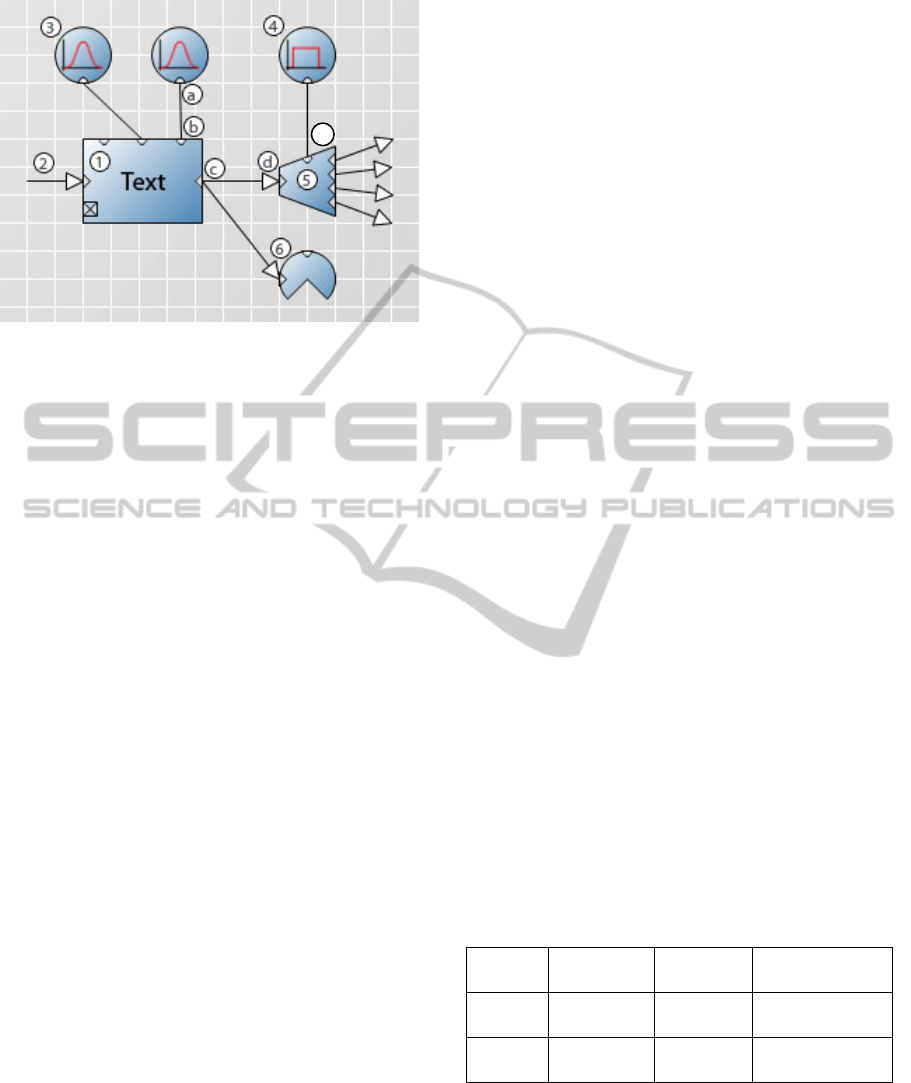
Figure 2: Sample test scenario.
A very simple test scenario is depicted in Figure
2. Description of the test scenario helps to
understand how designing of scenarios works.
Letters in this figure belong to ports described in
Chapter 4.1.1; numbers are described below.
1. Text stimulus is used for displaying a text on a
monitor. It has a lot of properties affecting
appearance and timing of the text. Stimuli generally
have two actions: start and cancel of stimulus; and
one event occurring at the end of stimulus.
2. Trigger connection
3. Random generator of Gaussian distribution. It is
used for dynamical change of position of the text in
this example.
4. Random generator of uniform distribution. It
generates numbers between 1 and 4 in this case. The
limits are set in properties of the symbol.
5. Switch redirects a flow of the program to one of
the connected symbols. Each event port has a range
of values assigned. The switch invokes the event
where a value from getter fits to the corresponding
range of values.
6. Output is used for synchronisation of stimuli
with electroencephalograph.
7. Transfer connection
4.4 Extensibility
Despite robustness of visual programming language
design, visual programming is not as expressive as
conventional programming due to a limited set of
symbols. This problem is solved with extensibility
of a symbol set. A user is allowed to create own
symbols in an object oriented programming
language such as C# and provide a compiled DLL
file. The DLL file can contain any amount of new
symbols. New symbols appear in graphical user
interface once the DLL file is placed into extension
folder. The symbols from extension behave equally
to general symbols. This extensibility system
removes the expressivity problem with visual
programming language and meets the ease-of-use
requirement because designers can use new symbols
exactly in the same way as common symbols.
5 PERFORMANCE
The crucial issue is performance in stimuli
presentation software. The correct function of the
software is directly dependent on precise timing.
The main measure is latency between start of a
stimulus and synchronisation signal sent to
electroencephalograph. From the principles of
measuring ERP experiments (Luck, 2005) latency
should be around 1ms, latency longer than 5ms can
affect the results of experiment.
It cannot be assured maximum latency on
traditional (non-real-time) operation systems which
use the best-effort approach. Traditional operation
systems can set a priority of processes to improve
performance. In PreSti has been set the highest
possible priority (called “real-time priority” even if
it is not really real-time) when presenting stimuli. In
following tables (Table 1 and Table 2) are latencies
compared with various process priorities and various
CPU loads. Delays in these tables refer to time
difference between execution of stimulus and signal
sent to the parallel port.
Experiment 1:
CPU load 2% - 7%
repetitions: 500
repetition interval: 500ms
duration of visual stimulus: 50ms
Table 1: Results of experiment 1.
Average delay
[ms]
Maximum
delay [ms]
Number of delays
exceeding 5ms
Realtime
priority
1.421 21.139 7
Normal
pririty
1.723 21.325 14
Experiment 2:
CPU load 60% - 90%
repetitions: 500
repetition interval: 200ms
duration of visual stimulus: 100ms
7
KMIS 2011 - International Conference on Knowledge Management and Information Sharing
392
Table 2: Results of experiment 2.
Average
delay [ms]
Maximum
delay [ms]
Number of delays
exceeding 5ms
Realtime
priority
2.398 25.003 25
Normal
pririty
3.373 24.222 69
The experiments were taken from (Háka, 2011).
It is clear from these experiments that the real-
time priority lowers the delay by 20% on an
unloaded processor and by 30% on a loaded
processor. The real-time priority also lowers the
number of delays exceeding 5ms. On the other hand,
the real-time priority does not have any impact on
maximum delay and this problem has to be solved
using another approach. The problem with
maximum delays is a task for future research.
6 SPECIFICATIONS
PreSti is a software tool running on Microsoft
Windows platform and it uses the following
technologies:
C# programming language
.NET Framework 4
DirectX graphical rendering library
XNA object oriented graphical library for DirectX
NShape graphical library for creating flowchart
diagrams
PreSti includes output symbols for communication
with hardware, therefore system drivers are included
in PreSti. Drivers use the following technologies:
C programming language
KMDF (Kernel Mode Driver Framework)
Software has been developed using a public code
repository (Codeplex, 2011).
7 CONCLUSIONS
Visual programming has been chosen as an approach
to the design of test scenarios in ERP experiments
due to facilitation to users without knowledge of
programming. The designed visual programming
language in combination with provided extensibility
has the same expressivity as conventional
programming languages and it is possible to design
all the existing test scenarios in this way. The crucial
performance issue has been partially solved with
process priority. There are still some persisting
performance problems that must be solved before
using PreSti in real experiments.
ACKNOWLEDGEMENTS
The work was supported by the UWB grant SGS-
2010-038 Methods and Applications of Bio- and
Medical Informatics and by the SPAV project CZ
1.07/2.3.00/09.0050.
REFERENCES
Codeplex repository. (2011). Retrieved from
http://presti.codeplex.com
Háka, P. (2011). Software for presentation of stimuli.
Pilsen: University of West Bohemia.
Holcomb, P. J. (2010, 3 18). Measuring and Analyzing
ERP Data. Retrieved 5 2011, 10, from
NeuroCognition Lab: http://neurocog.psy.tufts.edu/
wiki/doku.php?id=measuring_and_analyzing_erp_data
Jaroš, P. (2010). The Neuroscience Stimuli Presentation
Software. Pilsen: The University of West Bohemia.
Johnston, W., Hanna, J., & Millar, R. (2004). Advances in
dataflow programming languages. Newtownabbey:
ACM Computing Surveys.
Luck, S. J. (2005). An Introduction to the Event-Related
Potential Technique. The MIT Press.
PRESTI - Neuroscience Stimuli Presentation Software
393
