
IMAGE CONTENTS ANNOTATIONS WITH THE ENSEMBLE
OF ONE-CLASS SUPPORT VECTOR MACHINES
Bogusław Cyganek
1
and Kazimierz Wiatr
2
1
AGH University of Science and Technology, Al. Mickiewicza 30, 30-059, Kraków, Poland
2
Academic Computer Center Cyfronet AGH, Ul. Nawojki 11, 30-950, Kraków, Poland
Keywords: Image indexing, Clustering, One-class SVM, Ensemble of classifiers.
Abstract: The paper presents a system for automatic image indexing based on color information. The main idea is to
build a model which represents contents of a reference image in a form of an ensemble of properly trained
classifiers. A reference image is first k-means segmented starting from the characteristic colors. Then, each
partition is encoded by the one-class SVM. This way an ensemble of classifiers is obtained. During
operation, a test image is classified by the ensemble which responds with a measure of similarity between
the reference and test images. The experimental results show good performance of image indexing based on
their characteristic colors.
1 INTRODUCTION
Automatic indexing of images finds broad interest
among researchers (Müller, 2010); (Hermes, 2005).
It is driven by demands of development of powerful
search tools which allow very fast retrieval of visual
information from data repositories or the Internet.
The paper presents a system of automatic image
indexing based on color information. The main idea
is to construct a model of an image, or its region, in
a form of an ensemble of classifiers which with their
structure convey information on image contents. On
the other hand, such ensemble should have some
generalization properties, so similar images can be
recognized by it as well. Also important is to assure
that the system does not require excessive memory
and allows sufficiently fast performance for search
within large data repositories. The mentioned image
model can be conceived in many different ways. In
the presented method an ensemble of the one-class
support vector machines (OC-SVM) is proposed due
to their good generalization properties and fast
response time. However, prior to building the
ensemble of OC-SVMs, the reference image is
segmented with the k-means methods with starting
mean points set to the characteristic RGB colors.
This way a number of segmented partitions is
obtained. Then, each of these partitions is encoded
by the OC-SVM. The experimental results show
good performance of the method when compared
with other methods that are based exclusively on
color information. A similar idea of prior clustering
of arbitrary datasets was presented in (Cyganek,
2010). In this paper we present its version suitable
for the purpose of image indexing based on color
information.
The rest of the paper is organized as follows. In
section 2 we describe an architecture of the system,
the segmentation method, as well as the ensembles
of the OC-SVMs. Section 3 presents the
experimental results. The paper ends with
conclusions and biography.
2 SYSTEM DESCRIPTION
In this section we present and discuss the basic
stages of training and operation of the proposed
system. However, the system in the proposed shape
can be seen as a kind of color based prefiltering of
similar image in a repository. Thus, it can constitute
a module in a cascade of filters for image search.
Then, other methods can be used to obtain further
information on image contents or on correlation
among images. For this purpose the sparse methods
are very suitable, e.g. the ones which are based on
sparse color invariants (Koen, 2010). In the final
application all different match measures can be
gathered and used to select the most similar images.
Nevertheless, very important aspect of this search is
277
Cyganek B. and Wiatr K..
IMAGE CONTENTS ANNOTATIONS WITH THE ENSEMBLE OF ONE-CLASS SUPPORT VECTOR MACHINES.
DOI: 10.5220/0003684002770282
In Proceedings of the International Conference on Neural Computation Theory and Applications (NCTA-2011), pages 277-282
ISBN: 978-989-8425-84-3
Copyright
c
2011 SCITEPRESS (Science and Technology Publications, Lda.)
to assure that this way reported images are similar in
human sense, since it often happens that although
images bare some resemblance in terms of a
qualitative measure, it is not perceived as similar for
users of that system.
2.1 Operation of the System
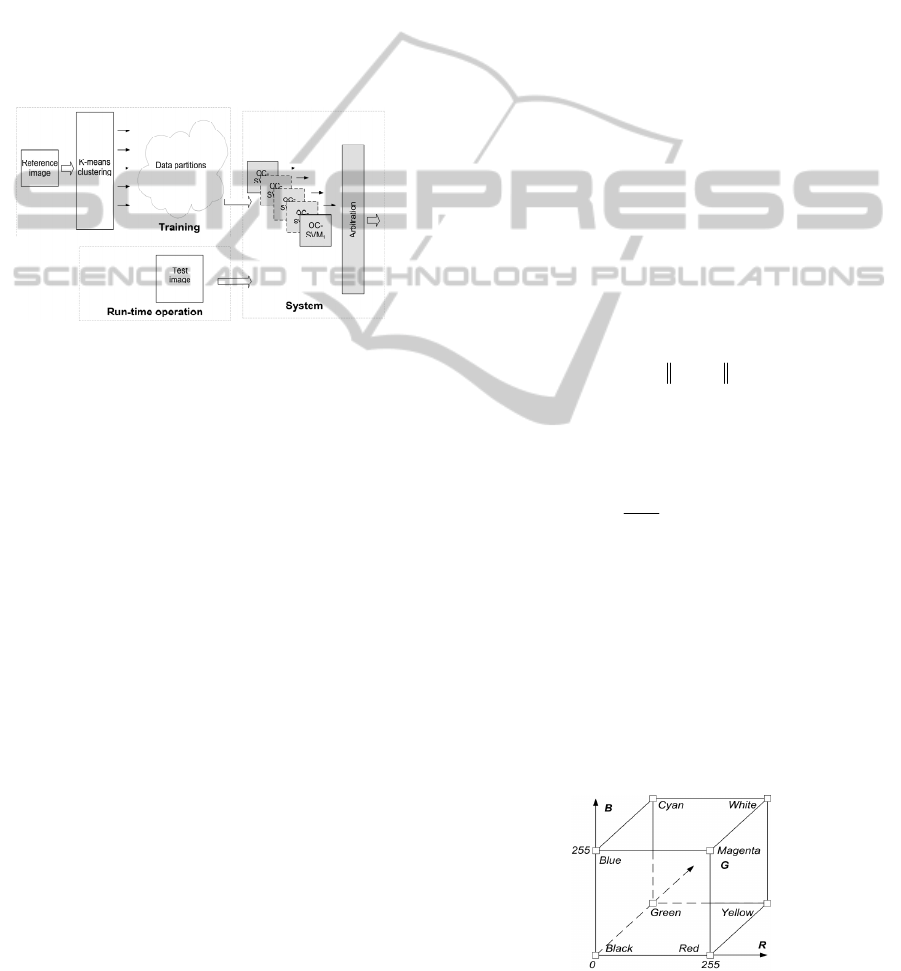
General architecture of the system is depicted in
Figure 1. After training, the system represents a
color contents of a training image in a form of an
ensemble of OC-SVMs and a prototype signature
vector representing relative numbers of points in
each of the OC-SVM (Kuncheva, 2004).
Figure 1: Architecture of the system. It is built during
training from a reference image to represent its color
distribution. During run-time operation the system returns
a similarity measure to the reference image.
The system is trained as follows:
1. Do the k-means clustering, with eight starting
RGB points (in the RGB space).
2. In each of the obtained clusters build an
ensemble of OC-SVMs.
The initial clusters obtained in the first step are
checked and the ones which contain only small
amount of points are rejected. On the other hand, the
clusters which are countless can be further split by
means of the method proposed by Cyganek
(Cyganek, 2010). Thus, in effect a number of OC-
SVMs encodes boundaries of sub-spaces of color
space of a given reference image or its region. Also
a kind of a prototype signature of an image is
obtained in a form of a vector of numbers of pixels
which are classified by each of the member of the
ensemble.
During operation the system classifies each pixel
of the test image, and a number of accepted pixels
by each member of the reference ensemble is
counted. Also counted is a number of pixels which
were not accepted by either member of the
ensemble. These counters are then used to compute a
correspondence measure between the two images.
For this purpose the weighted Bhattacharyya
measure is used. The closest images are reported.
2.2 Image Segmentation
There are many methods of data segmentation
depending on a type of data and chosen features
(Duda, 2001); (Filippone, 2008). In the area of
image segmentation proper segmentation methods
allow selection of characteristic objects depending
on their specific features. However, their choice is
not a trivial one and there is a continuous research in
autonomous image segmentation (Kruse, 2007). In
the light of the presented method we were interested
in a method that works for broad group of different
images and which does not require specific settings.
Considering these the k-means method was selected
which requires specification of a number of expected
clusters as well as their initial mean values.
The method operates as follows. For a set {x
i
} of
training points the k-means algorithm starts with
selection of the initial number of clusters D
i
. Then
each mean value
i
is selected. After initialization
the algorithm proceeds iteratively by assigning each
point x
i
to the closest mean
m
in a cluster D(i), as
follows
1
arg min
im
L
mM
Di
x μ
,
(1)
where ||.||
L
is the Euclidean distance, and M is the
number of clusters. Then each mean value is
recomputed in accordance
1
#
im
mi
D
m
D
x
μ x
.
(2)
The above steps (1) and (2) are repeated until
convergence state is reached, i.e. there are no
changes in values of the means.
In the presented system the chosen initial mean
points must be the same for all images. Therefore
the most distant ones in the RGB space are used. For
this purpose the corner points of the RGB cube are
selected, i.e. [0,0,0], [1,0,0], [1,1,0], [0,1,0], and
[0,1,0], [1,0,1], [1,1,1], [0,1,1], as depicted in Figure
2.
Figure 2: Characteristic RGB color points set as initial
means for the k-means clustering.
NCTA 2011 - International Conference on Neural Computation Theory and Applications
278
A qualitative insight into the k-means clustering
can be gained by analyzing the total sums of
distances:
2
m
mm
D
S
x
x μ
, and
1
M
tm
m
SS
.
(3)
which should be as minimal as possible since k-
means does not guarantee the globally optimal
solution (Duda, 2001). However, in practice the
algorithm converges very fast.
2.3 Modeling of Image Partitions with
the OC-SVMs
The SVM binary classifiers were introduced by
Vapnik et al. (Vapnik, 1995). They allow two class
data classification in the so called feature space.
Thanks to this the superior classification results, as
well as generalization properties, were obtained. An
important factor is also fast operation of the SVM
classifiers which depends mostly on the number of
necessary support vectors. The special one-class
version of SVM allows description of data belonging
to only one class, whereas all other points are treated
as outliers. Formulation of the OC-SVM is due to
Tax et al., who formulated an optimization problem
for construction of the tightest hypersphere around
the data points (Tax, 2004). In their work the method
was named support vector data description. An
alternative formulation was presented by Schölkopf
et al. (Schölkopf, 2002). In their approach, instead of
a hypersphere, a hyperplane is used which separates
the one-class data from the origin of the coordinate
system. In this section we briefly outline the latter
approach.
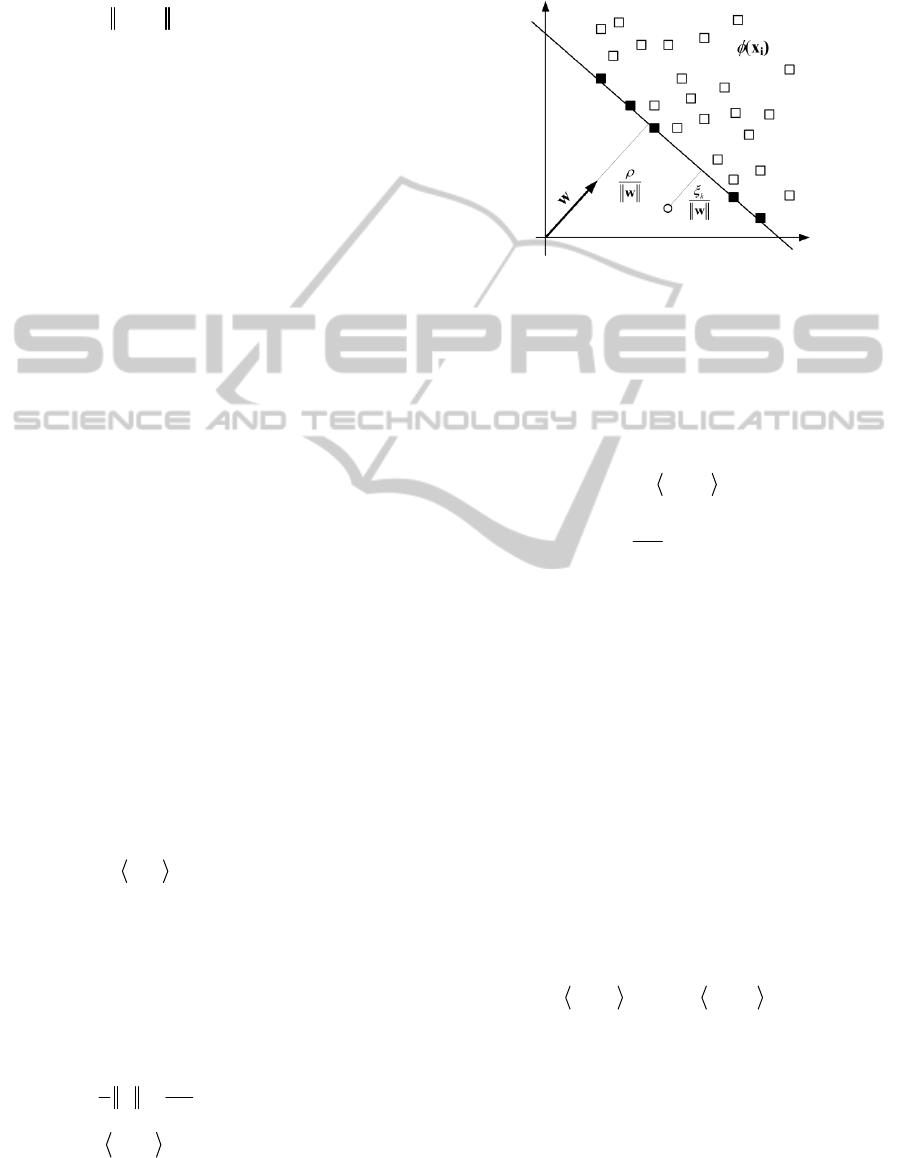
Given a set of data points {x
i
} the one-class
SVM problem can be stated as computation of a
hyperplane w that separates {x
i
} with the maximal
margin from the origin. This hyperplane can be
represented as follows:
,0
wx
(4)
where w,x denotes an inner product between
vectors w and x (Schölkopf, 2002). This is depicted
in Figure 3.
Additionally to account for the outliers in the
data set {x
i
} the slack variables are introduced. In
effect the following convex optimization problem
has to be solved:
1
2
,,
1
11
min
2
N
N
n
n
N
w
w
, with
1
,,0.
nnn
nN
wx
(5)
In the above
n
denote the slack variables, N is a
number of points in {x
i
}, and
is a parameter that
controls allowable number of outliers.
Figure 3: A hyperplane that separates a single class of
points in the feature space
Φ. Support vectors (SV) are on
the hyperplane. Outliers are on the second side of the
hyperplane and are controlled by the slack variables
.
The problem (5) can be solved by means of the
Lagrange multipliers (Fletcher, 2003)(Bertsekas,
1996). Its dual Wolfe representation is:
1
11
min ,
N
NN
nm n m
nm
xx
, with
1
1
0
n
nN
N
, and
1
1
N
n
n
.
(6)
In the above
n
denote the Lagrange multipliers.
There are few ways to solve (6), one possibility is to
employ the SMO algorithm (Gestel, 2004)(Hsu,
2003). The solution can be represented introducing a
series of N values of
n
(some of which can be 0),
each associated with a single data point. The points
for which their corresponding
n
>0 lie on the
hyperplane w and are called the support vectors
(SV). Now, the hyperplane w can be expressed as an
-weighted sum of the SVs.
nn
nSVs
wx
,
(7)
since for all other points than SVs it holds that
i
=0.
Now, taking any support vector x
m
a distance of the
hyperplane w to the origin can be computed as
follows
,,
mnnm
nSVs
wx x x
.
(8)
The above derivations can be extended into the
feature domain substituting each x for a point
generated by a certain mapping function
(x).
However, we easily notice that the formulation of
the decision hyperplane (8) involves exclusively
IMAGE CONTENTS ANNOTATIONS WITH THE ENSEMBLE OF ONE-CLASS SUPPORT VECTOR MACHINES
279

inner products between vectors. In the feature space
this transforms into a kernel computation, as follows
(Shawe-Taylor, 2004); (Schölkopf, 2002); (Hsu,
2003):
,
T
ij i j
K xx x x
,
(9)
which is a scalar value. In our experiments we used
the Gaussian kernel:
2
,
ij
Gij
Ke
xx
xx
,
(10)
where the parameter
controls its spread. For this
type of kernel it can be shown that the above
derivation is equivalent to the hypersphere
formulation presented by Tax et al. (Tax, 2001)
(Tax, 2004).
Taking above into consideration a distance of a
test point x
x
to the hyperplane in the feature space
can be expressed as K(w,x
x
) which, if greater than
,
indicates that a point belongs to the class. That is, a
point x
x
is classified if the following holds
,,
nnx nnm
nSVs nSVs
xx xx
.
(11)
A value on the right side of the condition (11) can be
precomputed to a scalar
to speed up response of
the system. Finally, it is worth mentioning that a
hardware implementation of the classifier operating
in accordance with equation (11) was created which
allows real time image processing. This was possible
due to relatively small number of support vectors
selected during cross-checked training. Their
number in our experiments did not exceed 20.
2.4 Measuring Correlation of Images
A relative distance of color distributions between the
reference and test images is computed with the
Bhattacharyya measure, defined as follows
(Bhattacharyya, 1943); (Aherne, 1998):
1
M
B
ii
i
D
tr
,
(12)
where t
i
and r
i
are the normalized ratios of numbers
of pixels classified by the i-th OC-SVM classifier,
taken out of the total number of M classifiers
belonging to the ensemble. However, apart from the
pixels which were accepted by one of the members
of the ensemble, in the test image there can be pixels
which do not appear in the reference image, for
which the ensemble was constructed. To account for
these pixels a ratio h of a number of pixels rejected
by the ensemble to the total number of pixels in the
test image is computed. Then, the final match
measure is obtained based on the following formula
1
B
D
hD
.
(13)
A value D can take on values from the range of [0,1]
with D close to 0 meaning no match at all, whereas
values of D close to 1 mean a perfect match in terms
of the model expressed by an ensemble of OC-
SVMs.
3 EXPERIMENTAL RESULTS
In order to analyze properties of the presented
method a small subset of the Flickr database was
used, which consists of about 350 images. The
corresponding website of this database contains
numerous images with the accompanying user-
generated keywords (Flickr, 2011). Based on some
subjective measures these are divided into semantic
categories, such as cars, offices, faces, flowers and
other. Examples of some test images from the three
categories are presented in Table 1.
Table 1: Examples of test images from the three categories
(from top down) - cars, flowers, and office.
NCTA 2011 - International Conference on Neural Computation Theory and Applications
280

In our experiments the result of searching for the
similar images is considered correct if within the
five most similar images either majority of them
belong to the same category. Otherwise an answer is
checked by an operator and is accepted if the
responded image visually bears a similar distribution
of dominating colors of the reference one. Although
the first criterion is easily measurable, the second is
subjective. However, the tests were performed by
three persons independently. The obtained results
are presented in Table 2.
The results show comparatively good
performance of the method since the achieved
accuracy is in the range of 82-89%. Usually, worse
results were obtained for more complicated scenes.
On the other hand, if an image consisted of few
objects with dominating color (such as in the
categories cars and faces), in majority of cases the
method was capable of selecting visually similar
instances.
Table 2: Results for image classification to different
categories.
Image category Accuracy
Cars 89 %
Flowers 87 %
Office 82 %
Faces 85 %
Very useful feature of the method is that it is
invariant to geometric deformations, as well as to
slight variations of illumination. This was measured
by artificially generated affinely transformed
versions of the reference images, for which
deformation parameters were randomly selected
from the predefined range. These were random
rotations of maximally 25, horizontal and vertical
changes of scale 12%, as well as translation of 25
pixels. To such deformed image additive noise was
added in the range of 10%. The algorithms for
generation of these deformations are described in the
book (Cyganek, 2009). The obtained results of these
tests show accuracy of 98-100%. The invariance to
the geometric deformations is mostly due to
measuring boundaries of dominating color
distributions, while to the variations of illumination
comes from the generalizing properties of the OC-
SVM classifiers.
4 CONCLUSIONS
The paper presents a simple but capable method of
the prototype encoding in a form of a set of
ensembles of OC-SVM classifiers. Such an encoding
allows fast examination of a database and selection
of images similar in their color distributions.
However, thanks to the boundary descriptors of the
OC-SVMs the output ensembles consume much less
memory than the original images or 3D histograms.
They also allow fast comparison of the test pixels
coming from the other images. The experimental
results show acceptable accuracy for three different
groups of test images.
Further research will be devoted to development
of methods that consider other characteristic features
of the images such as spatial position of color pixels
and texture. As alluded to previously, the presented
method should be connected with one of the search
methods that utilize invariant features of the images.
Future research should be also focused on
development of methods which allow responses
which agree with similarity in the sense of human
visual perception, as well as on human-computer
interfaces which allow easy formulations of queries
for search of visual information. For the latter, the
combination of different approaches seems to be the
most versatile, due to numerous categories of scenes
in the repositories. Also important is development of
parallel algorithms which allow faster operation for
very large databases.
ACKNOWLEDGEMENTS
This research was supported from the Polish funds
for scientific research in the year 2011 under the
Synat project.
REFERENCES
Aherne, F. J., Thacker, N. A., Rockett, P. I., 1998. The
Bhattacharyya Metric as an Absolute Similarity
Measure for Frequency Coded Data. Kybernetika, Vol.
34, No. 4, pp. 363-368.
Bertsekas, D. P., 1996. Constraint Optimization and
Lagrange Multiplier Methods.
Athena Scientific.
Bhattacharyya, A., 1943. On a Measure of Divergence
Between Two Statistical Populations Defined by their
Probability Distributions. Bull.
Calcutta Mathematic
Society
, Vol. 35, pp. 99-110.
Cyganek, B., Siebert, J. P., 2009. An Introduction to 3D
Computer Vision Techniques and Algorithms, Wiley.
IMAGE CONTENTS ANNOTATIONS WITH THE ENSEMBLE OF ONE-CLASS SUPPORT VECTOR MACHINES
281

Cyganek, B., 2010. Image Segmentation with a Hybrid
Ensemble of One-Class Support Vector Machines.
HAIS 2010, Part I, Lecture Notes in Artificial
Intelligence
6076, Springer, pp. 256–263.
Duda, R. O., Hart, P. E., Stork, D. G., 2001. Pattern
Classification. Wiley.
Filippone, M., Camastra, F., Masullia, F., Rovetta, S.,
2008. A survey of kernel and spectral methods for
clustering.
Pattern Recognition 41, pp. 176-190.
Fletcher, R., 2003. Practical Methods of Optimization, 2nd
edition. Wiley.
Flickr, 2011. http://www.flickr.com/
Gestel, T. V., Suykens, J. A. K., Baesens, B., Viaene, S.,
Vanthienen, J., Dedene, G., De Moor, B., Vandewalle,
J., 2004. Benchmarking least squares support vector
machine classifiers.
Machine Learning, Vol. 54, No. 1,
pp. 5-32.
Hermes, T., Miene, A., Herzog, O., 2005. Graphical
Search for Images by Picture-Finder. Multimedia
Tools and Applications. Special Issue on Multimedia
Retrieval Algorithmics
, Vol. 27, No. 2, pp. 229-250.
Hsu, C-W., Chang, C-C., Lin, C-J., 2003. A Practical
Guide to Support Vector Classification. Department of
Computer Science and Information Engineering,
National Taiwan University
, (www.csie.ntu.edu.tw/
~cjlin/papers/guide/guide.pdf)
Koen, E. A. van de Sande, Gevers, T., Snoek, C. G. M.,
2010. Evaluating Color Descriptors for Object and
Scene Recognition. IEEE Transactions on Pattern
Analysis and Machine Intelligence
, Vol. 32, No. 9, pp.
1582-1596.
Kruse, R., Döring, C., Lesot, M-J., 2007. Fundamentals of
Fuzzy Clustering, in Advances in Fuzzy Clustering
and its Applications, ed. de Oliveira, J.,V., Pedrycz,
W.,
Wiley, pp. 3-30.
Kuncheva, L. I., 2004. Combining Pattern Classifiers.
Wiley.
Müller, H., Clough, P., Deselaers, T., Caputo, B., 2010.
ImageCLEF. Experimental Evaluation in Visual
Information Retrieval.
Springer.
Schölkopf, B., Smola, A. J., 2002. Learning with Kernels,
MIT Press.
Shawe-Taylor, J., Cristianini, N., 2004. Kernel Methods
for Pattern Analysis.
Cambridge University Press.
Tax, D. M. J., 2001. One-class classification. PhD thesis,
TU Delft University.
Tax, D., Duin, R., 2004. Support Vector Data Description,
Machine Learning 54, pp.45-66.
Vapnik V. N., 1995. The Nature of Statistical Learning
Theory, Springer.
NCTA 2011 - International Conference on Neural Computation Theory and Applications
282
