
ON-CENTER/OFF-SURROUND NEURAL NETWORK MODEL
FOR OLFACTORY ATTENTION
Zu Soh
Department of Biotechnology, Osaka University, 2-1 Yamadaoka, Shuita, Osaka, Japan
Toshio Tsuji
Department of System Cybernetics, Hiroshima University, 1-4-1 Kagamiyama, Higashi-Hiroshima, Japan
Noboru Takiguchi
Division of Material Sciences, Kanazawa University, Kakuma, Kanazawa, Ishikawa, Japan
Hisao Ohtake
Department of Biotechnology, Osaka University, 2-1 Yamadaoka, Shuita, Osaka, Japan
Keywords:
Olfactory system, Attention, Neural network model.
Abstract:
Our research group has found behavioral evidence that an attention function exists in the olfactory system
similarly to in the visual and auditory systems. In this paper we propose a neural network model that accounts
for olfactory attention based on macroscopic neural connections. Specifically, on-center/off-surround connec-
tions were assumed to be involved in the attention process in accordance with our hypothesis of an attention
window that extracts local activity. The model employs glomerular activity patterns as its input, and compares
them with stored patterns focusing on their local activity. The model also can shift and change the attention
window with respect to learning. From the simulation results, we confirmed that the model can account for
the results of a behavioral experiment on olfactory attention in mice.
1 INTRODUCTION
Attention is an important cognitive function for fil-
tering out irrelevant information and extracting use-
ful information from a noisy environment. Atten-
tion thus enables efficient information processing in
the case of limited computational capacity (Dayan
et al., 2000). The mechanisms of visual and auditory
attention have been studied over previous decades
(Broadbent, 1958) from the behavioral level to the
neural level. These studies suggest that selective at-
tention can be caused by modulation of the ampli-
tude of neural activity evoked by stimuli (Hillyard
et al., 1998). As physiological mechanisms have been
gradually elucidated, their mathematical models have
begun to be applied to robotics (Vijayakumar et al.,
2001; Ruesch et al., 2008). In contrast to these devel-
opments for visual and auditory systems, to the best
of our knowledge, the existence of an attention mech-
anism in olfactory systems has only recently begun to
be investigated.
As natural odors are generally composed of a
complex mixture of volatile compounds (odorants),
of which more than 400,000 types (Mori et al., 2006)
exist, focusing on part of them should be an efficient
means of recognizing odor. To determine whether an
attention function also exists in the olfactory system,
our research group performed an odor discrimination
experiment on mice (Takiguchi et al., 2008). The
experiment provided evidence that mice can mem-
orize and discriminate odors by focusing on a sub-
set of odorants comprising an odor. Furthermore,
when a difficult discrimination task was presented,
the mice slowly modified the attention subset through
their learning experience. As visual and auditory sys-
tems can quickly switch their attention to different ob-
183
Soh Z., Tsuji T., Takiguchi N. and Ohtake H..
ON-CENTER/OFF-SURROUND NEURAL NETWORK MODEL FOR OLFACTORY ATTENTION.
DOI: 10.5220/0003680301830189
In Proceedings of the International Conference on Neural Computation Theory and Applications (NCTA-2011), pages 183-189
ISBN: 978-989-8425-84-3
Copyright
c
2011 SCITEPRESS (Science and Technology Publications, Lda.)
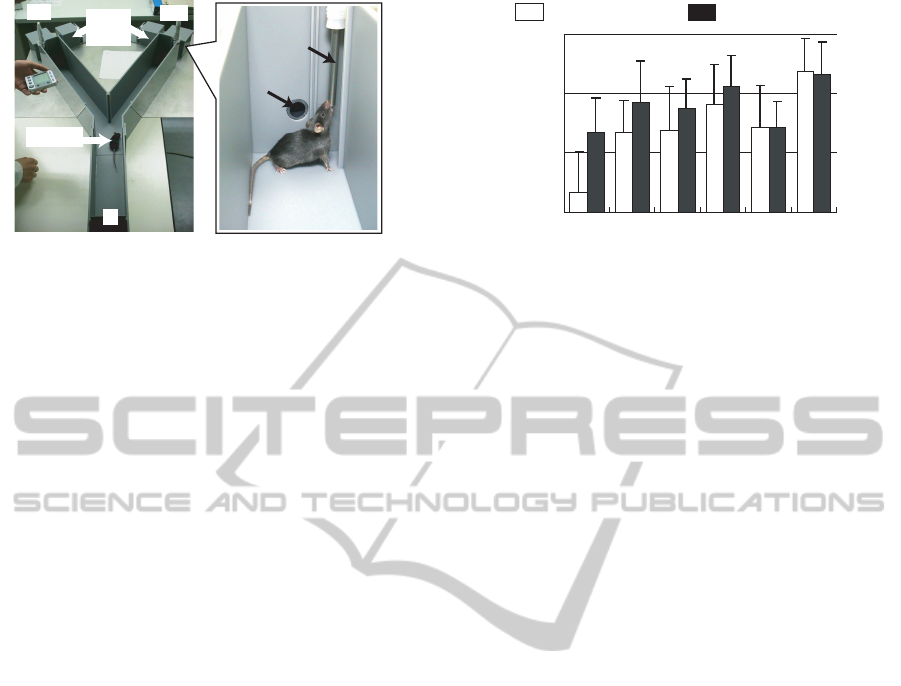
Odor
boxes
Mouse
E1 E2
S
Odor outlet
Water-feeder
Figure 1: Y-maze.
jects, from this viewpoint the attention function in the
olfactory system is different from that in the visual
and auditory systems.
Although an attention function was found at the
behavioral level, its mechanism at the neural level is
not clear. As current technology does not allow the
exhaustive measurement and interpretating of neural
activity, building a mathematical model is a perspec-
tive approach to this problem. Most previous olfac-
tory models were built with the aim of accounting
for neural dynamics (Cleland and Sethupathy, 2006)
and background segmentation (Li and Hertz, 2000);
however, a model to account for the attention mech-
anism has not yet been proposed. Against this back-
ground, we previously proposed an attention model
that could predict perceptual similarity between odors
(Soh et al., 2009); however, several assumptions em-
ployed in the model were not realistic, and the model
could not explain shifts and changes in attention. In
this paper, we propose an olfactory attention model
taking the macroscopic neural connections in the ol-
factory system into account. The model employs neu-
ral activity evoked on the glomeruli as its input and
predicts the odor discrimination ability of mice re-
sulting from their attention function. In addition, we
demonstrate that the discrimination ability predicted
by the model has a similar tendency to that observed
in experiments.
2 EXPERIMENT ON
OLFACTORY ATTENTION
To elucidate the attention mechanism in the olfac-
tory system, our research group performed an odor
discrimination experiment on mice (Takiguchi et al.,
2008) using different mixtures of three types of odor-
ant: isoamyl acetate (IA), ethyl butyrate (EB), and
Citral (Ci). In the experiment, the subject mice were
prompted to discriminate between a water-rewarded
odor [IA, Ci, EB] and odors composed of different
%
Correct
discrimination rate
Later 12 trialsFirst 12 trials
vs
Rewarded odor [IA,EB,Ci]
40
60
80
100
[IA,EB] [IA,Ci] [EB,Ci] [IA] [EB] [Ci]
Figure 2: Results of odor discrimination experiment.
combinations. In this section we review the procedure
and experimental results.
The experiment employed a Y-maze assay, which
uses a Y-shaped channel as shown in Figure 1. At the
end S, there is a small chamber with a gate (starting
box) separated from the channel to trap the subject.
The other ends E1 and E2 have attached odor boxes,
which transmit odors into the channel, and water feed-
ers to provide the reward. During the experiment the
subject mice were prohibited from drinking water ex-
cept as a reward.
A trial started with setting the rewarded odor [IA,
Ci, EB] and an unrewarded odor in the two odor
boxes. The subject was then placed in the starting
box. When the gate opened, the subject could run
through the channel and choose one of the branches
of the channel depending on the response to the odor.
The subject was allowed to drink water from the water
feeder next to the rewarded odor, otherwise it was re-
turned to the starting box immediately. This trial was
repeated 24 times in a day, referred to as one session.
After the subjects were trained to form an asso-
ciation between the rewarded odor [IA, Ci, EB] and
water in the first several sessions, the subjects were
required to discriminate between the rewarded odor
and unrewarded odors. Figure 2 shows the average
discrimination rate of eight subjects in the first 12 tri-
als and the following 12 trials in a session. The dis-
crimination rate of 46.9% against odor [IA, EB] in
the first 12 trials implies that the subjects considered
odor [IA, EB] as the rewarded odor, since a discrimi-
nation rate of 50% would be expected as a result of
random selection. In the following 12 trials, how-
ever, the subjects became more able to discriminate
between these odors since the average discrimination
rate increased to 66.7%. This suggests that when the
association between water and the rewarded odor [IA,
Ci, EB] was made, the subjects only paid attention to
the odorants IA and EB. Subsequently, the attention
of the mice changed, enabling them to perform cor-
NCTA 2011 - International Conference on Neural Computation Theory and Applications
184

OO
Olfactory
bulb
Olfactory
epithelium
Piriform
cortex
Odorants
Olfactory epithelium Olfactory bulb Piriform cortex
Receptor
neuron
Glomeruli Pyramidal cell
䊶䊶䊶
Mitral cell Granular cell
Excitatory synapse
Inhibitory synapse
O
O
O
Geranyl acetate
Glomerular activity pattern
Figure 3: Structure of the olfactory system.
rect discrimination. These results thus confirmed the
attention ability of the olfactory system.
Although this experiment illustrated the occur-
rence of incorrect discrimination caused by attention
ability, considering the large number of odorants that
exist, paying attention to a few important odorants
comprising odors is much more efficient for identi-
fying or discriminating between odors. Despite its
importance, the mechanism of attention at the neu-
ral level has not been investigated. To explain the at-
tention ability of the olfactory system, a window that
extracts local neural activity evoked by odors was as-
sumed (Takiguchi et al., 2008). Discrimination be-
tween odors is then performed using only the neural
activity included in this window. However, this hy-
pothesis has not been validated.
3 STRUCTURE OF THE
OLFACTORY SYSTEM
As the mechanism of attention has not been eluci-
dated in the biological field, partly because of the dif-
ficulty of exhaustively measuring and interpretation
of neural activity, in this paper, we propose a possible
attention model from an engineering approach based
on the neural structure of the olfactory system (Mori
et al., 2006; Heimer, 1968) and the above hypothe-
sis (Takiguchi et al., 2008). In this section we briefly
review the structure of the olfactory system.
Figure 3 shows the basic structure of the olfac-
tory system of mice, which consists of three parts: re-
ceptor neurons, the olfactory bulb, and the piriform
cortex. Receptor neurons are distributed on the sur-
face of the nasal chamber, expressing a single recep-
tor protein from among thousands of different vari-
eties (Buck and Axel, 1991); each neuron is activated
by a specific group of odorants and sends signals to
the olfactory bulb.
The olfactory bulb mainly consists of glomeruli,
mitral cells, and granular cells. A glomerulus is a
round cluster of axon terminals accumulated from
receptor neurons. The activity patterns evoked on
glomeruli are odor-specific ((Mori et al., 2006; John-
son and Leon, 2000), shown in the lowest part of Fig-
ure 3). A mitral cell is an excitatory neuron that re-
ceives the output from a glomerulus. Granular cells
are inhibitory neurons sending inhibitory signals to
the mitral cells. Although mitral cells and granular
cells appear to form complex connections, it has been
suggested that they form an on-center/off-surround
circuit in which neighboring mitral cells excite each
other but distant cells inhibit each other (Grossberg,
1976). The mitral cells also transfer signals to the
pyramidal cells in the piriform cortex, which then
send signals back to the granular cells in the olfactory
bulb and indirectly inhibit the mitral cells.
On-center/off-surround connections in the olfac-
tory bulb are well-known neural connections found
in sensing systems and typically perform contrast en-
hancement. In this paper, we consider that these con-
nections have an important role in generating a win-
dow of attention to extract neural activity.
4 PROPOSED MODEL
Since several experimental results and mathematical
models have suggested that the olfactory bulb has
the functions of input normalization and contrast en-
hancement (Grossberg, 1976; Cleland and Sethupa-
thy, 2006), we modeled the attention function as an in-
teraction between these two functions. However, the
interconnections involved in the olfactory system can
evoke complex dynamics that preventus from analyz-
ing attention mechanisms; we thus designed a simple
model that makes it possible to focus on spatial neu-
ral activity patterns taking the macroscopic connec-
tions between neurons into account. In this section,
the structure of each layer and the parameter settings
of the proposed model are described.
4.1 Structure of the Proposed Model
Figure 4 shows the structure of the proposed model,
which consists of three layers: the input layer, the ol-
factory bulb layer, and the output layer.
The input layer carries the activity patterns evoked
on the glomeruli by odorants o
i
mixed in an odor O =
ON-CENTER/OFF-SURROUND NEURAL NETWORK MODEL FOR OLFACTORY ATTENTION
185

...
Neuron
units
Glomerular
activity patterns
Olfactory bulb
layer
Output layer
Σ
Σ
uj
oi
up
Hj
wjp
㪅㪅㪅
Input layer
Inhibitory input
Output
Figure 4: Structure of the proposed model.
[o
1
,o
2
,...,o
N
]. In this paper, we used the activity pat-
terns measured from actual organisms obtained from
an online database (http://gara.bio.uci.edu/). The pro-
vided activity patterns were originally in an image file
format. To convert each image file into an input, the
image is divided into L = 1805 lattice squares approx-
imately corresponding to the number of glomeruli on
a mouse’s olfactory bulb. Each of the lattice squares
is then converted into a value ranging from 0 to 1 de-
pending on the color in the lattice, which corresponds
to the activity strength. The activity evoked on the jth
lattice square by odorant o
i
is thus denoted as a
ij
, and
the activity pattern is the vector a
i
∈ R
1×L
.
The olfactory bulb layer consists of L neuron
units. They receive inputs from the input layer as
well as inhibitory inputs from the output cortex layer.
To realize the functions of normalization and con-
trast enhancement, this layer employs a neural net-
work model whose structure was previously proposed
(Grossberg, 1976), given as
I
j
=
N
∑
i=1
a
ij
, (1)
˙u
j
= −Tu
j
+ (B− u
j
)I
j
− u
j
(
L
∑
j
′
6= j
w
j
′
j
I
′
j
− H
j
), (2)
where I
j
,I
′
j
is the input from the input layer, which is
the summation of activity strengths evoked by odor-
ants, u
j
is the activity of the jth neuron unit, T, B, and
L are constant coefficients, H
j
is the inhibitory input
adjusted by the output layer, and w
j
′
j
is the weight co-
efficient representing the on-center/off-surround con-
nections as follows;
w
j
′
j
=
W, d < D
e
−W, D
e
< d < D
i
0, d > D
i
. (3)
Here, W is a constant, d is the distance between the
units, calculated from their corresponding locations
on the glomeruli, and the coefficients D
e
and D
i
de-
note the maximum distances of the on-center excita-
tory connections and off-surround inhibitory connec-
tions that exist, respectively. u
j
at the equilibrium
point (˙u
j
= 0) is then
u
j
=
BI
j
T +
∑
D
e
<d<D
i
WI
k
−
∑
d<D
e
WI
k
− H
j
; (4)
thus, u
j
is normalized by the total input of neuron
units in the region D
e
< d < D
i
and is enhanced by
those in the region d < D
e
.
Finally, the output layer calculates the sum of the
outputs from the olfactory bulb layer as follows:
u
p
=
∑
j
w
jp
f(u
j
), (5)
f(x) =
1
1+ exp[−g(x− θ
p
)]
, (6)
where w
jp
is the weight coefficient, and g and θ
p
are
the gain and threshold constants of the sigmoid func-
tion, respectively. Because the output u
p
is the cal-
culated inner product between the stored pattern and
input pattern when an activity pattern is stored in w
jp
,
u
p
is defined as the correspondence with the stored
odor.
4.2 Proposed Attention Process
To implement the hypothesis that a window extracts a
local activity pattern for attention, the weight coeffi-
cient w
jp
is determined as follows:
w
jp
=
0, u
j
(O
r
) < θ
U
1/P, u
j
(O
r
) ≥ θ
U
, (7)
where O
m
represents a rewarded odor such as [IA,
Ci, EB] used in the odor discrimination experiment.
u
j
(O
r
) is then the activity pattern of the olfactory bulb
layer evoked by odor O
r
, θ
U
is the threshold constant
for u
j
, and P is the total number of neuron units in
the olfactory bulb layer whose output is greater than
θ
U
. This allows the output layer to compare the activ-
ity patterns by focusing only on the part activated by
odor O
r
, which is expressed in the window of atten-
tion.
As observed in the odor discrimination experi-
ment, attention can cause incorrect discrimination. In
this case, the window has to be changed. To model
this function, we apply the inhibitory input H
j
to the
olfactory bulb layer when an odor different from the
rewarded odor generates a high output for u
p
. The
inhibitory input H
j
is thus determined as follows:
H
j
=
βu
j
, u
p
< θ
P
and u
j
(O
r
) ≥ θ
U
0, otherwise
, (8)
NCTA 2011 - International Conference on Neural Computation Theory and Applications
186
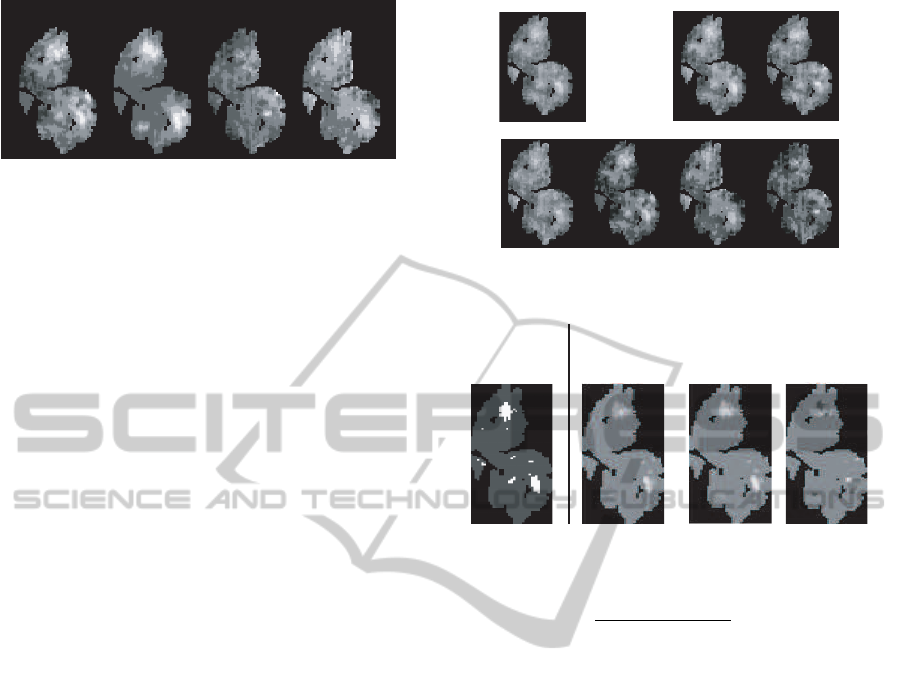
[IA] [EB] [Ci] [Li]
Figure 5: Glomerular activity patterns evoked by the odor-
ants in odor discrimination experiments.
where θ
P
is the threshold constant for u
p
, and β is a
gain coefficient used to determine the strength of H
j
.
This configuration generates new activity by turning
off inhibition from off-surround connections, and the
activity produces a new window in accordance with
Equation 7.
5 SIMULATION
5.1 Simulation Procedure
The model was validated by performing two sets of
discrimination experiments. First, the parameters of
the model were adjusted manually in accordance with
the experimental results when a combination of IA,
EB, and Ci was used. The parameters were then vali-
dated by comparison with another set of experimental
results using the odorants IA, linaool (Li), and Ci. Fi-
nally, the ability to change the attention window was
also investigated.
As the input to the model, we used mea-
sured glomerular activity patterns evoked by the
odorants in the odor discrimination experiment.
These were obtained from the database website
http://gara.bio.uci.edu/,where the activity patterns are
provided as unrolled maps of the spherical surface of
the olfactory bulb as shown in Figure 5. However,
since the activity pattern for odorant Ci was not in the
database, we used the activity pattern predicted from
a glomerular activity prediction model (Soh et al.,
2011). Figure 5 shows the activity patterns for each
odorant.
A comparison between the simulation and exper-
imental results was carried out by defining a metric
corresponding to the correct discrimination rate ob-
tained from the experiment on mice described in Sec-
tion 2. As mentioned in the previous section, the out-
put u
p
represents the correspondence with the stored
pattern in weight coefficient w
j
p; we thus used the
following metric to represent the correct discrimina-
tion rate:
VS
[IA,EB,Ci] [IA,EB] [IA,Ci]
[EB,Ci]
[IA]
[Ci]
[EB]
Figure 6: Activity patterns on the olfactory bulb layer for
each odorant obtained by simulation.
Attention
window
(wjp)
Filtered
[IA,EB,Ci]
Filtered
[IA,EB]
Filtered
[Ci]
vs
Figure 7: Attention window and activity patterns filtered by
the window.
r =
u
p
(O
r
)
u
p
(O
r
) + u
p
(O
u
)
, (9)
where u
p
(O
r
) is the output of the rewarded odor and
u
p
(O
u
) is that of the unrewarded odor. The param-
eters were thus adjusted to fit r with the correct dis-
crimination rate.
5.2 Results
First, the parameters were adjusted. Similarly to in
the odor discrimination experiment, odor [IA, EB, Ci]
was used as the rewarded odor. As a result of simu-
lation, the activity patterns of the olfactory bulb layer
shown in Figure 6 were obtained. In addition, Figure
7 shows the attention window, represented by white
spots generated by the model, and examples of ac-
tivity patterns on the olfactory bulb layer filtered by
the attention window. This figure demonstrates how a
comparison between odors can be made by focusing
on the window generated by the model.
Figure 8 shows the values of r obtained from the
model with adjusted parameters and the correct dis-
crimination rate against each odorant. This figure
confirmed that r and the correct discrimination rate
have a similar tendency, for example, the lowest cor-
rect discrimination rate was observed when odor [IA
EB] was the unrewarded odor. These results con-
firmed that the model focused attention on the activity
ON-CENTER/OFF-SURROUND NEURAL NETWORK MODEL FOR OLFACTORY ATTENTION
187
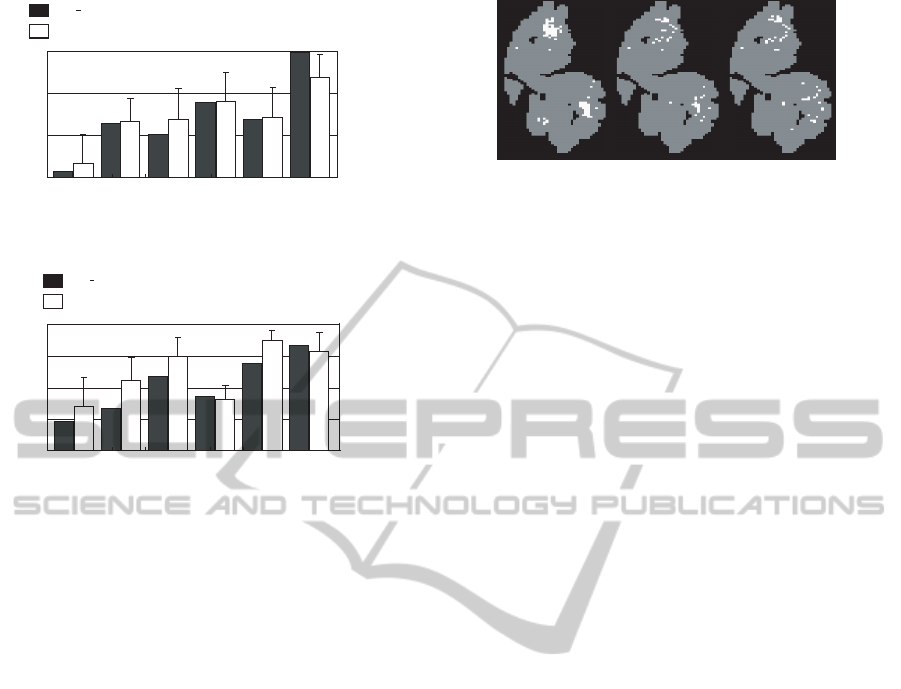
r
Correct discrimination
rate %
0.4
0.6
0.8
1
[IA,EB] [IA,Ci] [EB,Ci] [IA] [EB] [Ci]
40
60
80
100
Simulation result of the model
Average correct discrimination rate of mice
Figure 8: Comparison of attention between model and mice.
(rewarded odor: IAEBCi).
r
Correct discrimination
rate %
0.2
0.4
0.6
0.8
1
[IA,Li] [IA,Ci] [Li,Ci] [IA] [Li] [Ci]
20
40
60
80
100
Simulation result of the model
Average correct discrimination rate of mice
Figure 9: Comparison of attention between model and mice.
(rewarded odor: IALiCi).
evoked by [IA EB], as observed in the odor discrim-
ination experiment. The adjusted parameters were as
follows.
• Olfactory bulb layer
T = 0.1, B = 2.0,
D
e
= 3.0, D
i
= 10.0, W = 0.012
• Output layer
g = 0.03,θ
p
= 0.7
Using the adjusted parameters, a simulation was
performed with another odor set, where odor [IA, Li,
Ci] was used as the rewarded odor. Figure 9 shows
the values of r obtained from the model and the cor-
rect discrimination rate of mice against each odorant.
From the figure, we can confirm that the proposed
model and the mice have a similar tendency that both
focused attention on odorant [IA].
We then tested the ability to change the attention
window by applying an inhibitory input H
j
to the ol-
factory bulb layer. Since the discrimination ability of
the mice improvedin the later 12 trials as described in
Section 2, we also investigated whether the value of r
increases when the attention window is changed. For
this simulation, we set [IA, EB, Ci] as the rewarded
odor. Figure 10 shows the changes in the attention
window with increasing strength of the inhibitory in-
put (parameter β). From the figure, we can confirm
that the window changed with increasing β. We also
confirmed that when β was increased from 0 to 0.3,
r increased from approximately 0.48 to 0.72. These
results confirmed the ability to change the attention
=0.2
=0.3=0.1
β
β β
Figure 10: Changes in attention window (white spots).
window, as observed in the odor discrimination ex-
periment on mice.
6 CONCLUSIONS
We proposed an attention model for the olfactory sys-
tem assuming the existence of an attention window
generated by normalization and contrast enhancement
processes in the olfactory bulb. A possible learning
mechanism was also proposed in which an inhibitory
signal is applied to the olfactory bulb, which modifies
the attention window. Although the model only con-
sidered the macroscopic structure of the olfactory sys-
tem, a comparison with the correct discrimination rate
of mice confirmed the attention ability of the model.
The correct discrimination rate can also be inter-
preted in terms of the perceptual characteristics of
mice as the Y-maze experiment is a type of sensory
evaluation assay. The proposed model can thus be ap-
plied as an artificial sensory evaluation method. As a
future work we are planning to increase the odorant
set to validate and improve the model. We are also
considering applying the model to predict the percep-
tual characteristics of human olfaction.
ACKNOWLEDGMENTS
This work was supported by Grant-in-Aid for
Japan Society for the Promotion of Science Fellows
(23·10869).
REFERENCES
Broadbent, D. E. (1958). Perception and Communication.
New York: Pergamon.
Buck, L. and Axel, R. (1991). A novel multigene family
may encode odorant receptors: a molecular basis for
odor recognition. Cell, 65:175–187.
Cleland, T. A. and Sethupathy, P. (2006). Non-
topographical contrast enhancement in the olfactory
bulb. BMC Neurosci, 7:7.
NCTA 2011 - International Conference on Neural Computation Theory and Applications
188

Dayan, P., Kakade, S., and Montague, P. R. (2000). Learn-
ing and selective attention. Nature Neuroscience,
3:1218–1223.
Grossberg, S. (1976). Adaptive pattern classification and
universal recoding: I. parallel development and cod-
ing of neural feature detectors. Biol. Cybern., 23:121–
134.
Heimer, L. (1968). Synaptic distributions of centripetal
and centrifugal nerve fibres in the olfactory system of
the rat. an experimental anatomical study. Journal of
Anatomy, 103:413–432.
Hillyard, S. A., Vogel, E. K., and Luck, S. J. (1998).
Sensory gain control (amplification) as a mechanism
of selective attention: Electrophysiological and neu-
roimaging evidence. Philos Trans R Soc Lond B Biol
Sci., 353:1257–1270.
Johnson, B. A. and Leon, M. (2000). Modular represen-
tations of odorants in the glomerular layer of the rat
olfactory bulb and the effects of stimulus concentra-
tion. J Comp Neurol, 422:496–509.
Li, Z. and Hertz, J. (2000). Odour recognition and segmen-
tation by a model olfactory bulb and cortex. Network,
11:83–102.
Mori, K., Takahashi, Y. K., Igarashi, K. M. ., and Yam-
aguchi, M. (2006). Maps of odorant molecular fea-
tures in the mammalian olfactory bulb. Phys. Rev.,
86(2):409–433.
Ruesch, J., Lopes, M., Bernardino, A., Hornstein, J.,
Santos-Victor, J., and Pfeifer, R. (2008). Multimodal
saliency-based bottom-up attention a framework for
the humanoid robot icub. IEEE International Confer-
ence on Robotics and Automation, pages 962–967.
Soh, Z., Tsuji, T., Takiguchi, N., and Ohtake, H. (2009).
Neuro-based olfactory model for artificial organolep-
tic tests. Artificial Life and Robotics, 14:474–479.
Soh, Z., Tsuji, T., Takiguchi, N., and Ohtake, H. (2011). An
artifcial neural network approach for glomerular ac-
tivity pattern prediction using the graph kernel method
and the gaussian mixture functions. Chem. Sens., page
in press.
Takiguchi, N., Okuhara, K., Kuroda, A., Kato, J., and
Ohtake, H. (2008). Performance of mice in discrimi-
nation of liquor odors: Behavioral evidence for olfac-
tory attention. Chem. Sens., 33:283–290.
Vijayakumar, S., Conradt, J., Shibata, T., and Schaal,
S. (2001). Overt visual attention for a humanoid
robot. IEEE/RSJ International Conference on Intel-
ligent Robots and Systems, 4:2332–2337.
ON-CENTER/OFF-SURROUND NEURAL NETWORK MODEL FOR OLFACTORY ATTENTION
189
