
TRADING FOREIGN CURRENCY USING ARTIFICIAL NEURAL
NETWORK STRATEGIES
Bruce Vanstone and Gavin Finnie
School of IT, Faculty of Business, Bond University, Gold Coast, Australia
Keywords: Financial trading, Foreign currency, Artificial neural networks.
Abstract: The foreign exchange (FX) markets represent an enormous opportunity for traders. These markets have
huge liquidity, trade 24 hours a day (except weekends), and allow the use of leverage. This paper takes a
simple FX trading strategy and shows how to substantially improve it, using a neural network methodology
originally developed by Vanstone & Finnie for creating and enhancing stockmarket trading systems. This
result demonstrates the important role neural networks have to play within complex and noisy
environments, such as that provided by the intraday FX markets.
1 INTRODUCTION
The FX markets are designed to assist international
trade and investment, by allowing participants to
easily convert one currency into another at an agreed
rate. Although this is the primary purpose of the FX
markets, they also provide an outstanding
opportunity for currency speculators.
The FX markets currently have a daily turnover
of approximately $4 trillion (BIS, 2010). They trade
24 hours a day (except weekends) around the globe,
with focus shifting between different geographical
regions in accordance with the business hours of
those regions.
FX markets are particularly attractive to short-
term speculators due to their high liquidity, their use
of leverage, and their low transaction costs. Further,
there are a number of software products which allow
high-frequency and intraday traders to trade the
markets algorithmically. This allows these traders to
exploit price changes in very small timeframes.
This paper focuses on an existing methodology
for creating and enhancing trading strategies both
with and without soft computing, developed by
Vanstone & Finnie (Vanstone and Finnie, 2009).
Using this methodology, we create a neural network
to enhance a simple FX intraday breakout trading
strategy. The original strategy and the ANN
enhanced version are comprehensively benchmarked
both in and out-of-sample, and the superiority of the
ANN enhanced version is demonstrated.
2 REVIEW OF LITERATURE
Traditional financial models have difficulty
explaining the gap between financial theory and
practice. In theory, exchange rate determination is
based on rational expectations and efficient markets,
with publicly available information being the major
influence on longer term price structures. However,
this view leaves no role for the behavior of traders to
influence market prices.
From a market microstructure point of view,
research has found that trading is an important factor
in the price formation process (Love and Payne,
2009), and a number of trading behaviours such as
‘herd behaviour’ and ‘over(under)-reaction’ have
been documented (see, for example: (Kirman, 1995),
(Carpenter and Wang, 2007), (Serban, 2010)). At
short time horizons, there remains no well accepted
model of exchange rate determination.
According to the Bank for International
Settlements (BIS, 2010), the FX ‘spot’ market size is
approximately $1.5 trillion and has a high turnover
largely due to more active trading. This suggests that
as much as 37.5% of the FX markets are being
actively traded in the shorter term, even though there
is no well accepted model of short term exchange
rate determination.
In practice, most traders rely on Technical
Analysis to make trading decisions. Technical
Analysis provides a framework based on price, price
movements, and price patterns. Research shows that
163
Vanstone B. and Finnie G..
TRADING FOREIGN CURRENCY USING ARTIFICIAL NEURAL NETWORK STRATEGIES.
DOI: 10.5220/0003679601630167
In Proceedings of the International Conference on Neural Computation Theory and Applications (NCTA-2011), pages 163-167
ISBN: 978-989-8425-84-3
Copyright
c
2011 SCITEPRESS (Science and Technology Publications, Lda.)

nearly all traders in the FX markets use technical
analysis, particularly for trading in the shorter
timeframes (Cross, 1998); (Menkhoff and Taylor,
2007).
As the majority of traders in the shorter term FX
markets are employing algorithmic trading models,
and most base their decision frameworks on
Technical Analysis, it is appropriate to select a
strategy which selects trading opportunities solely
based on price movement. For this reason, a simple
price based strategy is used in this paper.
Breakout trading is one simple method short
term traders use to capture profits in the FX market.
Essentially, breakout traders wait for price to break
above some previously defined threshold and they
use this breakout as the signal to enter a trade.
Although many good opportunities are signaled
by breakout rules, a large number of breakouts
quickly fail. The difficulty for traders is to assess
which breakouts are likely to continue, and which
are likely to fail. This is a forecasting function, and
is ideally suited to an Artificial Neural Network
(ANN).
ANNs have long been used within the trading
and investment community to assist with making
decisions in complex, non-linear, and noisy
environments. A comprehensive review of the ways
that ANNs have assisted traders build profitable
trading models is available in Vanstone et al
(Vanstone and Tan, 2003).
3 METHODOLOGY
The most heavily traded currency in FX markets is
the EURUSD pair (Euro dollar, quoted in US
Dollars), which accounts for approximately 28% of
the spot market (BIS, 2010), and data for this pair is
used in the paper. Given the incredible turnover and
importance of this currency pair, it should be one of
the most ‘efficient’ securities in existence.
The software used to conduct the testing of
trading strategies, and the creation of the neural
networks is Wealth-Lab Developer 6 (2011).
For the neural network part of this study, the data
is divided into two partitions: data from 01/01/2000
up to and including 31/12/2005 (in-sample) is used
for training the networks, which are then tested over
the period 01/01/2006 to 30/04/2011 (out-of-
sample).
A primary difficulty with breakout strategies is
determining which breakouts are likely to be
sustained and hence lead to a profitable outcome, as
compared to those which quickly fail and lead to an
unprofitable outcome. This is the specific issue that
the ANNs in this paper are designed to address.
As this paper is focused on high-frequency
currency trading, the system developed is designed
to be run in the 1-hourly timeframe, and aims to hold
trades open for up to 12 hours. For the simple
breakout system, the rule to buy (sell) is price
closing above (below) the high (low) of the last 8
hours.
Creation of ANNs to enhance simple breakout
trading systems involves the selection of ANN
inputs, outputs and various architecture choices.
Each of these areas is discussed in more detail
below.
3.1 Selection of Inputs
As the final trading system is to be run in a high-
frequency format, the primary choice of variables
are those produced directly from price data, namely,
Technical Variables. Among this group, support has
been found for Moving Averages of various lengths
(Preen, 2010); (Dewachter, 2001); (Levich and
Thomas, 1993); (Schulmeister, 2008)), MACD
((Preen, 2010)) and Stochastics (Preen, 2010).
These variables are ideal for use within a neural
network as they are easily calculated, and react
immediately to changes in price. The values of these
variables are sampled every hour.
The three input variables chosen and their
formula are:
1. EMA(Period)
EMA = ( K x ( C - EMA
1
) ) + EMA
1
(1)
where
C = Current Price,
EMA
1
= Previous EMA value,
K = 2 / ( 1 + period )
2. MACD
MACD = EMA(12) – EMA(26) (2)
3. Stochastic(K,N)
Stochastic = SMA(StochK, N) (3)
where
N = the smoothing period,
SMA = Simple Moving Average,
StochK = (C-L(K)) / (H(K)-L(K))*100,
C = closing price,
L(K), H(K) = the lowest low (highest high) in
K periods
NCTA 2011 - International Conference on Neural Computation Theory and Applications
164

The statistical properties of these inputs is shown
in Table 1.
Table 1: Statistical Properties of Input Variables.
Variable Min Max Mean StdDev
EMA 99.70 100.49 100.07 0.09
MACD -0.44 0.58 0.06 0.13
Stochastic 34.96 99.48 79.48 11.19
3.2 Selection of Outputs
The neural networks built in this study were
designed to produce an output signal, whose strength
was proportional to expected returns over the
forward 12-hourly timeframe. In essence, the
stronger the signal from the neural network the
greater the expectation of a successful trading
outcome within the next 12 hours. Signal strength
was normalized between 0 and 100.
The target is initially calculated as the maximum
percentage price change over the next 12 hours,
computed for every element (i) in the input series as:
(Highest(close
(i+12)
…Close
(i)
)-Close
(i)
) * 100 / Close
(i)
(4)
This allows the neural network to focus on the
relationship between the input technical variables,
and the expected forward price change. When the
value of the forward price change is positive, the
neural network target is set to 100, otherwise it is set
to 0.
3.3 Architecture Choices
In accordance with the design methodology of
Vanstone & Finnie (Vanstone and Finnie, 2009), a
number of hidden node architectures need to be
created, and each one is benchmarked against the in-
sample data.
The initial ANN is created and benchmarked
with SQRT(n) hidden nodes, where n is the number
of input variables. The number of hidden nodes is
then increased by one for each new architecture
created, until in-sample testing reveals which
architecture has the most suitable in-sample metrics.
A number of metrics are available for this purpose,
in this paper, the architectures are benchmarked
using the absolute profit per hour method. This
method assumes unlimited capital, takes every trade
signalled, and measures how much average profit is
added by each trade over its lifetime.
4 RESULTS
In the in-sample data, there were 2809 rows selected
for training (one row for each occurrence of the
price closing above the previous 8 hour highs).
Table 2 benchmarks the basic trading characteristics
of these rows. These figures are for trading 5
standard contracts ($100,000 euro), and include
typical transaction costs (2011).
The most important parameter to be chosen for
in-sample testing is the signal threshold, that is, what
level of forecast strength is enough to encourage the
trader to open a position. This is a figure which
needs to be chosen with respect to the individuals
own risk appetite, and trading requirements. A low
threshold will generate many signals, whilst a higher
threshold will generate fewer. Setting the threshold
too high will mean that trades will be signalled only
rarely, too low and the traders’ capital will be
quickly invested, removing the opportunity to take
higher forecast positions as and when they occur. As
the ANN forecast is allowed to range between 0 and
100, a value of 50 is chosen. This choice is strictly
arbitrary, and represents an attempt to match the
quality of the trading signals generated to an
individual’s unique risk appetite. Whilst a more
‘scientific’ method could be used to determine the
optimum threshold, it is unlikely that the one fixed
value threshold would be ‘best’ for different traders.
As traders are individuals working under tightly
managed risk conditions, it seems important to allow
the flexibility to balance the risk within the signal
generating process to the specific risk a trader
wishes to adopt. This is not a decision which can be
taken in isolation from the rest of the trading
activities in which the individual is involved.
Table 2: In-sample benchmarks.
Strategy
Profit per
hour
Win %
Avg. Profit
per Trade
Hours trade
open
Simple
Breakout
$5.87 39.98% $137.83 23.41
ANN – 2
hidden
nodes
$22.39 52.44 % $269.24 12.03
ANN – 3
hidden
nodes
$20.82 53.03 % $189.68 9.11
As described in the empirical methodology, it is
necessary to choose which ANN is the ‘best’, and
this ANN will be taken forward to out-of-sample
testing. It is for this reason that the trader must
choose the in-sample benchmarking metrics with
TRADING FOREIGN CURRENCY USING ARTIFICIAL NEURAL NETWORK STRATEGIES
165
care. If the ANN is properly trained, then it should
continue to exhibit similar qualities out-of-sample to
those which it already displays in-sample.
From the above table, it is clear that ANN – 2
hidden nodes should be selected, as it extracts the
highest amount of profit per hour. Note that this will
not necessarily make it the best ANN for a trading
system. Extracting good profits in a short time
period is only a desirable trait if there are enough
opportunities being presented to ensure the traders
capital is working efficiently.
The testing so far covered in-sample data
previously seen by the ANN, and is a valid
indication of how the ANN can be expected to
perform in the future. In effect, the in-sample
metrics provide a framework of the trading model
this ANN should produce.
Table 3 shows the effect of testing on the out-of-
sample data, and includes the effects of the global
financial crisis. As such, these out-of-sample figures
provide an unusual opportunity to see how this
neural network trading system behaved out-of-
sample under extremely challenging conditions.
Table 3: Out-of-sample benchmarks.
Strategy Profit per hour Win %
Avg. Profit
per Trade
Hours trade
open
Simple
Breakout
$5.33 39.11 % $113.81 21.37
ANN – 2
hidden
nodes
$ 21.77 51.72 % $226.09 10.39
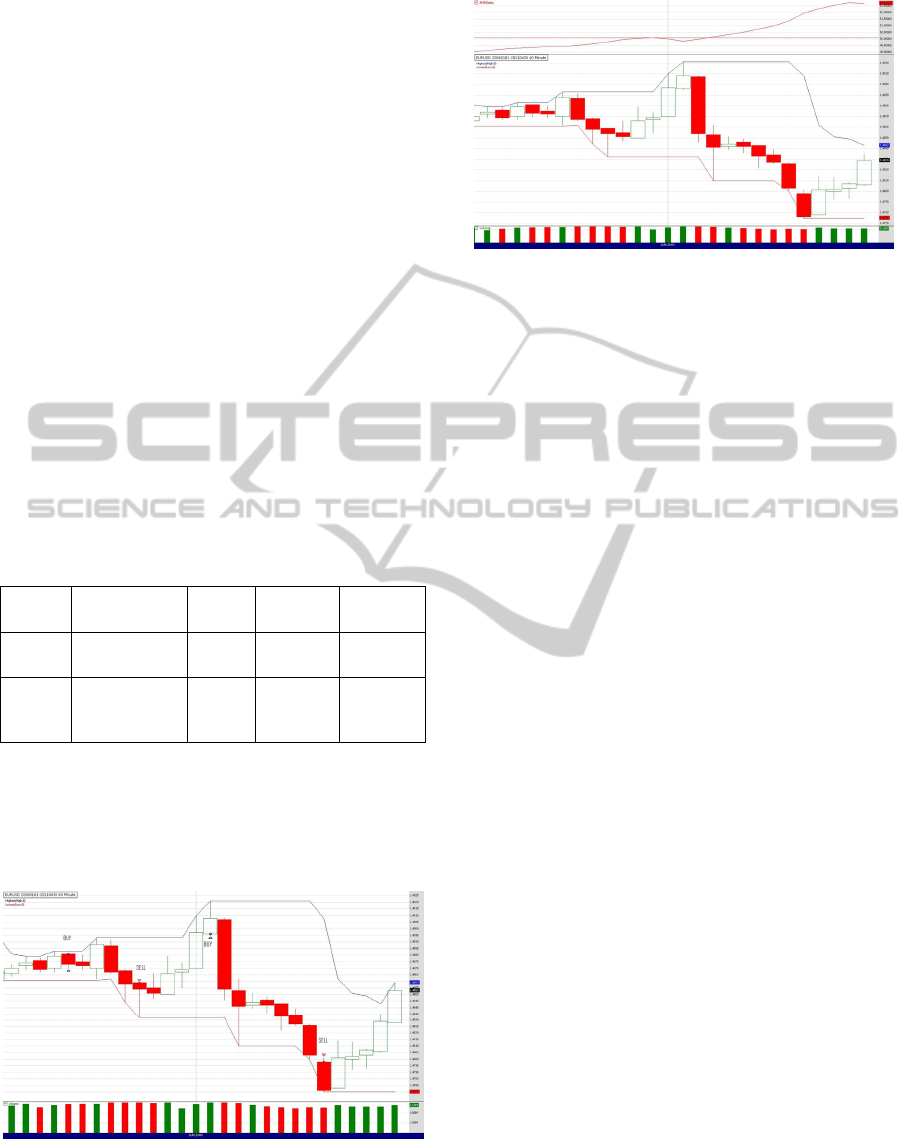
Figures 1 and 2 both show the same trading
timeframe. Figure 1 shows the trades the initial
strategy took, whilst figure 2 shows the ANN
enhanced strategy avoiding these trades due to the
signal threshold being below 50.
Figure 1: Example trades from initial system.
Figure 2: ANN enhanced system avoids these losing
trades.
5 CONCLUSIONS
The ANN based trading system has performed
remarkably robustly, as the out-of-sample
performance is remarkably close to the in-sample
performance, leading to the conclusion that the ANN
is not curve-fit, and should continue to perform well
into the future.
Unfortunately, there are no well accepted models
of exchange rate determination over shorter term
horizons, so it is not feasible to compare the result to
other commonly accepted shorter term trading
models, as there are none. In many ways, this lack of
viable, accepted shorter term models is an indication
of the difficulty of shorter term trading.
6 FUTURE WORK
This paper has demonstrated the process of creating
a neural network to support a high-frequency foreign
currency trading system. As it currently stands, this
trading system only signals when to take long
positions. Trading short is also quite common in the
FX markets, as it allows traders to trade against a
currency when they wish. Future work for this
system is to develop a neural network to support
short side breakout trading.
The choice of the length of the breakout
parameter is fixed (and arbitrary). It is expected that
a parameter that is dynamic would be of further
benefit, and this is also further work for this style of
trading.
Further, the variables used as inputs to the neural
network are by no means comprehensive within the
domain of technical analysis, and a more detailed
review of likely variables of influence needs to be
NCTA 2011 - International Conference on Neural Computation Theory and Applications
166

conducted within the chosen instruments and
timeframes.
Finally, there are a number of other instruments,
particularly other highly liquid currencies and index
futures, which appear to lend themselves to this style
of short-term trading. Further work would be to
extend this work across these other securities.
REFERENCES
(2011). from (Interactive Brokers Commissions)
http://www.interactivebrokers.com/en/p.php?f=commi
ssion.
(2011). "Wealth-Lab." from www.wealth-lab.com.
BIS (2010) "Triennial Central Bank Survey: Foreign
exchange and derivatives market activity in April
2010: Preliminary Results." September 2010, Bank for
International Settlements, Monetary and Economic
Department, 1-21.
Carpenter, A. and J. Wang, (2007). "Herding and the
information content of trades in the Australian dollar
market." Pacific-Basin Finance Journal 15(2): 173-
194.
Cross, S. Y., (1998). All about...The Foreign Exchange
Market in the United States, Federal Reserve Bank of
New York.
Dewachter, H., (2001). "Can Markov switching models
replicate chartists profits in the foreign exchange
market?" Journal of International Money and Finance
20: 25-41.
Kirman, A., (1995) "The behaviour of the foreign
exchange market." Bank of England Quarterly
Bulletin.
Levich, R. M. and L. R. Thomas, (1993). "The merits of
active currency risk management: Evidence from
international bond portfolios." Financial Analysts
Journal 49(5): 63-70.
Love, R. and R. Payne, (2009). "Macroeconomic news,
order flows, and exchange rates." Journal of Financial
and Quantitative Analysis 43(2): 467-488.
Menkhoff, L. and M. P. Taylor, (2007). "The Obstinate
Passion of Foreign Exchange Professionals: Technical
Analysis." Journal of Economic Literature 45(4): 936-
972.
Preen, R., Ed., (2010). Identifying Trade Entry and Exit
Timing Using Mathematical Technical Indicators in
XCS Lecture Notes in Computer Science.
Schulmeister, S. (2008). "Components of the profitability
of technical currency trading." Applied Financial
Economics 11: 917-930.
Serban, A. F., (2010). "Combining mean reversion and
momentum trading strategies in foreign exchange
markets." Journal of Banking and Finance 34(11):
2720-2727.
Vanstone, B. and G. Finnie, (2009). "An Empirical
Methodology for developing Stockmarket Trading
Systems using Artificial Neural Networks." Expert
Systems with Applications 36: 6668-6680.
Vanstone, B. and C. N. W. Tan, (2003). A Survey of the
Application of Soft Computing to Investment and
Financial Trading. 8th Australian & New Zealand
Intelligent Information Systems Conference (ANZIIS
2003), Sydney.
TRADING FOREIGN CURRENCY USING ARTIFICIAL NEURAL NETWORK STRATEGIES
167
