
INTEGRATION OF PROFILE IN OLAP SYSTEMS
Rezoug Nachida
1
, Omar Boussaid
2
and Fahima Nader
3
1
Science Faculty, Blida University, 42 Logts, Blida, Algeria
2
Department of Computing Science, Lyon 2 University, Lyon, France
3
ESI Institute, Algiers, Algeria
Keywords: Personalization, Recommendation, Profile, Data-warehouses, Machine-learning, Data-mining.
Abstract: OLAP systems facilitate analysis by providing a multidimensional data space which decision makers
explore interactively by a succession of OLAP operations. However, these systems are developed for a
group of decision makers or topic analysis "subject-oriented", which are presumed, have identical needs. It
makes them unsuitable for a particular use. Personalization aims to better take into account the user; first
this paper presents a summary of all work undertaken in this direction with a comparative study. Secondly
we developed a search algorithm for class association rules between query type and user (s) to deduce the
profile of a particular user or a user set in the same category. These will be extracted from the log data file
of OLAP server. For this we use a variant of prediction and explanation algorithms. These profiles then
form a knowledge base. This knowledge base will be used to generate automatically a rule base (ACE), for
assigning weights to the attributes of data warehouses by type of query and user preferences. More it will
deduce the best contextual sequence of requests for eventual use in a recommended system.
1 INTRODUCTION
The OLAP applications are built to perform
analytical tasks within large amount of
multidimensional data. During working sessions
with OLAP applications the working patterns can be
various. Due to the large volumes of data the typical
OLAP queries performed via OLAP operations by
users may return too much information that
sometimes makes further data exploration burdening
or even impossible.
During an OLAP session, the user may not
exactly know what she is looking for. The reasons
behind a specific phenomenon or trend may be
hidden, and finding those reasons by manually
applying different combinations of OLAP operators
may be very frustrating. Preferences enable users to
specify the pattern she is searching for. Since
preferences express soft constraints, the most similar
data will be returned when no data exactly match
that pattern. From this point of view, preference
queries can be regarded as a basic OLAM (OnLine
Analytical Mining) technique. How to deduce
preferences of the user? That’s the question?
Unfortunately, until now user profile and more
accurately preferences are expressed explicitly by
the user. Personalization has been intensively
studied by information retrieval, information
systems, and human-machine interface or in the
contextual databases. In the context of data
warehouses, this is an emerging theme.
1.1 Context and Motivations
Decision-support systems intend to help knowledge
workers (executives, managers, etc.) make strategic
business decisions. As enterprises face competitive
pressure to increase the speed of decision making,
the decision-support systems must evolve to support
new initiatives, such as providing a personalized
information access and helping users quickly find
relevant data.
Personalization of Olap systems is one way to
meet this need. It is the approach of providing an
overall customized, individualized user experience
by taking into account the needs, preferences and
characteristics of a user or group of users (Ioannidis
et al., 2005). A profile includes a set of
characteristics used to configure (Explicit
implication of user) or adapt (Implicit implication of
user) the system to the user, to provide more
appropriate responses (Korphage, 1997). It has been
320
Nachida R., Boussaid O. and Nader F..
INTEGRATION OF PROFILE IN OLAP SYSTEMS.
DOI: 10.5220/0003669103120324
In Proceedings of the International Conference on Knowledge Discovery and Information Retrieval (KDIR-2011), pages 312-324
ISBN: 978-989-8425-79-9
Copyright
c
2011 SCITEPRESS (Science and Technology Publications, Lda.)
proposed to characterize a profile according to user
involvement and system functions (Bouzeghoub et
al., 2005). If explicit involvement, the user must
make interactions with the system while in an
implicit involvement, the system automatically
adapts to the user. The system functions related to
the profile are to define the profile, then exploit it for
a better consideration of the user. From these
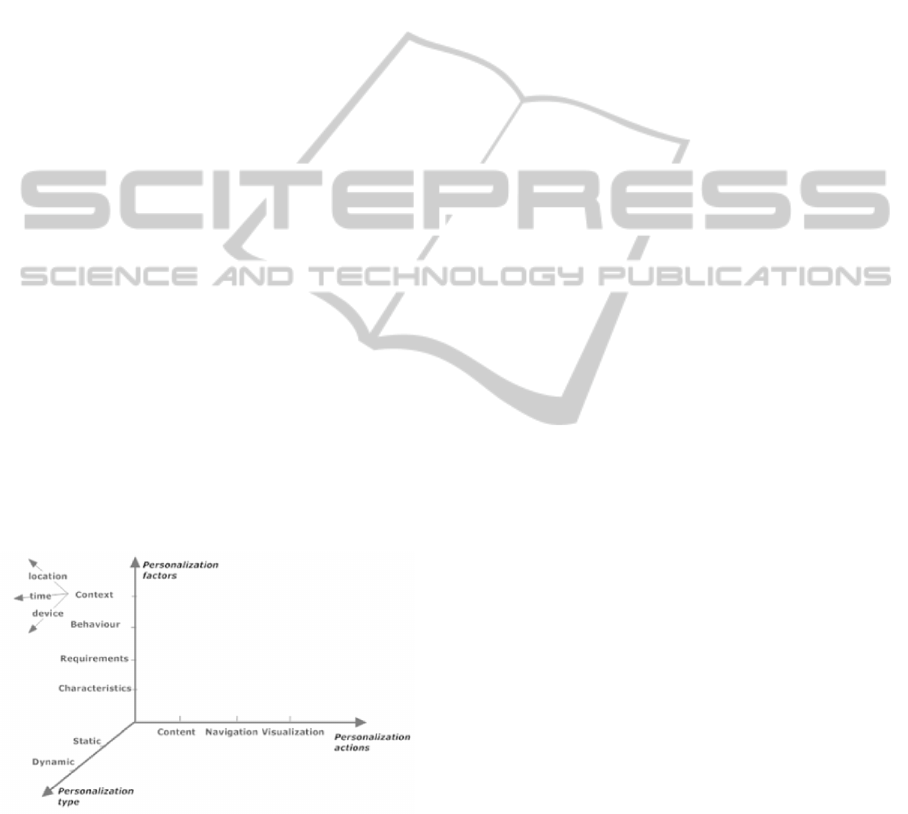
characteristics, the following figure describes the
principles involved in personalization.
Figure 1: Personalization principles.
Exploitation of profile can require explicit user
intervention which changes the system by choosing
recommendations, or induce an automatic
transformation system.
While personalization has been the subject of
various studies in information retrieval and
databases (Ioannidis et al., 2005), very few
proposals aimed at personalize OLAP systems
(Rizzi, 2007); (Bentayeb et al., 2009). The following
table provides an overview of some existing works.
Table 1: Research summary of personalization on Olap
systems.
References Profile Definition Profile
Exploitation
(Sapia et
al., 2000)
Explicit Transformation
(Espil et al.,
2001)
Explicit Transformation
(Favre et
al., 2007)
Explicit Transformation
(Bentayeb
et al., 2007)
Explicit Transformation
(Bellatreche
et al., 2005)
Explicit Transformation
(Giacometti
et al., 2008)
Implicit Recommendation
(Jerbi et al.,
2008)
Explicit Recommendation
We note that the most of the works aim the
transformation of OLAP system based on user
preferences explicitly collected. Only work of
(Giacometti et al., 2008)
recommends queries using
the history of navigation performed by a group of
users.
Several OLAP approaches provide personalized
views to the decision makers focusing on different
aspects (see Sect. 3 for details). However, none of
them personalize schemas at the conceptual level.
This may cause several problems like difficult
maintenance, no independence of the target
platform, evolution of the information requirements,
etc. Furthermore, none of these approaches allows to
apply personalization at runtime taking into account
the user behaviour, but only preferences over data
stated at design time. Also, current commercial
OLAP tools (e.g., Oracle Discoverer or Pentaho
Mondrian) take the whole multidimensional schema
of the underlying data warehouse as an input and
allow designers to customize it by specifying which
elements of a sort are preferred over their peers.
The main drawback of this way of proceeding is
that designers have to customize the schema
manually, being prone to mistakes and time
consuming.
To meet the challenges of more user-centered
decision-support systems, OLAP tools are to be
extended with preference mining techniques for
detecting partial preferences in user log. These
techniques must: 1) elicit user preferences; and 2)
discover mappings that associate the user
preferences to their related analysis contexts.
1.2 Aims and Contributions
In order to make the analysis easy for a user, we
attend to inject in the analysis process his
preferences implicitly. Then, the problem we
address in this paper: how to help the user to design
his preferences without his intervention.
As an answer, we propose to exploit his or the
other user former navigations in the cube, and to use
this information as basis for extracting his
preferences in term of attributes or dimensions. To
this we present a personalized OLAP system that
uses both the log server, i.e., the set of former
sessions on the cube, and the sequence of queries of
the current session.
The personalized OLAP system relies on the
following process:
• Partitioning the log to classes where witch of
them contains the queries of users having same
preferences or grouped sessions of the same user.
• Predicting his preferences for each dimensions
and type of analysis query (display, rotate, drill-
dow, rollup .......) with using data mining
methods.
Learning
Setup
Profile definition
Transformation
Recommendation
Profile Exploitation
User implication
Implicit
Explicit
System
functio
n
INTEGRATION OF PROFILE IN OLAP SYSTEMS
321

• Integration of his preferences in queries of
current session with using rule base basis on
ECA.
• Execution of personalized queries.
Our contributions include the presentation of
how deducing contextual minimum weight of each
attribute per type of analysis query. These weights
depend on user context analysis (per fact, dimension,
and hierarchy). That is going to introduce a model of
user preferences in OLAP that depend on the
analysis.
The remainder of the paper is organized as
follows: section 2 presents the formal definitions;
section 3 present an overview of personalized
approaches in Olap system; section 4 introduces our
personalized Olap system. Section 5 presents our
experimental results. Finally section 6 concludes the
paper with directions for future research.
2 BASIC DEFINITIONS
In this section we give the basic definitions
underlying our approach. Let R be a relation
instance of schema sh
2.1 Cube and Dimensions
An N-Dimensional cube C is a tuple
=<
,……..
,> where:
• For ∈
1,
,is a dimension of
schemaℎ
(
)
=
,……
. For every
dimension ∈
1,
,each attributes
desribes a
level of hierarchy, j being the depth of this level.
• F is a fact table of schema
sch(F)={
,……
,} where m is a measure of
attribute.
In the following, note that the name of a
dimension , i∈
1,
is also used to denote an
attribute of active domain
(
)
=
⋃
(
).For every ∈
1,
,
(
)
is
the set of all members of dimensions .
2.2 Cell Reference
Given an N-dimensional cube C, a cell reference
(reference for short) is an N-tuple
〈
………..
〉
where
∈(
) for all
∈
1,
.
Given a cube C, we denote by
(
)
×
()the set of all references of C.
2.3 Distance between References
Given a cube C, a distance between cell references
in
(
)
is a function from
(
)
×() to
the set of real numbers.
2.4 Query
In this paper first, we consider simple MDX queries,
viewed as set of references. Let
=<
,……..
,>, be a N- dimensional cube and
⊆()be a set of members of dimension
Di for all. A query over an N-dimensional cube C is
the set of references.
×…….
.
Given a cube C, we denote by query(C) the set
of possible queries over C.
In the second way we consider an analysis
query which is used by Olap system like Display,
Rotate, Drill-down, Roll-up…..This type of query
will be designed in the following by analysis query.
2.5 Distance between Queries
Given a cube C, a distance between queries in
query(C) is a function from query(C) × query(C) to
the set of real numbers.
2.6 User Session
Given a cube C, a user session =
〈
,……..,
〉
over C is a finite sequence of queries of query(C).
We denote by query(s) the set of queries of a session
s, by session(C) the set of all sessions over a cube C
and by s[i] the
query of the session s.
2.7 Database Log
Given a cube C, a database log (log for short) is a
finite set of sessions. We denote by query(L) the set
of queries of a log L.
2.8 Class of Queries
Given a cube C, a class of queries is a set⊆
().
2.9 Class Representative
Given a cube C, a class representative is a function
from 2
()
to query (C).
2.10 Query Set Partitioning
Given a cube C and a distance between queries, a
KDIR 2011 - International Conference on Knowledge Discovery and Information Retrieval
322

query set partitioning is a function p from
2
()
2
()
such or all ∁()
computes a partition of Q under the form of a set P
of pairwise disjoint classes of queries.
2.11 Query Classifier
Given a cube C a query classifier cl is a function
from ()×2
()
2
()
such that if
∈()is a query, ⊆2
()
is a set of
classes then
(
,
)
∈. We say that cl(q,P) is the
class of q.
2.12 Explanation
and Prediction Methods
These methods are aimed to define a predictive or
explanatory model from available data. They can
highlight a relationship between particular attributes
that you want to predict and predictive attributes
(Kotsiantis, 2006).
2.13 Generalized Session
Given a session s and a set of classes of queries, the
generalized session of s is the sequence of classes of
each query of s is turn. Formally, given a cube C, a
set of classes of queries P, a query classifier cl and
=<
,…..,
> a session over C, the
generalized session gs of s is the sequence
(c
1
,.................c
p
) where
•
=
(
,
)
ℎ
for all i∈
[1,p].
• ∀,
∈.
• ∀,
∈
(
)
.
We denote by gs[i] the i
th
of the generalized
session gs .
2.14 Analysis
An analysis is a set of queries related to each other
by pointers. Note that a query session is a special
case of analysis where the complaints are related to
each other by pointers representing the sequencing
of requests.
2.15 Analysis Base
A basic analysis is a set of tests. Note that a query
log sessions is considered as particular case of
analysis base.
2.16 Association Rule Mining
Let I=I
1
,I
2
,…… I
m
be a set of m distinct attributes, T
be transaction that contain a set of items such
that⊆, D be a database with different transaction
records Ts. An association rule is an implication in
the form of ⟹=∅.X is called antecedent while
Y is called consequent, the rule means X implies Y.
There are two important basic measures for
association rules, support (s) and
confidence(c).Since the database id large and users
concern about only those frequently purchased
items, usually thresholds of support and confidence
are predefined by users to drop those rules that are
not so interesting or useful. The two thresholds are
called minimal support and minimum confidence
respectively. Support(s) of an association rule is
defined as the percentage/fraction of records that
contains ∪to the total number of records in the
database. Suppose the support of an item is 0.1%, it
means only 0.1 percent contain purchasing of this
item.
Confidence of an association rule is defined as
the percentage/fraction that contain ∪to the
total number of records that contain X. Confidence
is a measure of strength of the association rules,
suppose the confidence of the association rule
⟹ is 80%, it means that 80% of the transactions
that contain X also contain Y together (Kotsiantis,
2006) .
2.17 Association Rule Class
The method of association rules involves the
extraction of classes and classification rules by using
these rules. Such methods derived from extracting
association rules methods (Kotsiantis, 2006).
3 RELATED WORK
Information personalization is a major challenge for
the computer industry; it was introduced especially
in the following technologies: HCI, information
retrieval and databases. Indeed, much work has been
performed in the latter, since the user has been
introduced in process cycles of access to
information.
Whatever the technology field, information
personalization can be operated in two modes of
management: by query or recommendation.
Recommender systems exploit user profiles or
communities to disseminate targeted offers on the
interests and preferences of the latter. This
INTEGRATION OF PROFILE IN OLAP SYSTEMS
323
procedure is also called the push mode.
Personalization in request is to adapt the
evaluation of the request with the characteristics and
preferences of the user who issued it. In this context,
the system reacts to a specific user request in
fulfilling his request to make it more precise in
choosing the line of data obtained in function of the
quality user requirements (context), or by
customizing displaying results. This procedure is
also called pull mode. We consider in this paper all
research conducted in the personalization data
warehouses.
To do this it was proposed to classify this
research: manufacturers of preferences,
personalization the schema level, Olap visual
recommendation by analyzing user profiles,
recommendation by analyzing user sessions, the
profile model or the research that combine several
topical.
1. Data warehouses can be personalized on the
scheme, indeed (Garrigos et al., 2009) have designed
a conceptual model for personalization, it captures
information specific to users (see figure 2), and
specifies a set of personalization rules (ECA: Event-
Condition-Action).
This approach creates a data cube in two types of
personalization: static (various cubes Olap for
various users are created in design-time) and
dynamic (a cube of data is created for each user
during the run-time in taking into account the needs
and actions taken by the user), for this he uses rule
base (ECA) of (Thalhammer et al., 2001); (Garrigos
et al., 2006)
Figure 2: OLAP Personalization Dimensions.
This model brings a lot to personalized Olap, it
offers the possibility of integrating the features of
the user (profile) in the synthesis of OLAP. But this
approach does not take into account the part of
adaptation. In addition, the system contains a set of
simple rules, and personalization should contain
complex events (sequences of operations OLAP) to
better adapt the OLAP system to its context of use.
Finally, the model is not strengthened by a
validation system of the approach, the basic rule is
defined based on conditions, they are identified
explicitly by the user, to make the model more
objective it is imperative to minimize in the
maximum user intervention and intercept features
via its interactions with the system.
2. A second approach discussed is to express
user preferences in Olap queries (Golfarelli et al.,
2009), to be, algebra of preferences was introduced,
which can be expressed with numerical data,
categorical or in fact aggregations. This algebra
includes database manufacturers in preference
attributes, hierarchies and measures and another
composed of several builders called "Pareto".
The originality of this algebra is a statement of
preferences in the group-by clause of the query. This
algebra is not the first in the literature, P-Cube was a
first attempt introduced by (Xin et al., 2008), but
here the expression of preferences is only effective
for calculating boolean predicates, or expression
affected only the digital data, and they are not
supported in aggregations. Also in (Koutrika et al.,
2008), preferences are expressed on a hierarchy of
concepts, but the information is always sought the
best level of detail and preferences can be expressed
in the diagram. Thus (Golfarelli et al., 2009) could
take several types of data, and the expression of
preference has reduced the size of query sequence
which indicates the decision maker so that the
analysis is faster.
3. Personalization has also affected the visual
representation of data, the outstanding work that is
mentioned here (Mansmann et al., 2007), he
presented a hierarchical visualization technique.
Indeed, these authors have designed a new user
interface for exploring multidimensional data in an
OLAP environment. Users navigate through
dimensional hierarchies via a browser based on the
diagram (Fig 3). The results are represented as trees
increased decomposition; they finally offer multiple
models of layout of trees, integrated and optimized
visualization techniques to meet different criteria
(visual evolution, intelligibility and recognition of
outliers).
4. One of the ways to personalize OLAP
systems, to provide recommended queries for users
of data warehouses based on their preferences. It
was suggested in this context by (Giacometti and al,
2008), a generic Framework (can be instantiated)
(see Fig. 4) a recommended system for users of
KDIR 2011 - International Conference on Knowledge Discovery and Information Retrieval
324
Figure 3: Navigation hierarchical-based schema.
OLAP. The main idea of this system is to
recommend to the current user data found in
previous sessions and which resembles the data
requested in this session. The key idea of this
Framework is to deduct from the OLAP server log,
data sought by previous users. Finally the deductions
were used as a basis to guide and assist the user in
navigation on the data cube.
Figure 4: Overview of the generic framework.
5.
Another approach has been discussed in
personalization is that designing a recommendation
system based on user preferences. In the work
proposed by (Jerbi et al., 2009), a Framework
offering three scenarios of recommendations: 1)
assist the user to compose his query, 2), 3) provide
alternatives and anticipated contextual analysis.
Indeed, the authors are mainly based on the
anticipated recommendation process, offering to that
effect to the analyst's analysis step ahead. It was
defined then an approach based on user preferences
to generate the anticipated recommendations. The
crucial step of this approach is to adapt the context
regardless of structure visualization (done on the
internal view). The various recommendations are
classified, such as the best recommendation is
delivered with simple annotations makers of
previous sessions. Another approach has been used
for personalization in the MDB and this by using a
predefined dashboard. The solutions studied in
(Thalhammer et al., 2001) presented asset data
warehouse. This approach aims to model set scripts
using automatic mechanisms, for example, the
authors illustrate their approach through weekly
dashboards.
Other research (Cabanac et al., 2007) in the field
of recommender systems aim to integrate the
expertise of decision makers in a MDB. This
approach allowed us to associate zero or more
imposed information called annotations for each
element of multidimensional data. These annotations
stored makers’ remarks. These annotations help
users in their analysis embodying their personal
comments. In addition, annotations can share the
expertise of decision makers to facilitate analysis
and collaborative decisions. However, all these
solutions are based solely on the presentation and
explanation of the data.
They do not specify a subset of data dedicated to
a particular maker.
It exists in the literature other approaches that
combine two or more axes in their research, may be
mentioned for this purpose, the Framework designed
by (Bellatreche et al., 2005), which supports
presentation of the structure on the one hand and
secondly its visualization.
This is to adapt the data displayed in a data cube
based on constraints (limits imposed by the device
used to regulate the display format) and user
preferences (ranking of tuples in the cube). These
are expressed explicitly by the user. The approach
used to calculate the part of the query that satisfies
the constraints and preferences. In addition to, a
display structure is proposed. This approach
considers only one attribute in dimension, only
works with the select clause, and a predefined order
of members of user preferences. This Framework
would be more interesting if we work with all
elements of OLAP, the fact table, measures and
aggregations.
Further examples of interesting work of (Ravat
and al, 2009) who proposed a conceptual model, a
query model and a personalize MDB. This model is
based on the basic concepts of multidimensional
(fact, dimension, hierarchy, measurement, weight
attribute) and personalization rules. The rules are
INTEGRATION OF PROFILE IN OLAP SYSTEMS
325

based on the formalism of event-condition-action
and affect the weight of priority to the
multidimensional schema attributes (quantitative
approach); it was defined as new OLAP operators
(display, rotate, rollup, drilldown) specific to
personalized OLAP system.
Personalization influence the classic performance
since it changes in the displayed data in order to
provide only the relevant analysed data. Finally a
personalized system of multidimensional database
has been proposed (Fig. 5); All these contributions
have been implemented in a prototype that allows
users to define rules for personalization and query a
personalized MDB.
The personalization approach is only a first step
for a more complete Framework, because the work
is proposed as a first step towards an adaptive
database, where personalization of the constellation
(definition rules) should be generated automatically
from the data access frequencies based on users'
interactions with the system.
Figure 5: System Architecture.
The approach proposed by (Ravat et al., 2009) is
more complete than (Bellatreche et al., 2005) since it
allows personalization of all components of
multidimensional databases and visualization is not
limited to a single attribute, Jerbi et al (Jerbi et al.,
2008) proposed a model of context-aware
preferences OLAP, OLAP preferences are defined in
a MDB schema, and they are modelled through a
qualitative approach and depend on its context of
use. Indeed, a conceptual model has been defined as
elements analysis tree (personalized Framework
Olap).But personalization here includes only the
user preferences and which are incorporated
subsequently in the initial user application (selection
of user preferences and increase the query with these
preferences). The tree contains two types of nodes:
1) structure of the node (node to the fact table, one
for each analysed indicator (measurement), a node
for each analysis axis (selected dimensions) and
finally a node for each selected attribute) 2) value of
the node or instance of each attribute or measure.
Preferences are defined here as a set of nodes having
the most profound way (which has more detail in the
selection). This model is a first step to an adaptive
Olap system where it should save user information
inserted explicitly or implicitly (obtained through
user interactions with the system) and presents the
results according to user preferences and context.
Another line of work in the personalization has
touched the modelling of user profile that is not new
in the world of research for example Bouzeghoub
defined a generic profile in the IR (Bouzeghoub et
al., 2005). The novelty of these authors is a model
that supports the specific aspect of data warehouses.
Indeed it has been proposed a set of attributes
describing the profile based on the Framework of
Zackman (Zachman, 2003),a description of the
profile and made answers to questions (what, where,
when), then a collection of profile attributes from
multiple sources is made.
We see through works presented in this section
that in the majority of them, the profile or user
preferences are operating in either the scheme or the
recommendations or at the level of data
visualization. But among all the research cited above
they identify the profile or user preferences
explicitly, it would be best to minimize the
maximum user intervention in the description of his
profile, by examining its interactions with the
system and therefore implicitly infer his profile or
more precisely preferences.
We propose in the next section an approach for
extracting knowledge, indeed we will analyze the
data in the log file of OLAP server, and therefore
deduce user preferences in terms of attributes.
4 PROPOSED APPROACH
Ravat et al., 2009, affect weights to attributes of
constellation in order to express user preferences.
These weights are static (stored in database see Fig
5), the values of these are explicitly expressed by
end users. Their expression is subjective. Our goal is
to achieve an adaptive system to present all essential
data through predefined reports to makers, limiting
the various operations commonly carried out by
them. The adaptive system automatically generates
rules to personalize the system to adjust to the
customs of each decision maker.
In this section we detail the proposed
personalized OLAP system. This system uses both
the sequence of queries of the current session, and
the query log of OLAP server. It consists of four
following steps as illustrated in Fig. 6.
KDIR 2011 - International Conference on Knowledge Discovery and Information Retrieval
326
1. The first step consists in using a query set
partitioning to partition the query log in order
to compute all the generalized sessions of the
log or grouped session user.
2. Predicting for each type of analysis query the
minimum accepted weight of each attribute.
Therefore we deduce automatically which
attribute are frequently used and those rarely
used for each user. This information is used as
base to construct a knowledge base( user
profiles)
3. Selection of preferences. In this step we take
only attributes having weights above accepted
minimum weight. To do this we generate
automatically a rule base (ECA), witch create a
set of rules for selecting the appropriate
attributes.
4. The last step consists in integration the
preferences in queries of current session and
executes them.
Figure 6: Personalized OLAP System.
How to create a profile? To do this, and for the
problems cited above, it was proposed to extract
knowledge from data (KDD) contained in the log
file. KDD (Knowledge Discovery from Data)
usually passes through three steps: pre-processed,
processed and post-proceessed (see Fig 7). In what
follows we will explain all three steps.
Figure 7: Profile Creation.
4.1 Pre-processed Step
The log can be very large, albeit not as large as the
cube itself. In addition, the various users may have
different interests, thus their queries may navigate
very different parts of the cube. It means that it may
be unlikely to find a given query more than once in
the log. Thus the log can be both large and sparse. In
order to cope with largeness, the queries in the log
can be grouped into classes; so as to partition the
log.The pretreatment will be carried out by using a
parameter that is none other than the partitioning.
This allows either: 1) to group similar queries,
using a distance between queries to determine
partitions. The distance was computed with
Hausdorff distance (Giocametti et al., 2008), where
(
,
)
!
=max
∈
∈
(
1,2
)
,
∈
∈
(
1,2
)
.
Where
and
are queries, i.e, set of references
and distance, d used is the hamming distance. This
distance relies on computation of distance between
the elements of sets (references). The result is
simply a set of queries grouped in a set of classes
where each query belongs to one class, or 2) group
sessions per user. For any partitioning of the test
depends on the mass of information contained in the
log if it is dense for user we partition per user class
if not by similar queries.
Partitioning the set of queries can be done by
using a clustering algorithm like K-medoids
(Giacometti et al., 2008). In that case for the query
classifier can associate the query with class for
which the class representative is the closet to the
query.
If we now subdivide the log by user, we regroup
all the session for each user in the same class. Each
class is identified by an identifier CUj that is the ID
of the user.
After the preprocessed log file, we should now
detect from data contained in each base class
(identified for each category of user or a particular
user), the occurrence frequency of each attribute for
User
Results
Log
Profile Creation
Preference Selection
Preference integration
Personalized Query
Execution
Personalized Query
User Profiles
Data
(3)
Data Log
Generalized
Session
(2) Predicting Algorithm
User
Session
Weight of Each
Attribute and
Thresholds
User
Profile
INTEGRATION OF PROFILE IN OLAP SYSTEMS
327

each analysis query type (display, rotate, drill-down,
drill up, slice and dice). This step is part of the
second phase of KDD which will be explained in the
next section.
4.2 Treatment Step
Indeed, this step will allow us to discover
frequencies of queries analysis attributes for each
type of request and then, their rate of occurrence.
The latter will be compared to a threshold if it is
higher then we automatically know that it is an
attribute often used by the user.
Due to the constraint of the number of pages we
limited our study to case where the log is pre-
processed by user class. For a better view of our
approach we use a standard example of a
constellation given by (see Fig 8).
The aim of our approach is to predict for each
user, its preferred attributes and those he rarely used.
Indeed, it is recommended to set from the training
set (preprocessed log file) a set of class association
rules (in our case class is the query type) that will
extract the frequency use of each attribute for each
type of query and beyond be able to assign a
priority. That in the future will be used by the
system to create a base rule having type ECA (
Event, Condition, Action). It is generated
automatically using the results obtained by our
approach. For this we use a variant of the APRIORI
algorithm, but it will be adapt for our study context,
we begin by defining the basic algorithm, then we
will define our approach and we end up with a case
study for understand our approach.
In the APRIORI algorithm (Kotsiantis, 2006), for
discovering frequent items, several courses of all
instances are needed. At first pass, the support of
each item is calculated and only the frequent items
are kept thereafter. For each run, the items or
itemsets found above are used to generate new
itemsets. This procedure is repeated until no longer
find frequent itemsets.
Figure 8: Constellation Example.
Before presenting our algorithm, it is imperative
that some notations are specified in advance:
B : data set in knowledge base (log file).
CUj : user class.
BRi : data rules set Ri.
RCOMRi : common rules set removed from BRi
REXCEPRi : exception rules removed from BRi.
E
f
: frequent attributs set.
E
r
: rare attributs sets.
BRi(r) : data set covered by the rule(r).
RBRi=RCOMRi∪REXCEPRi
BRI(RBRi) : data set covered by RBRi
It is proposed the following algorithm to determine
the attributes commonly used by a defined query and
a user with the ID CUj :
Predicting user profile algorithm:
For each user in log file.
For each fact table Exemple:
ACCOUNT, LOANS)
For each analysis query type Ri(display, Rotate, Drill-
down, Roll-up, …………)
1. Generation of E
f
et E
r
from BRi.
2. Generation of common rules.
For each
∁
et
∁
←<
∪
→>
(
∪
→)≥
3. Generation of exception rules.
For each
∁
et
∁
REXCEPRi←<
∪
→>
(
∪
→)≥
4. Purge redundant rules of RBRi:
Delete (
′
→)
′
→∁
(
→
)
⊆
′
.
5. BRi←BRi-RBRi
6. Repeat 1,3,4,5 until BRi=∅.
We explain in the following each of the six steps:
1
st
step: generate two sets and thresholds:
• E
f
set contain attributes commonly used for
each type of query.
• E
r
set contain attributes rarely used for each
type of query
• Two thresholds are generated
(
) to classify the
association rules per class. Where
design
for each user the minimum of tolerance of frequent
attribute.
These two thresholds are determined as follows:
The thresholds are values that can declare that an
attribute is often or seldom used. To not prescribe in
advance what this threshold as was the case in the
work of (Ravat et al., 2009) we will use the theory of
fuzzy sets. This will automatically set a threshold for
each class BRi in our learning base (data log).
KDIR 2011 - International Conference on Knowledge Discovery and Information Retrieval
328
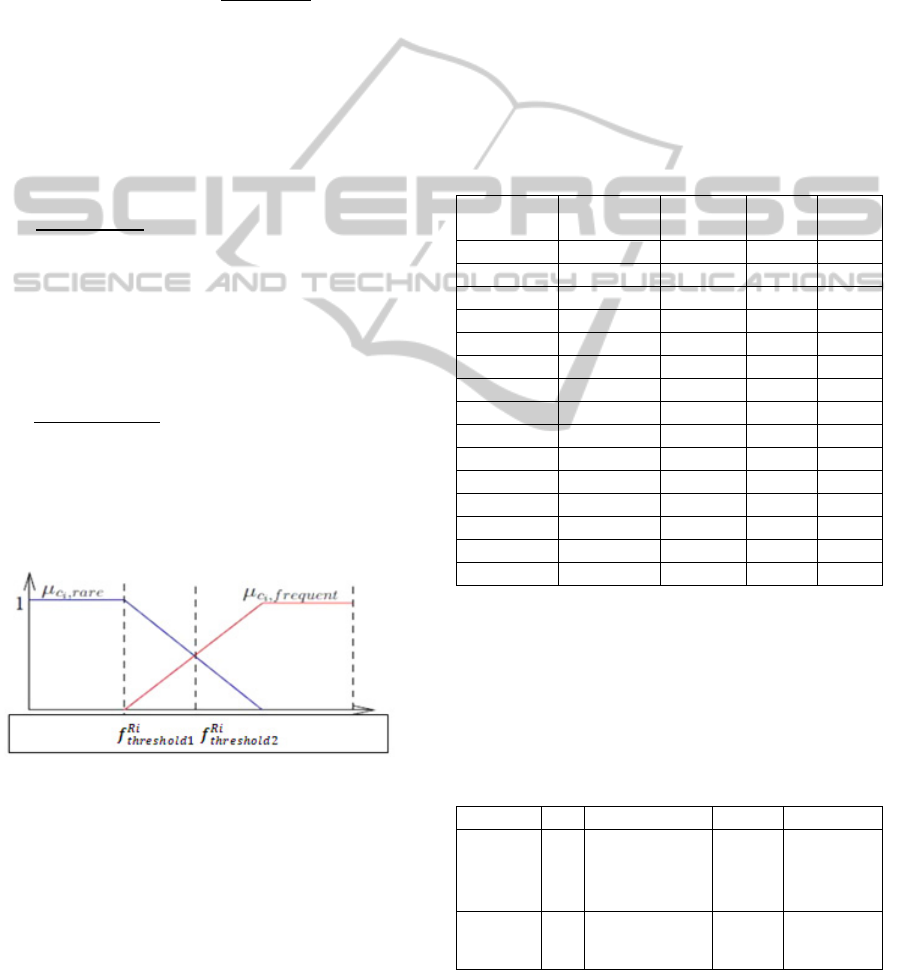
Indeed with the method of Zadeh (Zadeh, 1975)
we will interpret the linguistic variable frequency of
occurrence of an attribute associated with rare and
frequent .Linguistic variable is defined as
(v,T(v),U); where :1) v is the name of linguistic
variable « apparition frequency»; 2) T(v) is terms set
associated to linguistic value{rare, frequent} ; 3) U
definition domain={r∈ BRi|Suplocal} for BRi class,
it correspond to all local supports of rules BRi
where Suplocal(→)=
|
{∈|⊆
|
|
|
. The T(v)
terms are characterized by fuzzy set defined by
membership functions K of all centroids fuzzy sets
obtained by FCM (Fuzzy c-means) (Giacometti et
al., 2009) applied to U and K={f
rare
,f
frequent
}.
Where
,
()= membership function of
rare linguistic term and is calculated as follows
,
(
)
=
1
1
<
0
(1)
And
,
()
= membership function of
frequent linguistic term and is calculated as follows:
,
()=
0
1
<
1
(2)
Once the membership functions defined, Figure 9
defines for us how to calculate
:
Figure 9: How to compute
,
.
2
nd
step allow us to combine between attributes
in E
f
: rule results from this combination have the
« local threshold >
», are stored as common
rules and those between
constitute exception rules.
3
rd
step: we can generate other exception rules
only with combination of attributes E
f
and of E
r
between themselves. This rules have « threshold >
»
4
th
step : purge redundant rules.
5
th
step : allow us to remove from learning base
data covered by the rules previously generated.
6
th
step : repeat steps 1,3,4 ,5 until learning base
is empty.
No better than a case study to understand our
approach, we restrict ourselves to the circumstances
at fact table “Accounts” with three dimension tables
Customers, BBranch et Dates and two kind of
analysis request «Display et Drill-down », following
abbreviations a
1
,a
2
,a
3
,b
1
,b
2
,b
3
,b
4
,b
5
,c
1
,c
2
,c
3
,c
4
,c
5
,c
6
:
replace respectively attributes : Idc, City, country,
idB, Name, City, Dept, Region, DD, Dayname,
Month, Quarter, Week, Year, and Display, Drill-
Down by A and B. Let the learning base described
in Table 2 for a user CUi.
Table 2: Learning Base (log file).
Number of
duplicates
Customers BBranch Dates BRi
8 a
1
a
2
b
1
c
1
A
4 a
1
a
2
b
1
c
2
A
3 a
1
a
2
b
1
c
3
A
4 a
1
a
2
b
2
c
3
A
2 a
1
a
2
b
2
c
4
A
2 a
1
a
2
b
3
c
4
A
2 a
3
b
5
c
4
A
4 a
1
b
1
c
1
B
5 a
1
b
1
c
2
B
1 a
1
b
2
c
3
B
3 a
2
b
3
c
4
B
3 a
2
b
3
c
2
B
3 a
2
b
3
c
4
B
4 a
2
b
4
c
4
B
1 a
3
b
5
c
5
B
By applying our Predictive algorithm and
equation (1) and (2), we get the following results:
1)
=0,31;
2)
=0,23;
=0,29;
=0,17.
3)
Rules generated for the type query Display are
specified in table 2
Table 3: Rules generated from instances of class A.
Id Rule Suplocal Confidence
1
st
threshold
1
2
3
→
→
→
23/25
15/25
8/25
1
1
1
2
nd
threshold
4
5
→A
→
6/25
6/25
1
1
We deduce from table 2 that attributes {
,
,
,
,
are frequently used with the Diplay query
INTEGRATION OF PROFILE IN OLAP SYSTEMS
329

(these attributes have suplocal >
and
confidence=1) and combinations,
,
with a lesser degree.
Therefore, we deduce also that
,
are rarely
used with analysis query display because there
suplocal<
.
This algorithm allows us to have weight of each
attribute or a set of attribute. Even this algorithm
also allows us to generate subsequently the rules
base (ECA) automatically for each user. Indeed,
once the frequency and the threshold defined, we
can build the rule base as that developed by (Ravat
and al,2009) since all the parameters that determine
rule base are available (threshold of tolerance for
each attribute and for each table individually or
collectively). By using the example of table 2 the
following rule can be created:
CREATE RULE HGeo_Rule
ON Customers.HGeo
WHEN DISPLAYED
IF isCurrent(‘Accounts’) THEN
BEGIN setWeight(‘IdC’, 0.92);0.92=Suplocal of IdC
setWeight(‘Firstname’, 0);
setWeight(‘Lastname’, 0);
setWeight(‘City’, 0.92);
setWeight(‘Country’, 0.08);
setWeight(‘Continent’, 0);
END;
This rule show us that only City and Country are
the favorite attributes for this user because its
suplocal>>>Minsuplocal(
). The others are
rarely or never used like firstname and lastname.
We can generate many rules for MDB (for each
fact, dimension,...);it depends the type number of
queries excitant in user session.
The second threshold
(
). allows us to
determine the exception rules; they combine
between frequent and infrequent attributes and have
a high level of confidence. And thus allow new
instances which are not yet processed by the system.
This kind of rules allows us to deduce new user
needs. This change in need (change some settings in
profile) can be justified for example by changing the
work environment.
The same steps are repeated for the type of query
drill-down. Once association rules defined, you can
have for each type of query that has the highest
support. And from there we can have a classification
association rules for all classes. This could be used
to determine the best sequence query for a user.
Several readings can be made from the predicting
algorithm which is summarized by the following
points:
1. Determine the minimum threshold of an
attribute.
2. Constitute a set of common and rare attributes
for each type of query and each table (dimension or
fact)
3. Constitute a set of common attribute
combinations for each type of query and a set of
tables.
4. Constitute the best query sequence by
scheduling the association rules for all classes.
5. Generate a rule base automatically which
define for each query type and each table or set of
tables the supported attributes. Note that the
generation of rules base is the phase of post-
processed in KDD.
Our approach is the first in the literature which
can deduct the user profile implicitly in Olap system.
5 EXPERIMENTATIONS
In this section, we present the results of experiments
we have conducted to assess the capabilities of our
system. Our prototype and generator are developed
with java and Mondrian OLAP engine. We first
generate the cube and sessions. The cube has 4
dimensions, 2 facts, 4 levels per dimension and a
maximum of 50 values per dimensions, first
experiment assesses the efficiency of our system to
generate queries for a user. The performance is
presented in figure 11.We change in the size of log.
To do this we have change in the number of sessions
and the number of queries per session. We compute
the time taken for generates user generalized session
or user grouped sessions, prediction of weights,
generation of rules, preference integration and
execution of queries. The figure 10 shows us that
the time taken to generate response for queries is
acceptable.
Figure 10: Performance of the query generation.
Fig 11 shows us that it is better to adapt the
number of clusters to the log size in order to obtain
0
5
10
15
20
100
1000
3000
5000
7000
9000
11000
11500
AVERAGE TIME(ms)
Median Log size
KDIR 2011 - International Conference on Knowledge Discovery and Information Retrieval
330
good query quality. We notice that quality increases
periodically according to the median number of
queries in each cluster. This period increases when
the number of cluster falls.
Figure 11: Quality of query.
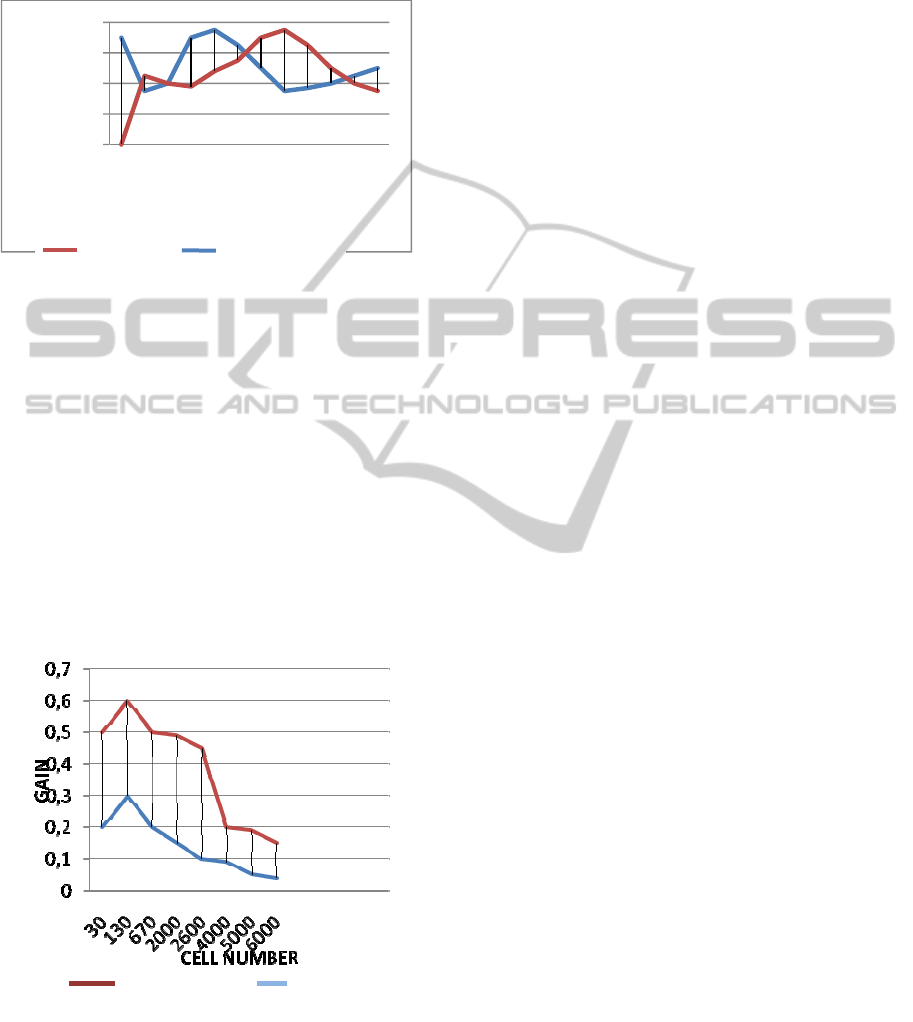
We conducted another series of tests that will
examine the gain of time obtained after
personalization of queries. Indeed, we conducted
tests on queries from different users and those that
will be augmented by the preferences obtained by
our rule base. For this, we took five sessions for
various current users. Each session contains an
average of 8 queries, which return an average of 30,
130, 670, 2000, 2600, 4000, 5000, 6000 cells. We
calculated their average execution time before and
after customization (Figure 12). We used the
advantage that the Mondrian generator uses the
cache. We find that the gain of time after
customization is considerable.
Figure 12: Gain with cache.
6 CONCLUSIONS
This paper has allowed us first to make a synthesis
of work undertaken for the personalization of OLAP
systems. For this we classified the searches per axis
(manufacturer’s preferences, personalization the
schema level, OLAP visual recommendation by
analyzing user profiles, recommendation by
analyzing user sessions, the profile model ...). In the
second part we focused on our approach. Indeed, we
planned to analyze the log file server OLAP, which
led us to use for this purpose a variant of the
prediction algorithm "APRIORI. Our approach has
overcome or complements the work of (Bellatreche
et al., 2005); (Ravat et al., 2007). In fact we got to
predict for each user's preferred attributes for each
table or set of tables and also for each type of query.
Determine for each user's query sequence preferred
by ordering the rules of association. And ultimately,
generate a rules base automatically, it will use for
this purpose the results obtained by our algorithm
(
, local supports, association rules). Our
objective was to define a system OLAP adaptive to
each user. This was achieved by our approach
because it enabled automatically integrate their
preferences in the process of personalization. These
results can also be used by any system
recommended to give the best query sequence for a
particular user. We present the results of some
experiments we have conducted that shows that
quality of query is acceptable and the added process
of research the knowledge have not affect a time of
execution of the user query. We expect in the near
future to go a little further by scanning in predicting
not only the attributes but more the values of these
attributes and deduct the value preferences of a user.
We try also to validate our approach by testing it on
real data.
REFERENCES
Agrawal R., Srikant, R., 1994. Fast algorithms for mining
association rules”. In Jorge B. Bocca, Matthias Jarke,
and Carlo Zaniolo, editors, Proc. 20
th
Int. Conf. Very
Large Data Bases, VLDB, pages 487–499. Morgan
Kaufmann, 12–15.
Bellatreche, L., Giacometti, A., Marcel, P., Mouloudi, H.,
Laurent, D. 2005. A personalization framework for
OLAP queries. In DOLAP’05: Proceedings of the 8th
ACM internationalworkshop on Data warehousing
and OLAP, 9–18, New York, NY, USA. ACM.
Bouzeghoub, M., Kostadinov, D. 2005. Personnalisation
de l’information : aperçu de l’état de l’art et définition
0
0,2
0,4
0,6
0,8
0 5 10 20 25 30 40 50 60 70 80 90
Query quality
Median log size/Nb clusters
:
100 clusters ; 50 clusters
User Queries
Personalized
Queries
INTEGRATION OF PROFILE IN OLAP SYSTEMS
331

d’un modèle flexible de profils, CORIA’05, pp. 201–
218.
Bentayeb, F., Boussaid, O., Favre,C,. Ravat,F,. Teste,
O.2009. Personnalisation dans les entrepôts de
données : bilan et perspectives, 5eme journées sur les
Entrepôts de Données et l’Analyse en ligne (EDA’09),
Revue des Nouvelles Technologies de l'Information,
RNTI-B-5, Cepadues Editions.
Cabanac, G., Chevalier, M., Ravat, F., Teste. O. 2007. An
annotation management system for multidimensional
databases. In I. Y. Song, J. Eder, and T. M. Nguyen,
editors, DaWaK, (volume 4654 of Lecture Notes in
Computer Science), 89–98. Springer.
Espil, M., Vaisman, A. 2001. Efficient Intentional
Redefinition of Aggregation Hierarchies in
Multidimensional Databases.DOLAP’01, pp. 1–8.
Favre, C., Bentayeb, F., Boussaid, O., 2007, Evolution et
personnalisation des analyses dans les entrepôts de
données: une approche orientée utilisateur,
INFORSID’07, pp. 308–323.
Garrigôs, I., Pardillo, J., Mazôn, J., Trujillo, J. 2009.
Conceptual Modeling Approach for OLAP
Personalization. A. H. F. Laender et al. Springer-
Verlag Berlin Heidelberg (20, 2009). 401-414.
Garrigós, I., Gómez, J. 2006. Modeling User Behaviour
Aware WebSites with PRML. In Proceedings of the
CAISE'06 (Third International Workshop on Web
Information Systems Modeling: WISM '06)).
Giacometti, A., Marcel, P., Negre, E. 2008. A Framework
for Recommending OLAPQueries. In: DOLAP 08.
73–80.
Giacometti, P., Marcel, E., Negre, Soulet. 2009. A. Query
Recommendations for OLAP Discovery Driven
Analysis. In Proceedings of 12th ACM International
Workshop on Data Warehousing and OLAP :
DOLAP'09, Hong Kong.
Golfarelli, S., Rizzi, S. 2009. Expressing OLAP
Preferences. Berlin/ Heidelberg, LNCS, (vol.
5566/2009, Scientific and Statistical Database
Management, 2009), 83-91.
Jerbi, H., Ravat, F., Teste, O., Zurfluh,G. 2008
Management of context-aware preferences in
multidimensional databases , 3rd International
Conference on Digital Information Management
(ICDIM’08), IEEE, p.669-675, Londres (UK),
novembre 2008.
Jerbi, H., Ravat, F., Teste, O., 2009. Applying
Recommandation Technology in Olap Systems
Zurfluh. G. J. Filipe and J. Cordeiro (Eds.): ICEIS
2009, LNBIP 24, pp. 20– 233, 2009. Springer-
Verlag Berlin Heidelberg.
Korfhage, R. R. Information Storage and Retrieval.1997.
JohnWiley & Sons.
Kotsiantis,S., Kanellopoulos. D. 2006. Association Rules
Mining : A recent overview 2006,GESTS International
Transactions on Computer Science and Engineering,
Vol.32 (1), pp. 71-82.
Koutrika, G., Ioannidis, Y. 2008. Answering queries based
on preference hierarchies. In Proc. VLDB, Auckland,
(New Zealand 2008).
Kozmina, N., Niedrite. L. OLAP Personalizaton with
User-describing Profiles.
Ioannidis, Y., Koutrika, G. 2005. Personalized Systems:
Models and Methods from an IR and DB Perspective,
VLDB’05, pp. 1365–1365.
Mansmann, S., Scholl, M. H. 2007. Exploring OLAP
Aggregates with Hierarchical Visualization
Techniques. In Proceedings of 22nd Annual ACM
Symposium on Applied Computing ((SAC'07),
Multimedia & Visualization Track, March 2007,
Seoul, Korea). 1067-1073.
Mansmann, S., Scholl, M. H. 2008. Visual OLAP: A New
Paradigm for Exploring Multidimensonal
Aggregates”. In Proceedings of IADIS International
Conference on Computer Graphics and Visualization,
(MCCSIS'08: Amsterdam, The Netherlands, 24 - 26
July, 2008) 59-66.
Ravat, F., Teste, O. 2009. Personalization and OLAP
databases. In: Volume New Trends in
DataWarehousing and Data Analysis of Annals of
Information Systems, 71– 92. Springer, Heidelberg.
Rizzi, S.2007 OLAP Preferences: a Research Agenda
10th International,Workshop on Data Warehousing
and OLAP (DOLAP’07), ACM, pp.99-100, Lisbon
(Portugal).
Sapia, C., PROMISE: Predicting Query Behavior to
Enable Predictive Caching Strategies for OLAP
Systems DaWaK’00, LNCS 1874, pp. 224–233,
Heidelberg (2000).
Thalhammer, T., Schrefl, M. , Mohania, M. 2001. Active
Data Warehouses: Complementing OLAP with
Active Rules. Data & Knowledge Engineering, (vol.
39, issue 3, December, 2001, Elsevier Science).
Xin, D., Han, J. 2008. P-cube: Answering preference
queries in multi-dimensional space. In Proc. ICDE,
(Canenn, Mexico, 2008, pp. 1092–1100).
Zachman, J. A. 2003. The Zachman Framework: A Primer
for Enterprise Engineering and Manufacturing.
Zachman International.
Zadeh. L. 1975. The concept of a linguistic variable and
its application to approximate reasoning – ii.
Information Sciences (Part 2), 8(4) :301–357.
KDIR 2011 - International Conference on Knowledge Discovery and Information Retrieval
332
