
A USER CENTERED APPROACH FOR QUALITY ASSESSMENT
IN SOCIAL SYSTEMS
Nicolas Weber
1,2
and Stefanie N. Lindstaedt
1,2
1
Knowledge Management Institute, Graz University of Technology, Inffeldgasse 21a, Graz, Austria
2
Know-Center GmbH, Inffeldgasse 21a, Graz, Austria
Keywords: Information quality, Social information systems, Quality models.
Abstract: Analyzing the meaning of quality in information systems has a long tradition. As a result of the increasing
amount of user generated content on the web, addressing quality is more relevant than ever. Since
information is produced and consumed by different people in various contexts the perception of quality is
always closely tied to the users’ situation. This work proposes an approach for assessing quality in social
systems with respect to the users’ current needs.
1 INTRODUCTION
During last years the Web went through a
metamorphosis from a more or less static source of
information to a network of actively contributing
users. A new consciousness of web usage and new
technologies enabled the user to share knowledge on
the web. Systems that allow being author and
consumer at the same time are rapidly evolving.
Therefore, it is more and more important to check
and ensure information quality of the social
information system. Discovering a lack of quality is
the bottleneck in many social information systems
because provision of high-quality data is essential
for system acceptance (Ahn et al., 2007). The model
of information system success (Delone and McLean,
2003) names system quality and information quality
as crucial factors for system use and user
satisfaction.
Large social systems such as Wikipedia with
millions of entries overcome this problem by
arguing that having many pairs of eyes is the best
strategy for weeding out errors in wiki content. In
this way Wikipedia achieves a stupendous quality
for their articles (Giles, 2005). However, there are
only approximately 50 such large social systems on
the web while there are thousands of smaller social
systems dealing with a specific topic that cannot
make use of this strategy to ensure quality of the
web content. These systems are often denoted as the
long tail. Examples include corporate Wikis for
hard- and soft-ware products, forums and wikis
operated by communities of interest. Due to their
specific content, the community of users is smaller
and so there are less pairs of eyes for observing the
content quality. Systems that represent the long tail
are therefore more likely to face problems in dealing
with information quality. Information quality seems
to be a subjective concept for assessing an object;
hence quality cannot be generally measured.
This paper proposes a user centered approach for
quality assessment in social systems. Therefore three
questions are answered: First, how can we detect and
represent quality needs of the user? Second, how can
we measure the qualitative status of a resource?
Third, how can we map the resource quality status to
the user quality requirements in order to provide
resources that comply with the users´ quality needs?
2 MEASURING QUALITY
This section describes our approach for evaluating
the qualitative status of resources. Quality
assessment requires several levels of abstraction.
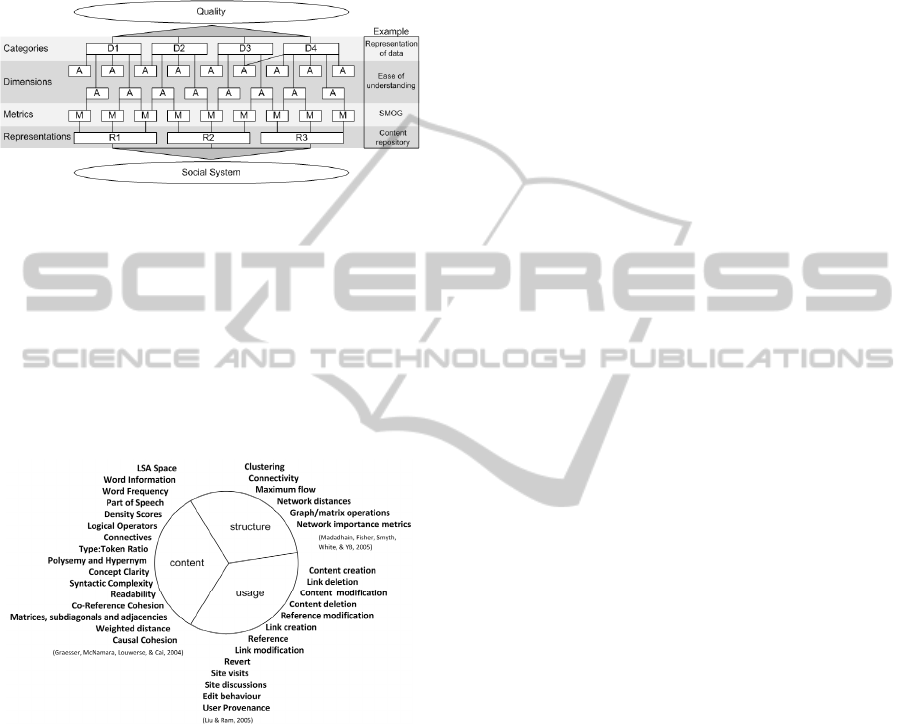
This approach proposes four levels of system
abstraction: Categories, Dimensions, Metrics,
Representations (see Figure 1). The approach of
Wang and Strong (1996) provides the technical
foundation of this model. Categories and
Dimensions are directly adopted. From the top-down
perspective the model provides a step by step
211
Weber N. and Lindstaedt S..
A USER CENTERED APPROACH FOR QUALITY ASSESSMENT IN SOCIAL SYSTEMS.
DOI: 10.5220/0003664502110216
In Proceedings of the International Conference on Knowledge Management and Information Sharing (KMIS-2011), pages 211-216
ISBN: 978-989-8425-81-2
Copyright
c
2011 SCITEPRESS (Science and Technology Publications, Lda.)
specification of the concept quality; from the
bottom-up perspective the model provides an
abstraction from the system. The
specification/abstraction level of the quality
dimensions allows measuring them directly using a
set of metrics.
Figure 1: System abstraction layers for quality assessment.
Metrics are used to provide measures on a given
data set. Formal system representations provide a
computer readable basis for evaluating a system.
Representations provide different perspectives on an
information system and they are chosen depending
on the aspect of the system to be assessed; i.e. based
on content, structure or usage. Figure 2 shows
different possible system representations and
proposed metric categories for each representation.
Figure 2: System representations and metric categories.
A very common representation is structure based
representation in a directed graph. Several
approaches use graphs that represent relations
between objects. One example is social network
analysis (SNA) where a social system is represented
by nodes (people in the system) and edges
(relations/activities/events) to make a statement
about the whole system or individuals in the system
(Dom et al., 2003). Graph representations are not
only used for analysis of social networks; Jeon et al.
(2006) applied metrics on a graph structure to assess
the quality of answers in answering services where
people ask and other people give answer. Hotho et
al., (2006) present an approach for analysis of
folksonomies based and their graph representation.
Another representation of information stored in
social systems (e.g. Wikis) is content based
representation. This representation consists only of
the textual (and multimedia) content of the system.
Content based metrics assess the status of texts,
video, audio and pictures. Since wikis still consist
almost solely of text, for this work only text based
content metrics are considered. One very common
approach to assess the quality of text is by means of
reading scores. Examples for reading score based
approaches are Gunning Fog Reading Ease Score,
Flesh-Kincaid Readability Formula (Agichtein et al.,
2008) and the SMOG Reading Score (McLaughlin,
1969). But metrics for content based quality
assessment are not only limited to reading scores.
Graesser et al., (2004) propose, for instance, text
coherence as one indicator relevant for text quality.
In addition they present a framework consisting of
more than 200 metrics for text assessment.
Furthermore resources can be assessed based on
the way they are used in the system. The usage of
resources denotes any interaction of users and
resources in the system. The assumption behind the
application of usage metrics is that if quality of a
resource changes, interaction patterns of this
resource change too. This means users interact
differently with an article if it is of high quality than
a low quality article (Ram and Liu, 2007). Lih,
(2004) shows that there is a direct correlation
between the quality of an article and the number of
edits in a particular time span respectively the
number of unique authors. Cress and Kimmerle
(2008) show that interaction pattern are observable
that lead to a qualitative improvement of an article
and some that do not influence the quality. So it is
both, interactions can influence the quality of an
article and the interactions can be used as indicator
for article quality.
The example in Figure 1 shows the category
Representation of data that covers a set of
dimensions. One of the dimensions of this set is
Ease of understanding. Each dimension is related to
at least one metric. The metric can be seen as
measurement tool for attributes. In the example the
SMOG reading ease score provides a tool for
measuring ease of understanding (McLaughlin,
1969). By nature, metrics are based on a particular
data structure. This structure is provided by the
lowest level of abstraction, the system
representation. In case of the SMOG metric a textual
representation is required as input.
The approach for assessing quality described in
this section proposes a multi layered model
KMIS 2011 - International Conference on Knowledge Management and Information Sharing
212
representing the qualitative status of a resource.
Since the assessment only covers the resource
perspective, individual (task-dependent) user quality
requirements are not covered by this approach. The
following section describes how quality dimensions
can differently weighted depending on the users
current context.
3 USER CENTERED QUALITY
ASSESSMENT
Quality of information is a very general term, (Juran,
1992) defined information quality as data that is fit
for use in their (the users') tasks. This definition
suggests that quality is strongly connected to the
user and her/his requirements (Cappiello et al.,
2004). If we assume that information quality can be
measured by looking at the performance of a system
which is based on that information (Ivanov, 1972),
we still must acknowledge that for social media the
performance can differ depending on the target
groups: different users may assess the quality of one
and the same Wiki article completely different
depending on their situation and current tasks. This
means, since the objective is to assess the quality of
social content, one can never assess quality without
having information about the consumer of the data
in the social system (Klein, 2001).
To a certain extent, quality requirements which
are based on situational aspects may depend on the
background knowledge of a user, or the user’s
experience in a certain area. An expert for a topic
would assess the quality of an article differently than
someone who is new to this topic. Similarly, a child
may have different quality requirements than an
adult. Furthermore, for assessing quality we have to
consider intentional and motivational aspects of the
users (Pipino et al., 2002). The current task and the
reason why the user consumes social media are
decisive for quality perception. If a user wants to get
an overview over a certain topic, the user’s
perception of quality may differ from the perception
of a user who wants to know as much as possible
and hopes to find entry points for further
information sources. Therefore, quality cannot be
assessed in general but rather for a user or a
community with similar quality requirements. The
quality of the same wiki article is perceived
differently if the article is read on a computer screen,
printed out or presented on a mobile device.
This section proposes an approach for quality
assessment in social systems based on user
requirements. Therefore we present a procedure of
steps for identifying how different quality
dimensions are weighted by the user.
Quality assessment goes hand in hand with the
elicitation of individual quality perception. The first
step is the elicitation of the individual weighting of
quality dimensions that reflect the user’s quality
requirements. That means to represent the quality
requirements for each user in a quality profile that
subsequently facilitates the provision of an adaptive
system behavior based on the users quality needs. In
the following, two different methods for identifying
relevant quality dimensions and establishing the user
quality profile are presented.
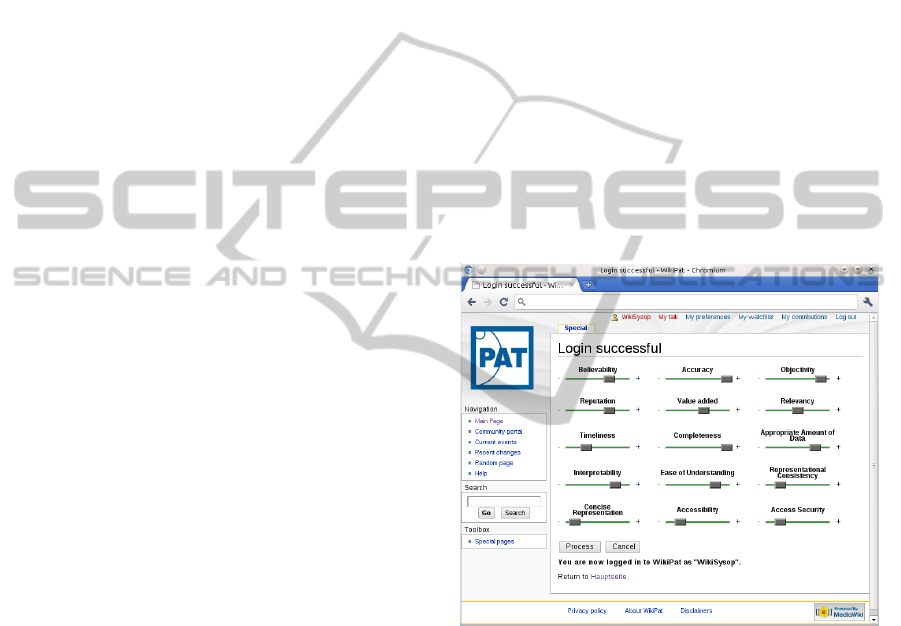
The first approach is characterized by explicitly
asking the user which quality dimensions she/he
perceives as most important. In order to ask the
people which quality attributes they perceive as
important a questionnaire is presented in the log-in
process (Figure 3). The foundation of this approach
is the empirical selection of quality dimensions (see
Table 1) described in Wang and Strong (1996).
Figure 3: MediaWiki quality requirements elicitation
plugin.
One drawback in their approach is that the
participants of the study of Wang & Strong were
asked without reference to a particular system even
though the perception of quality is also dependent of
the used system. Therefore requirements elicitation
in this approach is conducted directly within the
system that should be assessed in terms of quality to
overcome this problem.
One way of explicitly weighting quality
dimensions is to use a build-in questionnaire. We
developed such a questionnaire as MediaWiki
plugin. After successful login the questionnaire is
presented (cf. Figure 3). The information from the
questionnaire is required to map the quality of a user
A USER CENTERED APPROACH FOR QUALITY ASSESSMENT IN SOCIAL SYSTEMS
213
profile to a particular task.
The second approach describes the implicit
dimension weighting process. Here the user assesses
the quality of articles using embedded rating
buttons. The buttons are added to each page that
contains text. While the user browses through the
wiki, she/he can click the green button if she/he likes
the content or otherwise click the black button.
In this way the user makes an explicit statement
of the quality of an article but does also implicitly
select quality attributes. Therefore after each rating,
all available metrics calculate values for the page
that was rated. If the rating is positive, the system
searches for metrics which show high values for the
given text. Since each metric in the system is
connected to a quality attribute, this method
implicitly provides candidates for quality attributes.
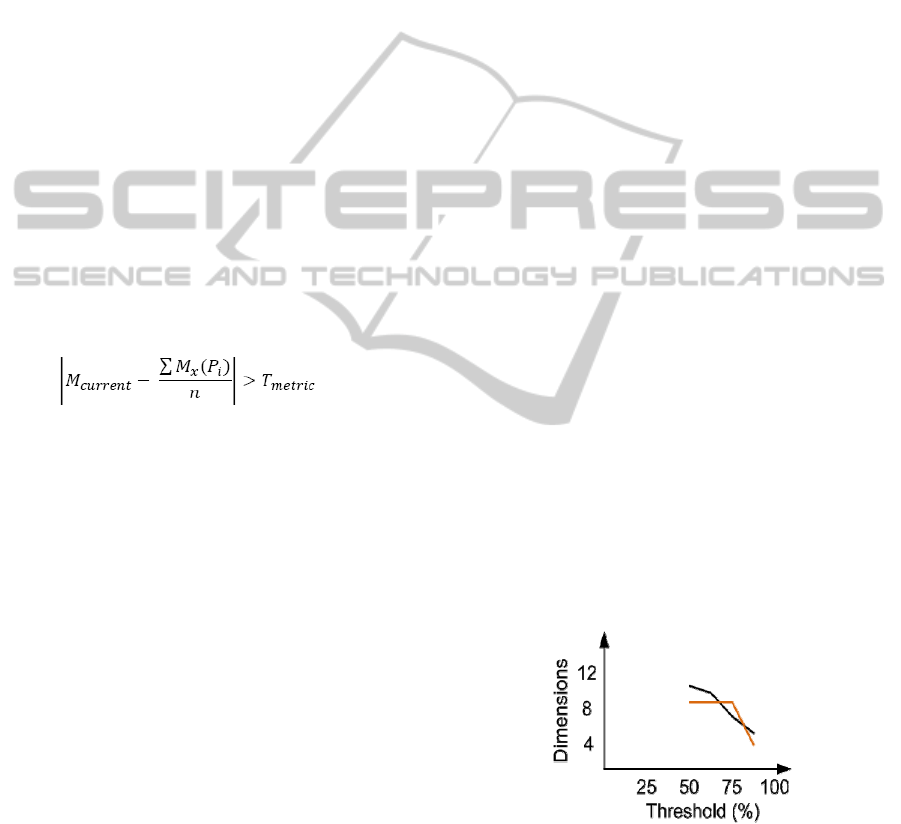
To assess if the value of a metric is high/low in a
particular case, the deviance from the median of the
Wiki article corpus is calculated. The following
formula (1) shows how metrics are selected
implicitly based on user rating. M represents the
Metrics, P the article with i as id (from 0 to n),
Mcurrent is the current metric and T the threshold
for a metric.
(1)
Example: A user rates ten articles as good
quality articles. For all these articles the values for
the RES (Laughlin et al. 1969) metric and the
interaction metric are very high. The RES metric is
connected to the Readability attribute because it
correlates with the readability of the text. The
interaction metric shows that the article is updated
very often, it is connected to the quality attribute
Up-To-Date. Since the user apparently perceives
articles that are easy to read and up to date as high
quality articles, these attributes are stored in the user
profile.
4 EVALUATION
The evaluation is divided into two parts. The first
part addresses the question if the measured quality
of content corresponds to the perception of the user.
In particular, we evaluate whether resources that
would be recommended to the user have the
qualitative status required by the user. The second
part evaluates the assumption that for different tasks
different aspects of quality are important. We
analyze if users perceive quality differently
depending on their current tasks.
The aim of the first part of the study is to
compare the calculated quality status of a resource
and the user quality perception of this resource.
Therefore we used the Wiki questionnaire plugin
(Figure 3) for explicitly weighting the quality
dimensions. In this way we created a quality profile
that represents which quality dimensions are
relevant. For this experiment we assumed that the
context of the user is static, which means the tasks
are always the same. Then we use the rating buttons
to collect quality ratings of Wiki pages given by the
users. Thereby we gathered the information which
articles correspond to the users quality needs. The
next step was to calculate the quality status based on
metric measuring. The objective was to know what
the user understands as good quality, which articles
she rates as good quality and what the system would
recommend as articles that corresponds to the users
needs. The evaluation analyzes whether the system
measures correspond to the users rating. The study
was conducted in an organizational Wiki containing
~2350 articles with ~1750 page accesses per month.
During the test period 78 ratings were given by 18
users. 66 ratings were positive 12 negative. We
identified 2 groups of users with similar quality
requirements and compared the articles rated by
these groups with their quality profiles. The
dependant variable in this experiment is the number
of dimensions that are similar in the resource status
and the user profile. The independent variable is the
threshold which defines similarity. A threshold of
100% means the values are identical, 50% means
both values are higher/lower than system average.
The result shows for 50% threshold a correlation of
10 of 12 dimension, in the other group a correlation
of 8 dimensions. For 75% still 8 respectively 6
dimensions correlate.
Figure 4: Comparison of user profiles created from
implicit and explicit data.
The focus of the second part is evaluating
different weightings of quality dimensions for
different tasks (see description below). The results
presented in this section evolved in line with the
evaluation of a prototype in the MATURE project.
KMIS 2011 - International Conference on Knowledge Management and Information Sharing
214
The participants of this study have been personal
advisors from the career guidance sector in the UK.
During this study the participants used a widget
based information system (cf. Weber et al., 2010) for
several tasks. After completion of the given tasks a
group of expert users filled in the survey. The survey
contained eight questions. For each of the four tasks
the participants were asked how relevant particular
quality dimensions are. The 20 quality dimensions
evaluated in the survey were given by Wang &
Strong (1996).
The tasks were selected according to the familiar
work tasks of the end-users. So the first phase of the
study was to gather relevant tasks from the end-users
by interviewing them. The tasks were divided in two
task groups: the first, group is about receiving
information e.g. by searching. The second group is
about providing information, like writing articles.
The questionnaire was filled in by 5 area
managers as proxy for 25 personal advisors in
different areas. The result represents the mean
values of the answers. In spite of the small number
of participants, the consensus in the answer values
(variance .05p) shows the correctness and the
discrimination of the dimensions values. The fact
that the experts could rate all dimensions for their
areas shows the applicability of the dimension set in
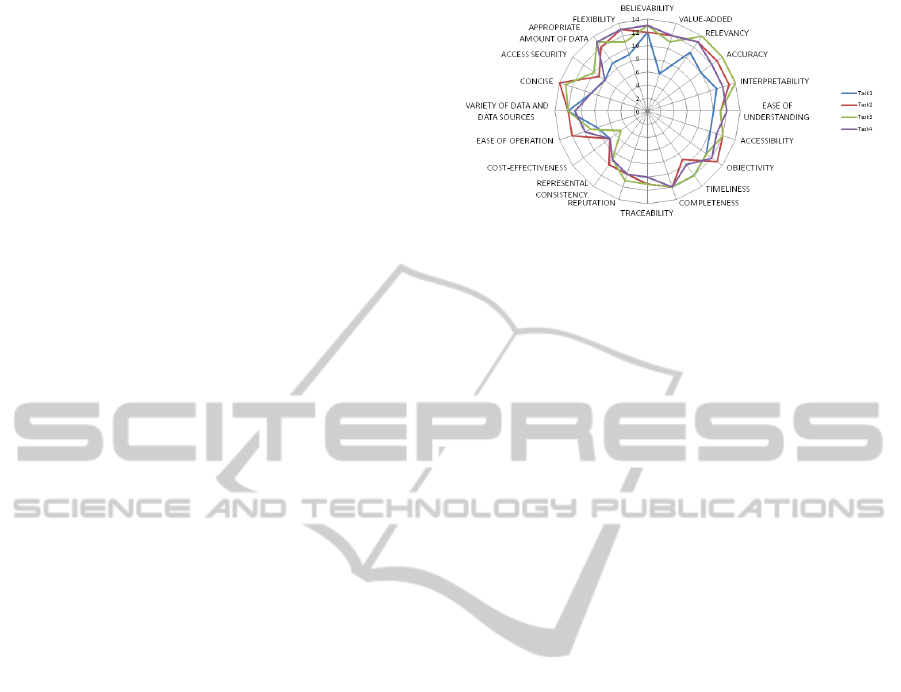
this context. The summary of the results shows that
the relevance of quality dimensions is weighted
differently for various tasks. Figure 5 shows the
cumulated values of the answers for the four tasks.
One noticeable fact is that some of the quality
dimensions are rather depending on a specific task
while others are similar for all tasks. For example
the quality dimension Completeness and
Believability (Figure 5-3) seem to be important
independently of the task, while Cost Effectiveness
states a rather marginal relevance for the selected
domain. In contrast, some values are obviously
dependant on the task. In the case of Concise the
relevance for the second and third task is high
whereas it is low for the first and forth task. The
dimension Timeliness is assessed higher for task 1
and 3 than for task 2 and 4. Regarding the fact that
task 1 and task 3 are tasks that address the quality of
resources that are presented to the user and task 2
and 4 are tasks where the user provides information
the different weights of the quality dimensions make
sense. Timeliness is assessed very important for task
1 and 3 (both of them are about providing
information for other users) whereas it is less
important for 2 and 4 (consuming information from
the system).
Figure 5: Weighting for quality dimensions of different
tasks.
5 CONCLUSIONS
The objective of this paper is to propose an approach
for quality assessment in social systems.
Therefore we raised three questions in the
beginning: First, how can the quality need of the
user be detected and represented? Second, how can
we measure the qualitative status of a resource?
Third, how can we map the resource quality status to
the user quality requirements in order to provide
resources that comply with the users´ quality needs?
The foundation of this work is based on the
awareness that quality is individual and even
depending on the current situation of the user. In
order to provide quality adaptive system behaviour,
the context of the user has to be known. The context
of the user is decisive for the relevance of each facet.
Hence, the quality requirements of the user can be
expressed as fine granular facets of the concept
quality. In this work we argue the importance of
considering the context of the user and propose an
approach for explicitly and implicitly evaluating the
users quality needs.
The task of mapping user quality needs to
resource quality statuses can be accomplished by
specialization of the quality concept on the one hand
and abstraction of the resource status on the other
hand. The resulting quality dimensions and the
metric values are on the same level of granularity
(abstraction/specification) and can so directly be
mapped. The result from the empirical study is that
some quality dimensions depend on a specific task
while others are task independent.
Further research will cover finding algorithms
for quality profile mapping in large datasets.
Clustering articles according to their quality profile
in real-time is still a problem. Due to the increasing
amount of multimedia content another direction for
further research is the qualitative assessment of
images, audio and videos. This would require the
A USER CENTERED APPROACH FOR QUALITY ASSESSMENT IN SOCIAL SYSTEMS
215

enhancement of the exiting metric set with
multimedia metrics.
ACKNOWLEDGEMENTS
This work has been partially funded by the European
Commission as part of the MATURE IP (grant no.
216346) within the 7th Framework Programme of IST and
as part of the FP7 Marie Curie IAPP project TEAM (grant
no. 251514).
The Know-Center is funded within the Austrian
COMET Program - Competence Centers for Excellent
Technologies - under the auspices of the Austrian Ministry
of Transport, Innovation and Technology, the Austrian
Ministry of Economics and Labor and by the State of
Styria.
REFERENCES
Agichtein, E., Castillo, C., Donato, D., Gionis, A., &
Mishne, G. (2008). Finding high-quality content in
social media. Proceedings of the international
conference on Web search and web data mining -
WSDM ’08, 183. New York, New York, USA: ACM
Press.
Ahn, T., Ryu, S., & Han, I. (2007). The impact of Web
quality and playfulness on user acceptance of online
retailing. Information & Management, 44(3), 263-275.
Cappiello, C., Francalanci, C., & Pernici, B. (2004). Data
quality assessment from the users perspective.
international workshop on Information quality, 68-73.
Cress, U., & Kimmerle, J. (2008). A systemic and
cognitive view on collaborative knowledge building
with wikis. The International Journal of Computer-
Supported Collaborative Learning, 3(2), 105-122.
Springer New York.
Delone, W., & McLean, E. (2003). The DeLone and
McLean model of information systems success: A ten-
year update. Journal of management information
systems, 19(4), 9-30.
Dom, B., Eiron, I., Cozzi, A., & Zhang, Y. (2003).
Graph-based ranking algorithms for e-mail expertise
analysis. Data Mining And Knowledge Discovery.
Giles J. Internet encyclopedias go head to head. Nature.
2005;438(7070):900–901..
Graesser, A. C., McNamara, D. S., Louwerse, M. M., &
Cai, Z. (2004). Coh-metrix: analysis of text on
cohesion and language. Behavior research methods,
instruments, & computers: 36(2), 193-202..
Hotho, A., Jaschke, R., Schmitz, C., & Stumme, G.
(2006). Information retrieval in folksonomies: Search
and ranking. The Semantic Web: Research and
Applications, 411–426. Springer.
Ivanov, K. (1972). Quality-control of information: On the
concept of accuracy of information in data banks and
in management information systems. The University
of Stockholm and The Royal Institute of Technology.
Doctoral dissertation.
Jeon, J., Croft, W. B., Lee, J. H., & Park, S. (2006). A
framework to predict the quality of answers with non-
textual features. Annual ACM Conference on
Research and Development in Information Retrieval.
Juran, J. M. (1992). Juran on Quality by Design (p. VI +
538). The Free Press.
Klein, B. D. (2001). User perceptions of data quality:
Internet and traditional text sources. Journal of
computer information systems, 41(4), 9–15.
McLaughlin, G. H. (1969). SMOG grading: A new
readability formula. Journal of reading, 12(8), 639–
646.
Pipino, L. L., Lee, Y. W., & Wang, Richard Y. (2002).
Data Quality Assessment. Communications of the
ACM, 45(4), 211-218.
Ram, S., & Liu, J. (2007). Understanding the semantics of
data provenance to support active conceptual
modeling. Active conceptual modeling of learning,
17–29. Springer.
Wang, R.Y., & Strong, D. M. (1996). Beyond accuracy:
What data quality means to data consumers. Journal of
management information systems, 12(4), 33. ME
Sharpe, Inc.
Weber N., Nelkner, T., Schoefegger, K., Lindstaedt, S. N.,
(2010). SIMPLE - a social interactive mashup PLE.
In: Fridolin Wild and Marco Kalz and Matthias
Palmér and Daniel Müller (eds.): Proceedings of the
Third International Workshop on Mashup Personal
Learning Environments (MUPPLE10), in conjunction
with the 5th European Conference on Technology
Enhanced Learning (EC-TEL2010), 2010
KMIS 2011 - International Conference on Knowledge Management and Information Sharing
216
