
AN APPROACH TO A GRAPHICAL QUERY EDITOR
For Ontology-based Knowledge Management
Markus Schwinn, Norbert Kuhn and Stefan Richter
Institut f¨ur Softwaresysteme in Wirtschaft, Umwelt und Verwaltung, Fachhochschule Trier
Campusallee, 55761 Birkenfeld, Germany
Keywords:
Knowledge management, Ontology, Visual query system, Ambient user support, Graphical query language.
Abstract:
The OnToBau research project aims to provide a way to classify, archive and effectively use business knowl-
edge with the assistance of an ontology-based knowledge archive for small and medium companies of the
construction industry. This archive is intended to pro-actively provide users with information which will assist
them in their daily business process handling. The targeted system consists of four main parts. In this paper
we mainly discuss a component for querying ontologies easily. We claim that such a component should allow
graphical queries in order to be suitable for non-experienced users in our application domain and we present
our approach to a visual query system and sketch how this can be embedded in the worker’s environment. This
graphical interface will allow a knowledge worker to actively search for information in an ontology and is a
first step to a personal agent.
1 INTRODUCTION
The growing importance of computers in the 70s and
the associated opportunity to disseminate information
in digital form, is considered the turning point to to-
day’s information age. As with any other technolog-
ical revolution in history, the new information tech-
nologies spread within two decades all over the planet
(Castell, 2001). For the first time, it was possible to
produce, to copy and to archive information in a sim-
ple way.
In the early 90s another technological milestone
was passed, that moved the world to a new era of
globalization (B¨oder, 2003). The Internet offered the
opportunity to access and produce information on an
increasing number of websites.
The largest flow of information on the Internet is
produced by e-mails. A study of the Radicati Group
in 2009 stated that in the same year about 247 bil-
lion e-mails per day would be sent, and that this num-
ber would be doubled by the year 2013. However,
approximately 81% of those e-mails can be consid-
ered spam (Lyman and Varian, 2003)(Radicati and
Khmartseva, 2009). This information overload will
be a challenge for many companies in coming years.
This is also covered by the same study: it is estimated
that companies with 1,000 or more employees have to
invest 1.8 million dollars per year in the processing of
e-mails and spam (Radicati and Khmartseva, 2009).
However, not only the flood of information from
the growing e-mail traffic will challenge the com-
panies in the near future. A study of the Gartner
Inc. in 2002 amongst around 300 companies showed
that 96% suffer an information overload. To coun-
teract the information overload, companies will have
to spend 30 billion US-Dollars within the next years
(Goasduff, 2002). A similar investigation of the Ba-
sex Inc. in 2008 stated, that the consequences of in-
formation overload produce costs of about 900 bil-
lion US-Dollars a year for the economy of the United
States, caused by reduced productivity of the employ-
ees in knowledge intensive processes, which have to
spent about 25% of their daily work with the search
for information (Spira, 2008).
A significant problem when searching for infor-
mation in digital data storages is, that the user has
to know the query language of the underlying stor-
age system (e.g. a database or an ontology). There-
fore, query systems simplify the query construction
by hiding the target query language. To offer the end-
user an easy and effective search for information in
the knowledge archive, we present our approach of a
diagram-based visual query editor.
The remainder of the paper is organized as fol-
lows. First we give an overview of related work in
visual query systems in Section 2. The overall sys-
436
Schwinn M., Kuhn N. and Richter S..
AN APPROACH TO A GRAPHICAL QUERY EDITOR - For Ontology-based Knowledge Management.
DOI: 10.5220/0003660904360441
In Proceedings of the International Conference on Knowledge Management and Information Sharing (RDBPM-2011), pages 436-441
ISBN: 978-989-8425-81-2
Copyright
c
2011 SCITEPRESS (Science and Technology Publications, Lda.)

tem architecture is described in Section 3, with an
overview of the main components. In Section 4 we
particularly discuss the visual query editor. Finally,
we end up with the conclusion and outline some fu-
ture work.
2 RELATED WORK
In this section we will give an overview of similar
research projects considered in the area of graphical
query construction, particularly in the context of on-
tologies.
Most approaches to support the end-user with
the query formulation have focused on visual tech-
niques to hide the target query language, like SQL
for databases or SPARQL in the context of ontolo-
gies. (Catarci, 1997) presents a classification scheme
of 4 different graphical query construction categories
of visual query systems (VQS). The tool described in
this paper belongs to the category of diagram-based
systems, that tend to be the most popular. There have
been a few previous approaches to support a visual
query construction particularly for ontologies. Some
examples include SPARQLViz (Borsje and Embregts,
2006) and NITELIGHT (Russell and Smart, 2008).
SPARQLViz (Borsje and Embregts, 2006) aims to
help the user in query constructions for SPARQL. The
main difference to our approach is the interaction with
the user interface. SPARQLViz relies on a form-based
VQS with a wizard-like interface design, guiding the
user through different forms. In contrast, we present
a diagram-based system. There seem to be no empir-
ical studies on the different VQS categories, so it is
difficult to compare these different approaches.
NITELIGHT (Russell and Smart, 2008) is a VQS
that has much in common with the VQS presented
in this paper and influenced our research to some de-
gree. NITELIGHT supports the user with respect to
the specification of all SPARQL query result forms
(like SELECT, CONSTRUCT etc.). NITELIGHT
also offers the possibilities of result ordering, filter-
ing and limiting the results. It is a diagram-based
VQS that offers ontology browsing and drag-and-
drop functionality with a graph-based visualization.
Despite these similarities the following differences do
exist between NITELIGHT and our approach. First,
the visual query language (VQL) presented in this
paper is richer compared to the VQL supported by
NITELIGHT. The VQL presented in this paper of-
fers further possibilities on property restrictions like
range and cardinality restrictions (e.g. a person,
that only recieved invoices before 2010). Interviews
with our project partners from the construction in-
dustry revealed that they often search for information
where partial statements are already known (e.g. they
search invoices with a particular bathtube or a tender
preparation from a specific person). Therefore our
VQL supports query construction including individ-
ual statements.
3 OVERVIEW OF THE
ONTOBAU-ARCHITECTURE
There has been much literature about knowledge
management systems (KMS) within large enterprises
and little information available on KMS within SMEs
(Rasheed, 2005). According to (Rasheed, 2005)
SMEs have special requirements on KMS. Interviews
with our project partners led to the same result. The
managers in SMEs are in most cases the owners. The
result is, that the decision-making process is shorter
than in larger companies. They show a flat and
less complex structure, with fewer layers of manage-
ment (Wong and Aspinwall, 2004). Processes are of-
ten not as strongly structured as in larger enterprises
and knowledge is distributed at various points in the
company (file folder, product catalogs, databases)
(Schwinn, 2010). A smaller number of people within
a company is usually united by common beliefs and
values, resulting in shorter and often less strategic
ways of decision making (Rasheed, 2005). Because
fewer human and financial resources are available,
the introduction of a knowledge management system
should not cause ongoing costs. Especially in SMEs
there are no specialists for knowledge management
and additional staff costs are not manageable. The
goal of our project is to account for these special re-
quirements (Schwinn et al., 2011).
During his daily work, the employee can decide
whether certain resources should be transferred into
the knowledge base. Those resources (e.g. an e-mail
or a PDF document) are then passed to the OnToBau-
System using the interface of his personal agent or
plug-ins integrated in his office or e-mail software.
The purpose of this section is to give an overview of
the architecture of our approach. As shown in Figure
1, the OnToBau-system consists of four main parts
described in the following subsections.
3.1 Document Converters
As the name implies these pre-processing compo-
nents will prepare the information resources for in-
clusion in the knowledge base. They are converted to
a general representation language, so called OnToBau
Representation Language (ORL). The pre-processing
AN APPROACH TO A GRAPHICAL QUERY EDITOR - For Ontology-based Knowledge Management
437
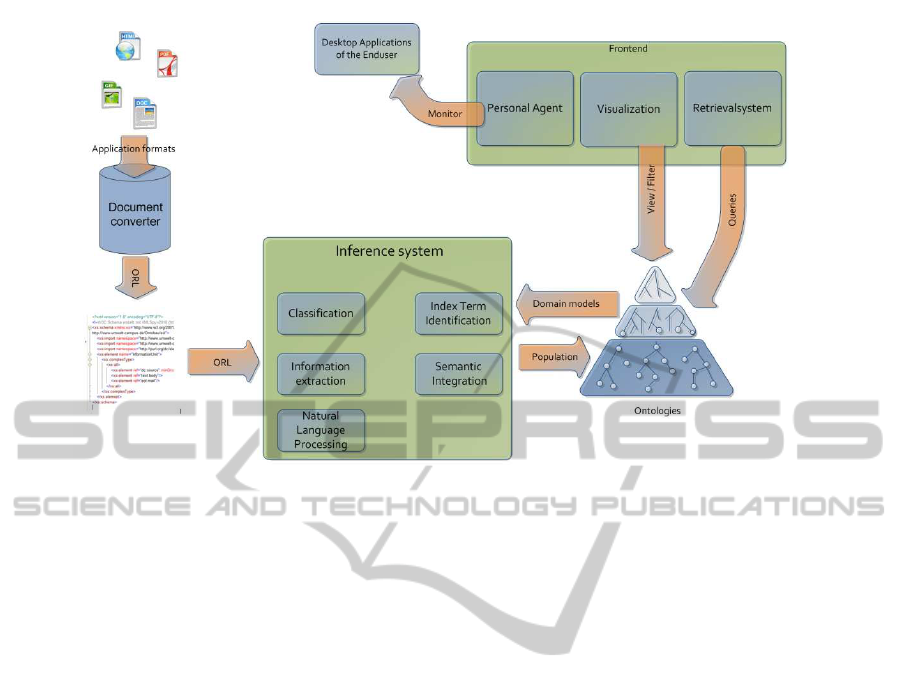
Figure 1: Overview of the OnToBau architecture.
also includes various filters (e.g. segmentation fil-
ter, part-of-speech tagger, stop word filter), which are
used to simplify the subsequent processing. Interest-
ing e-mails can be converted into the ORL directly out
of the mail client.
3.2 Inference System
First, a given resource is classified into process re-
lated categories (e.g. an invoice). The domain on-
tologies contain the information which relevant data
should be extracted from these categories. To store
the information in the knowledge base we try to find
relevant relationships between the new data and the
existing knowledge in the knowledge base (e.g. a link
between an invoice and a corresponding quotation).
3.3 Ontologies
The knowledge in the OnToBau-system is represented
by using ontologies. For this, we decided to use the
Web Ontology Language (OWL), which is a W3C
recommendation since February 2004, so we can ben-
efit from existing libraries and tools. The TBox of our
ontology defines the terminology of the construction
domain and of the business documents, thus provid-
ing the OnToBau-system with the necessary knowl-
edge to decide which information to extract from the
resources. The extracted information is stored as in-
dividuals in the ABox of the ontology.
3.4 Personal Agent and User Interfaces
The personal agent of the employee performs two
main tasks. First, he should allow the employee to
access the knowledge base by making specific search
queries. For this purpose we implement a graphical
tool for query construction described in the following
chapter. Second, the agent should monitor the em-
ployees behavior and provide him pro-actively with
information to fulfill his task. The second task won’t
be part of this paper.
Our system is based on the Eclipse RCP Frame-
work which guarantees the ability to extend the sys-
tem easily with new functions, new converters and
even new graphical interface elements. Thus it will
be much easier to respond to user feedback and addi-
tional requirements.
4 APPROACH TO A GRAPHICAL
INTERFACE FOR COMPOSING
SEMANTIC QUERIES
According to (Spira, 2008) employees in knowledge
intensive processes have to spent about 25% of their
daily work with the search for information. Particu-
larly in small companies knowledgemanagement sys-
tems can hardly be found due to the reasons mentio-
nend in section 3. To use the corporate knowledge in
the OnToBau-system actively, the employees need an
KMIS 2011 - International Conference on Knowledge Management and Information Sharing
438

intuitive search facility. Since the knowledge is rep-
resented using OWL ontologies the queries for infor-
mation are restricted to a specialized query language
for ontologies.
We will describe our approach by using the exam-
ple of searching a document with certain parameters:
the knowledge worker is searching for quotations that
have a direct relation to invoices with a recipient who
is known as ’Markus Schwinn’. Additionally the
query should only consider invoices which were sent
from a company called ’Schottler’. The query string
for receiving this information from an ontology could
look like this:
Listing 1: Query example.
Select ? q u otat i o n Where {
? quo t a t i o n a ( qu o t a tion
and ( q u otatio n For
some ( inv o ice
and ( h a sInv o i c eRecipi e n t
value MarkusSchwinn ) and
( hasI nvoiceSender
value S c h o t t l e r ) ) ) ) .
}
This query might be obvious for a technically ex-
perienced person. But we can not expect the end-user
to be able to state queries like this because they lack
the required technical skills. Visual query systems try
to establish an intuitive way to construct such a query
string. Like (Russell and Smart, 2008) we decided
to use SPARQL as the target query language for our
approach. SPARQL is based on Turtle which isn’t in-
tended for OWL, therefore we use Terp, which com-
bines Turtle and Manchester syntax to provide more
conciseness. The user can select the entities, data
and object properties of the ontology from a treeview.
Contrary to NITELIGHT we decided to use individu-
als for query constructions too. This reflects the fact
that the knowledge worker often knows some details
exactly. In our example he knows the individual of
the invoice recipient. Possibly this will lead to a more
precise and unique query results.
The knowledge worker can drag-and-drop con-
cepts, roles or individuals onto the query editor frame
where they are represented as graphical nodes. If
they are dropped onto existing nodes they are auto-
matically connected with this node by an edge. The
type of the edge depends on the different node types.
When necessary the value of a node can be constraint
to specify cardinalities or ranges (e.g. when searching
for an invoice send by a specific company).
Figure 2 shows the same query from the exam-
ple above but much more intuitive for the end-user.
The queries are modelled as a directed graph. Every
node represents an ontology resource which is in fact
a concept, a role or an individual. These resources
were encapsulated in objects which have an additional
statement object to indicate cardinalities and values,
e.g. min=5, exactly xyz. If a statement object has no
value (e.g. and, not, or) it becomes an edge connect-
ing two nodes. Unlike (Fadhil and Haarslev, 2007),
our VQS basic operators are not modelled as spe-
cial nodes. The user can drop a concept onto another
which already has a connection to another one. By
clicking on the edge the user can define the connec-
tion.
In the background we use the Terp template inter-
preter to generate the SPARQL query from the graph
(Sirin et al., 2010). Terp is a syntax that combines
Turtle and Manchester syntaxes to provide maximum
legibility and conciseness when querying OWL with
SPARQL. It allows class, property and data range ex-
pressions to be used in SPARQL queries. The inter-
preter parses the nodes and edges in the graph and
builds recursively the query string. The use of recur-
sion offers the possibility for deeply nested queries.
Every class element in the graph allows the interpreter
to set a pair of penclosing brackets in the query. A
graph with two class nodes (e.g. person and dog)
would be translated like this:
Listing 2: Example for the conciseness of Terp syntax.
Select ? Person where {? Person a
( ns0 : Person and
( ns0 : h a s pet some ns0 : dog ) ) .
}
The use of Manchester syntax makes the query
easy to read. The edges of the graph reflect the cross-
linkage of the objects with the keywords and, or, not,
min, max, exactly, value, some, only as shown in the
listing above.
Graphs with nothing but the root element and
without an edge as well as the following keywords:
optional, filter, order by and owl:equivalentClass,
rdfs:subClassOf will not be implemented. For these
cases it will be necessary to think of additional mech-
anisms in the graphical user interface.
After constructing the graphical query, the results
are visualized to the knowledge worker. Choosing
a possible result will present the selected individ-
ual with all its connections in a well-arranged graph.
The implementation of this network is based on the
Protege-Plugin Ontograf, which is slightly enhanced
to improve the user experience (see figure 3). In our
example these are the quotations matching the query.
AN APPROACH TO A GRAPHICAL QUERY EDITOR - For Ontology-based Knowledge Management
439
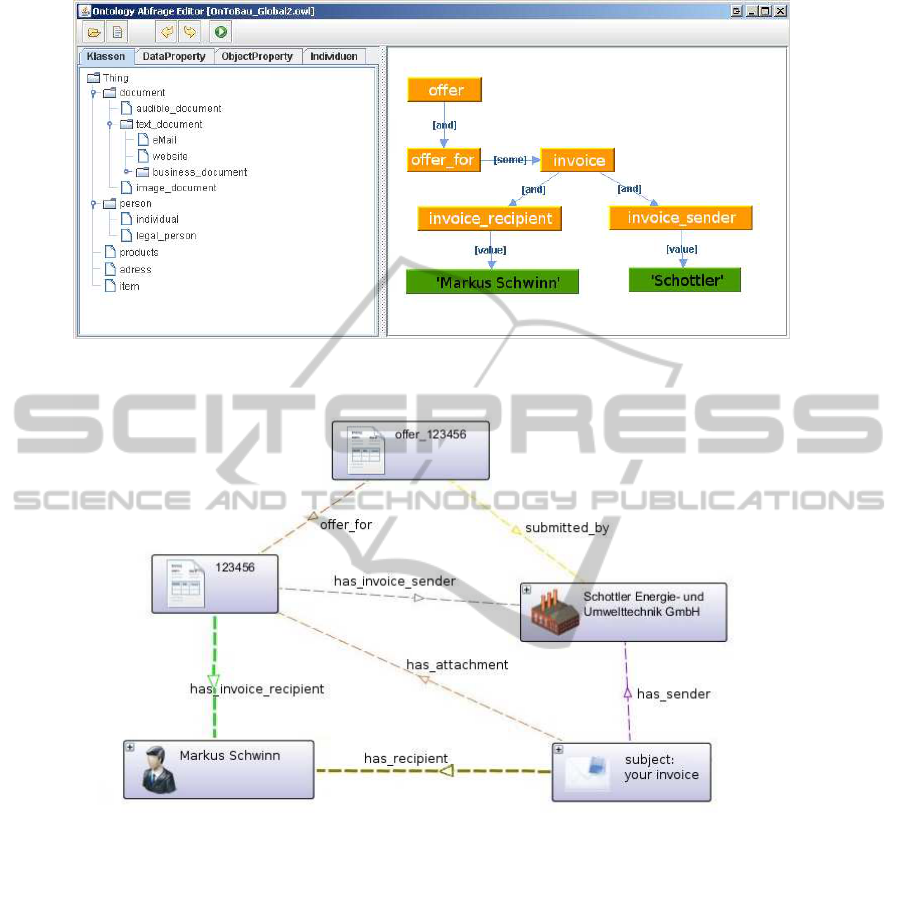
Figure 2: Complete visual query graph.
Figure 3: View of the query result.
The result graph shows additional connections, like
the corresponding invoice and the company.
It is planned, but not yet implemented, to use this
icon-based approach also for the query editor. In
changing the diagram-based approach to a real graph-
ical approach we expect a better acceptance on the
user-side because of the improved usability.
A feature called live search is currently under de-
velopment. With every change on the graphical query
frame, like adding or removing nodes, changing the
type of the edges or changing values, the knowledge
worker will get an updated result list matching the
current query term. Thus he gets an instant feedback
if the query makes sense or not. This feature will cre-
ate a more fluent the workflow.
5 CONCLUSIONS AND FUTURE
WORK
Because there are no specific projects supporting the
knowledge management process of companies in the
targeted domain, the presented architecture is our ap-
proach to provide small and medium companies with
an ontology-based knowledge management and infor-
mation retrieval system.
An integral part of the OnToBau system, which is
not yet implemented, will be the personal user agent.
The agent will monitor the users activities and pro-
vide him with the relevant information for the process
in real-time. To achieve this, it needs underlying be-
havior patterns and must try to anticipate the users
KMIS 2011 - International Conference on Knowledge Management and Information Sharing
440

intention.
The editor for the visual query construction is a
first step to this personal agent. It can provide the user
with necessary knowledge, but he still has to search
pro-activily. The current approach is diagram-based,
but we are planning to develop an icon-based system
similar to the result view presented in figure 3. This
will improvethe user experience because there will be
no ”visual gap” between query construction and result
graph. We have not performed any user evaluations
with our project partners, but aim to undertake such
studies in the near future.
Another extension is the live search functionality.
When finished it will provide the knowledge worker
with a direct response on what he does in the query
editor. Currently the query editor and the presenta-
tion of the result is divided in two program parts. For
a fluently workflow it will be neccessary to combine
these into one.
Our research project focuses on the needs of con-
struction industry but of course this approach could
be adapted in other domains dealing with ontologies.
ACKNOWLEDGEMENTS
The authors would like to thank Nima Pourjahedi for
the valuable assistance in implementing the visual
query editor. This work is supported by the German
Ministry of Research and Technology.
REFERENCES
B¨oder, J. (2003). Das Internet und seine Folgen - Was
Luthers Reformation und unsere Zukunft gemeinsam
haben. http://www.intelligenzia.de/Texte/Internet.pdf.
17. August 2009.
Borsje, J. and Embregts, H. (2006). Graphical Query Com-
position and Natural Language Processing in an RDF
Visualization Interface. Bachelor, Erasmus University
Rotterdam.
Castell, M. (2001). Das Informationszeitalter. Wirtschaft,
Gesellschaft, Kultur, volume 1. Leske + Budrich Ver-
lag.
Catarci, T. (1997). Visual Query Systems for Databases: A
Survey. Journal of Visual Languages & Computing,
8(2):215–260.
Fadhil, A. and Haarslev, V. (2007). OntoVQL: A Graphical
Query Language for OWL Ontologies. In Calvanese,
D., Franconi, E., Haarslev, V., Lembo, D., Motik, B.,
Turhan, A.-Y., and Tessaris, S., editors, Description
Logics, volume 250 of CEUR Workshop Proceedings.
CEUR-WS.org.
Goasduff, L. (2002). Gartner Says 90 Percent of
Businesses Suffer from Information Overload.
http://www.gartner.com/5 about/press releases/2002 -
05/pr20020507c.jsp. 24. August 2009.
Lyman and Varian (2003). How Much Information?
http://www2.sims.berkeley.edu/research/projects/how-
much-info-2003/printable report.pdf. 19. August
2009.
Radicati, S. and Khmartseva, M. (2009). Email Statistics
Report, 2009-2013. http://www.radicati.com/wp/wp-
content/uploads/2009/05/email-stats-report-exec-
summary.pdf. 19. August 2009.
Rasheed, N. (2005). The Impact Of Knowledge Manage-
ment On Smes. Technical report, Knowledgeboard.
Russell, A. and Smart, P. R. (2008). NITELIGHT: A Graph-
ical Editor for SPARQL Queries. In International Se-
mantic Web Conference (Posters & Demos).
Schwinn, M. (2010). Automatic Information Extraction
from Documents for Setting Up a Knowledge Archive
as Basis for an Automated Tender Preparation. Mas-
ters thesis, University of Applied Sciences, Trier.
Schwinn, M., Kuhn, N., and Richter, S. (2011). Ontol-
ogy based knowledge management for SMEs. In Pro-
ceedings of the 2nd International Multi-Conference
on Complexity, Informatics and Cybernetics: IMCIC
2011, volume 1, pages 151–155.
Sirin, E., Bulka, B., and Smith, M. (2010). Terp: Syntax for
OWL-friendly SPARQL queries. In Seventh Interna-
tional Workshop at OWLED 2010 OWL: Experiences
and Directions.
Spira, J. B. (2008). Information Overload: Now $ 900
Billion - What is Your Organizations Exposure?
http://www.basexblog.com/2008/12/19/information-
overload-now-900-billion-what-is-your-
organizations. 10. December 2010.
Wong, K. and Aspinwall, E. (2004). Characterizing knowl-
edge management in the small business environment.
Journal of Knowledge Management, 8:44–61.
AN APPROACH TO A GRAPHICAL QUERY EDITOR - For Ontology-based Knowledge Management
441
