
A NOVEL QUERY EXPANSION TECHNIQUE BASED ON A MIXED
GRAPH OF TERMS
Fabio Clarizia, Francesco Colace, Massimo De Santo, Luca Greco and Paolo Napoletano
Department of Electronics and Computer Engineering, University of Salerno
Via Ponte Don Melillo 1, 84084 Fisciano, Italy
Keywords:
Text retrieval, Query expansion, Term extraction, Probabilistic topic model, Relevance feedback.
Abstract:
It is well known that one way to improve the accuracy of a text retrieval system is to expand the original query
with additional knowledge coded through topic-related terms. In the case of an interactive environment, the
expansion, which is usually represented as a list of words, is extracted from documents whose relevance is
known thanks to the feedback of the user. In this paper we argue that the accuracy of a text retrieval system
can be improved if we employ a query expansion method based on a mixed Graph of Terms representation
instead of a method based on a simple list of words. The graph, that is composed of a directed and an undi-
rected subgraph, can be automatically extracted from a small set of only relevant documents (namely the user
feedback) using a method for term extraction based on the probabilistic Topic Model. The evaluation of the
proposed method has been carried out by performing a comparison with two less complex structures: one
represented as a set of pairs of words and another that is a simple list of words.
1 INTRODUCTION AND
RELATED WORK
It is well documented that the query length in typi-
cal information retrieval systems is rather short (usu-
ally two or three words (Jansen et al., 2000), (Jansen
et al., 2008) which may not be long enough to avoid
the inherent ambiguity of language (polysemy etc.),
and which makes text retrieval systems, that rely on
a term-frequency based index, suffer generally from
low precision, or low quality of document retrieval.
In turn, the idea of taking advantage of additional
knowledge, by expanding the original query with
other topic-related terms, to retrieve relevant docu-
ments has been largely discussed in the literature,
where manual, interactive and automatic techniques
have been proposed (Efthimiadis, 1996)(Christopher
D. Manning and Schtze, 2008)(Baeza-Yates and
Ribeiro-Neto, 1999). The idea behind these tech-
niques is that, in order to avoid ambiguity, it may be
sufficient to better specify “the meaning” of what the
user has in mind when performing a search, or in other
words “the main concept” (or a set of concepts) of the
preferred topic in which the user is interested.
A better specialization of the query can be ob-
tained with additional knowledge, that can be ex-
tracted from exogenous (e.g. ontology, WordNet,
data mining) or endogenous knowledge (i.e. extracted
only from the documents contained in the repository)
(Bhogal et al., 2007; Piao et al., 2010; Christopher
D. Manning and Schtze, 2008).
In this paper we focus on those techniques which
make use of the “Relevance Feedback” (in the case of
endogenous knowledge) which takes into account the
results that are initially returned from a given query
and so uses the information about the relevance of
each result to perform a new expanded query. In the
literature we can distinguish between three types of
procedures for the assignement of the relevance: ex-
plicit feedback, implicit feedback, and pseudo feed-
back (Baeza-Yates and Ribeiro-Neto, 1999). The
feedback is obtained from assessors (or other users
of a system) indicating the relevance of a document
retrieved for a query. If the assessors know that the
feedback provided is interpreted as relevance judg-
ments then the feedback is considered as explicit, oth-
erwise is implicit. On the contrary, the pseudo rele-
vance feedback automates the manual part of the rel-
evance labeling by assuming that the top “n” ranked
documents after the initial query are relevant and so
finally doing relevance feedback as before under this
assumption.
Most existing methods, due to the fact that the hu-
man labeling task is enormously annoying and time
84
Clarizia F., Colace F., De Santo M., Greco L. and Napoletano P..
A NOVEL QUERY EXPANSION TECHNIQUE BASED ON A MIXED GRAPH OF TERMS.
DOI: 10.5220/0003660500840093
In Proceedings of the International Conference on Knowledge Discovery and Information Retrieval (KDIR-2011), pages 84-93
ISBN: 978-989-8425-79-9
Copyright
c
2011 SCITEPRESS (Science and Technology Publications, Lda.)

consuming (Ko and Seo, 2009; Ruthven, 2003), make
use of the pseudo relevance feedback. Nevertheless,
fully automatic methods suffer from obvious errors
when the initial query is intrinsically ambiguous. As
a consequence, in the recent years, some hybrid tech-
niques have been developed which take into account
a minimal explicit human feedback (Okabe and Ya-
mada, 2007; Dumais et al., 2003) and use it to auto-
matically identify other topic related documents. The
performance achieved by these methods is usually
medium with a mean average precision about 30%
(Okabe and Yamada, 2007).
However, whatever the technique that selects the
set of documents representing the feedback, the ex-
panded terms are usually computed by making use
of well known approaches for term selection as Roc-
chio, Robertson, CHI-Square, Kullback-Lieber etc
(Robertson and Walker, 1997)(Carpineto et al., 2001).
In this case the reformulated query consists in a sim-
ple (sometimes weighted) list of words.
Although such term selection methods have
proven their effectiveness in terms of accuracy and
computational cost, several more complex alterna-
tive methods have been proposed. In this case, they
usually consider the extraction of a structured set of
words so that the related expanded query is no longer
a list of words, but a weighted set of clauses combined
with suitable operators (Callan et al., 1992), (Collins-
Thompson and Callan, 2005), (Lang et al., 2010).
In this paper we propose a query expansion
method based on explicit relevance feedback that ex-
pands the initial query with a new structured query
representation, or vector of features, that we call a
mixed Graph of Terms and that can be automatically
extracted from a set of documents D using a global
method for term extraction based on a supervised
Term Clustering technique weighted by the Latent
Dirichlet Allocation implemented as the Probabilistic
Topic Model.
The evaluation of the method has been conducted
on a web repository collected by crawling a huge
number of web pages from the website Thomas-
Net.com. We have considered several topics and per-
formed a comparison with two less complex struc-
tures: one represented as a set of pairs of words and
another that is a simple list of words. The results
obtained, independently of the context, show that a
more complex representation is capable of retrieving
a greater number of relevant documents achieving a
mean average precision about 50%.
2 THE PROPOSED APPROACH
The vector of features needed to expand the query is
obtained as a result of an interactive process between
the user and system. The user initially performs a re-
trieval by inputting a query to the system and later
identifies a small set D of relevant documents from
the hit list of documents returned by the system, that
is considered as the training set (the relevance feed-
back).
Existing query expansion techniques mostly use
the relevance feedback of both relevant and irrelevant
documents. Usually they obtain the term selection
through the scoring function proposed in (Robertson,
1991), (Carpineto et al., 2001) which assigns a weight
to each term depending on its occurrence in both rel-
evant and irrelevant documents. Differently, in this
paper we do not consider irrelevant documents and
the vector of features extraction is performed through
a method based on a supervised Term Clustering tech-
nique.
Precisely, the vector of features, that we call
mixed Graph of Terms, can be automatically ex-
tracted from a set of documents D using a method
for term extraction based on a supervised Term Clus-
tering technique (Sebastiani, 2002) weighted by the
Latent Dirichlet Allocation (Blei et al., 2003) imple-
mented as the Probabilistic Topic Model (Griffiths
et al., 2007).
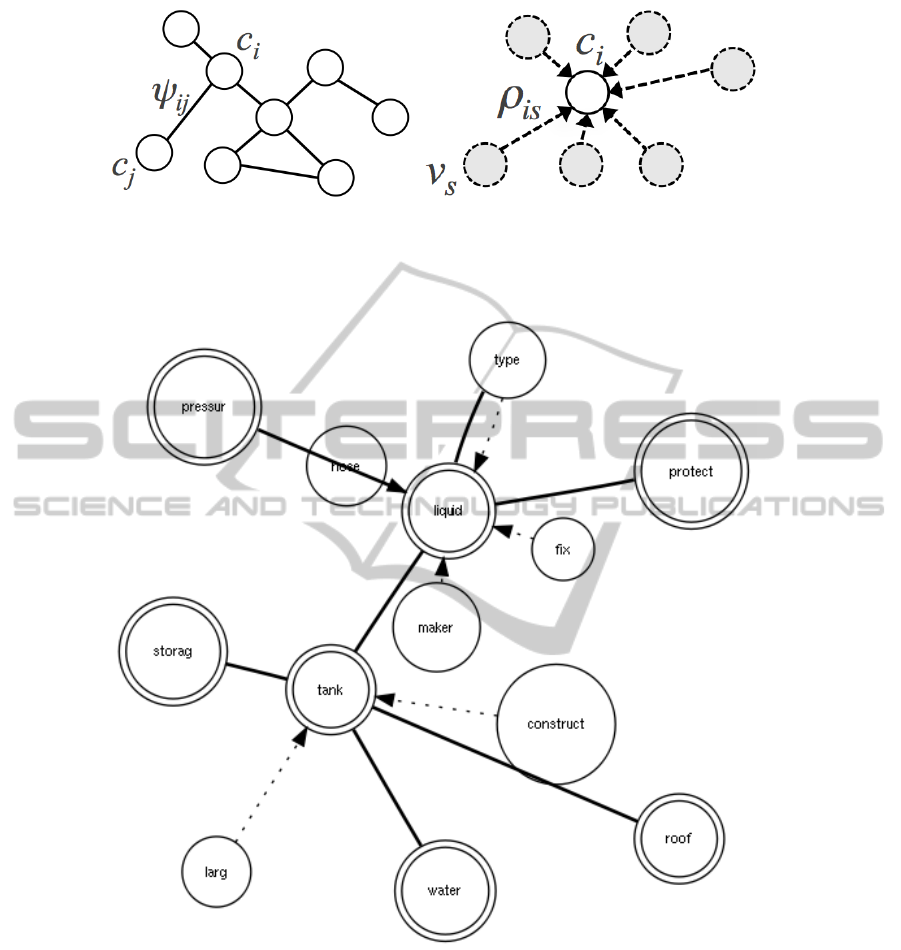
The graph is composed of a directed and an undi-
rected subgraph (or levels). We have the lowest level,
namely the word level, that is obtained by grouping
terms with a high degree of pairwise semantic relat-
edness; so there are several groups (clusters), each
of them represented as a cloud of words connected
to their respective centroids (directed edges), alter-
natively called concepts (see fig. 1(b)). Further, we
have the second level, namely the conceptual level,
obtained by inferring semantic relatedness between
centroids, and so between concepts (undirected edges,
see fig. 1(a)).
The general idea of this note is supported by pre-
vious works (Noam and Naftali, 2001) that have con-
firmed the potential of supervised clustering methods
for term extraction, also in the case of query expan-
sion (Cao et al., 2008; Lee et al., 2009).
2.1 Extracting a Mixed Graph of Terms
A mixed Graph of Terms (mGT ) is a hierarchical
structure composed of two levels of information rep-
resented through a directed and an undirected sub-
graph: the conceptual and word level.
We consider extracting it from a corpus D =
A NOVEL QUERY EXPANSION TECHNIQUE BASED ON A MIXED GRAPH OF TERMS
85
(a) (b)
Figure 1: Theoretical representation of the Graph of Terms’s levels. 1(a) The conceptual level, here the weight ψ
i j
represents
the probability that two concepts are semantically related. 1(b) The word level, here the weight ρ
in
represents the probability
that a word is semantically related to a concept (centroid).
Figure 2: Vector of features for the topic Storage Tanks. 2 A mixed Graph of Terms.
{w
1
,w
2
,··· , w
M
} of M documents (that we call train-
ing set), where each document is, following the
Vector Space Model (Christopher D. Manning and
Schtze, 2008), a vector of feature weights w
j
=
(w
1 j
,.. . , w
|T | j
), where T = {t
1
,··· ,t
|T |
} is the set of
features that occur at least once in at least one docu-
ment of D, and 0 ≤ w
k j
≤ 1 represents how much the
feature t
k
contributes to a semantics of document w
j
.
We choose to identify features with words, that is
the bags of words assumption, and in this case t
k
= v
k
,
where v
k
is one of the words of a vocabulary T .
The word level is composed of a set of words v
s
that specify through a directed weighted edge the con-
cept c
i
(see fig. 1(b), tab. 1 and fig. 2), or better the
centroid of such set (group or cluster), that is, there-
fore, still lexically denoted as a word. The weight ρ
is
can measure how far a word is related to a concept,
or how much we need such a word to specify that
concept, and it can be considered as a probability:
ρ
is
= P(c
i
|v
s
). The resulting structure is a subgraph
rooted on c
i
.
On the other hand, the conceptual level is com-
KDIR 2011 - International Conference on Knowledge Discovery and Information Retrieval
86
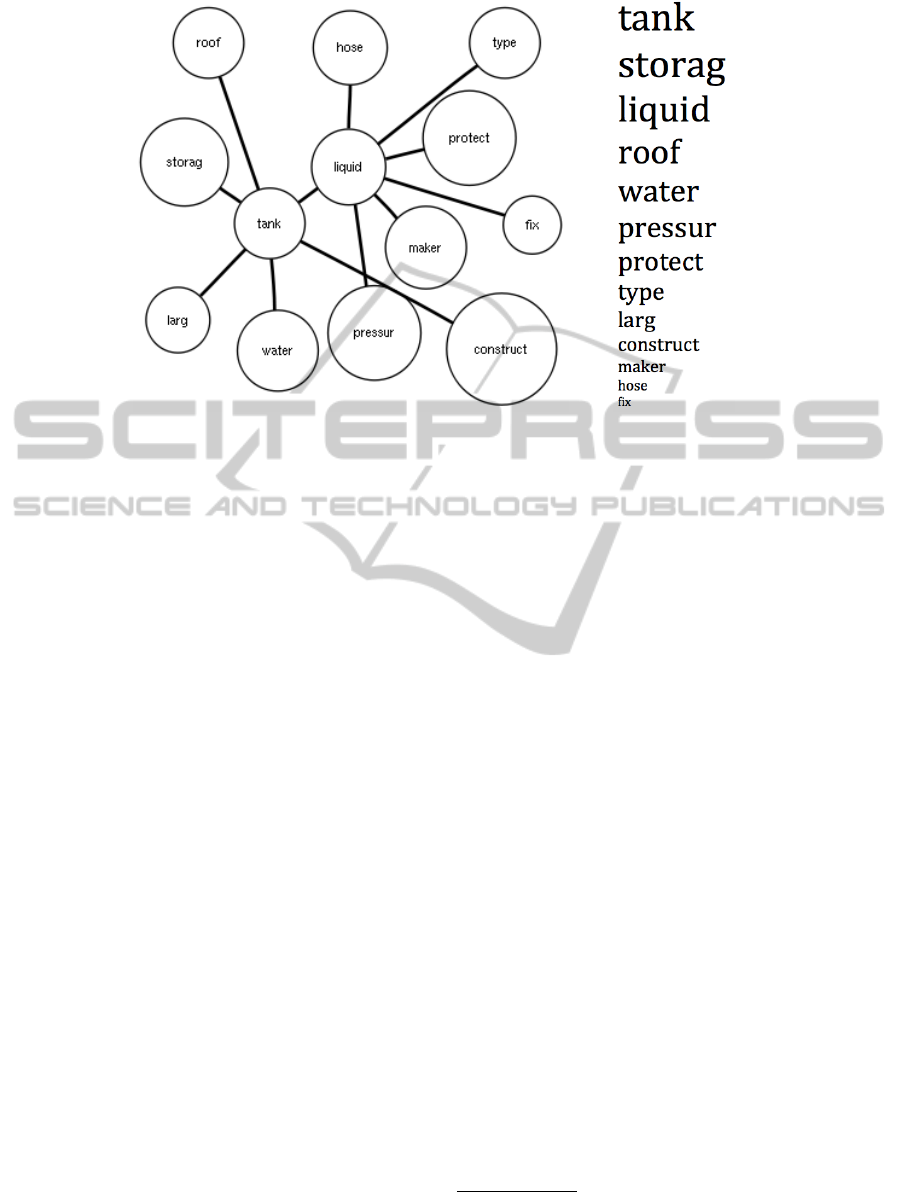
(a) (b)
Figure 3: Simpler Vector of features for the topic Storage Tanks.3(a) A Graph of Terms.3(b) A List of Terms.
posed of a set of interconnected, through undirected
weighted edges, concepts c
i
(see fig. 1(a), tab. 1 and
fig. 2), so forming a subgraph of pairs of centroids.
The weight ψ
i j
can be considered as the degree of se-
mantic correlation between two concepts and it can be
considered as a probability: ψ
i j
= P(c
i
,c
j
).
2.1.1 Graph Drawing
A mGT is well determined through the learning of
the weights, the Relation Learning, and through the
learning of three parameters, the Parameter Learning,
that are Λ = (H, τ, µ) which specify the shape of the
graph. In facts, we have:
1. H: the number of concepts (namely the number of
clusters) of the corpus D;
2. µ
i
: the threshold that establishes for each concept
the number of edges of the directed subgraph, and
so the number of concept/word pairs of the corpus
D. An edge between the word s and the concept i
can be saved if ρ
is
≥ µ
i
. We consider, to simplify
the formulation, µ
i
= µ, ∀i;
3. τ: the threshold that establishes the number of
edges of the undirected subgraph, and so the num-
ber of concept/concept pairs of the corpus D. An
edge between the concept i and concept j can be
saved if ψ
i j
≥ τ.
2.1.2 Relations Learning
Due to the fact that each concept is lexically repre-
sented by a word of the vocabulary, then we have
that ρ
is
= P(c
i
|v
s
) = P(v
i
|v
s
), and ψ
i j
= P(c
i
,c
j
) =
P(v
i
,v
j
).
As a result, we can obtain each possible relation
by computing the joint probability P(v
i
,v
j
) ∀i, j ∈ V ,
which can be considered as a word association prob-
lem and so can be solved through a smoothed ver-
sion of the generative model introduced in (Blei et al.,
2003) called Latent Dirichlet allocation, which makes
use of Gibbs sampling (Griffiths et al., 2007)
1
.
Furthermore, it is important to make clear that the
mixed Graph of Terms can not be considered as a co-
occurrence matrix. In fact, the core of the graph is
the probability P(v
i
,v
j
), which we regard as a word
association problem, that in the topic model is con-
sidered as a problem of prediction: given that a cue is
presented, which new words might occur next in that
context?
It means that the model does not take into account
the fact that two words occur in the same document,
but that they occur in the same document when a spe-
cific topic (and so a context) is assigned to that docu-
ment (Griffiths et al., 2007).
2.1.3 Parameters Learning
Given a corpus D, once each ψ
i j
and ρ
is
is known
∀i, j, s, letting the parameters assume different set of
values Λ
t
, we can observe a different graph mGT
t
,
where t is representative of different parameter val-
ues.
1
The authors reported the mathematical formulation that
leads from the Latent Dirichlet Allocation to P(v
i
,v
j
) in
(Clarizia et al., 2011)
A NOVEL QUERY EXPANSION TECHNIQUE BASED ON A MIXED GRAPH OF TERMS
87

A way of saying that a mGT is the best possible
for that set of documents is to demonstrate that it pro-
duces the maximum score attainable for each of the
documents when the same graph is used as a knowl-
edge base for querying in a set containing just those
documents which have fed the mGT builder.
Each graph mGT
t
can be represented, following
again the Vector Space Model (Christopher D. Man-
ning and Schtze, 2008), as a vector of feature weights
q
t
= (w
0
1t
,.. . , w
0
|T
p
|t
), where |T
p
|
t
represents the total
number of pairs.
We have that each feature t
k
= (v
i
,v
j
), that is not
the simple bags of words assumption, and w
0
k j
being
the weight calculated thanks to the tf-idf model ap-
plied to the pairs represented through t
k
, and with the
addition of the boost b
k
that is the semantic related-
ness between the words of each pair, of both the con-
ceptual and the word level, namely ψ
i j
and ρ
is
. Recall
that both ψ
i j
and ρ
is
are real values (probabilities) of
the interval [0,1], and so to distinguish the relevance
between the three cases, the traditional case (b
k
= 1),
the concept/word pair and the concept/concept pair,
we have distributed such values in a wider interval.
Specifically:
1. b
k
= 1 being the lowest level of relatedness;
2. b
k
∈ [ρ
min
,ρ
max
] with ρ
min
≥ 1 and
(ρ
max
− ρ
min
) = 1;
3. b
k
∈ [ψ
min
,ψ
max
] with ψ
min
> ρ
max
and
(ψ
max
− ψ
min
) = 1.
In the experiments we have chosen ρ
min
= 1, ψ
min
= 3
(see table 1).
At this point, also a document w
j
can be viewed
as a vector of weights in the space |T
p
|
t
, and so the
general formula of each weight is:
w
0
k j
=
tf-idf(t
k
,w
j
) · b
k
q
∑
|T
p
|
s=1
(tf-idf(t
s
,w
j
) · b
k
)
2
(1)
The score for each graph at time t can be computed
following the cosine similarity model in the space
|T
p
|, and so we have a score for each document S
t
=
{S(q
t
,w
1
),··· , S (q
t
,w
M
)}
t
.
As a result, to compute the optimum set of param-
eters Λ
t
we can maximise the function Fitness (F ),
and so,
Λ
∗
= argmax
Λ
t
{F (Λ
t
)}, (2)
where F (Λ
t
) = E
m
[S(q
t
,w
m
)] − σ
m
[S(q
t
,w
m
)],
where E
m
is the mean value of all elements of S
t
and σ
m
is the standard deviation. Since the space of
possible solutions could grow exponentially, we have
limited the space to |T
p
| < 150.
Furthermore, we have reduced the remaining
space of possible solutions by applying a clustering
method, that is the K-means algorithm, to all ψ
i j
and
ρ
is
values, and so that the optimum solution can be ex-
actly obtained after the exploration of the entire space.
This reduction allows us to compute a mGT from a
repository composed of a few documents in a reason-
able time (e.g. for 3 documents it takes about 3 sec-
onds with a Mac OS X based computer and a 2.66
GHz Intel Core i7 CPU and a 8GB RAM).
Table 1: An example of a mGT for the topic Storage Tank.
Conceptual Level
Concept i Concept j Relation Factor (ψ
i j
)
tank roof 4,0
tank water 3,37246
tank liquid 3,13853
··· ··· ···
liquid type 3,43828
liquid pressur 3,07028
··· ··· ···
Word Level
Concept i Word s Relation Factor (ρ
is
)
tank larg 2,0
tank construct 1,6
··· ··· ···
liquid type 1,21123
liquid maker 1,11673
liquid hose 1,06024
liquid fix 1
··· ··· ···
3 EXTRACTING SIMPLER
REPRESENTATION FROM A
mGT
From the mixed Graph of Terms we can select dif-
ferent subsets of features and so obtaining simpler
representations (see figg. 3(a) and 3(b)). Before dis-
cussing in details, we recall that ψ
i j
= P(v
i
,v
j
) and
ρ
is
= P(v
i
|v
s
) are computed through the Topic Model
which also computes the probability for each word
η
s
= P(v
s
).
3.1 Graph of Terms
We can obtain a simpler representation by firstly se-
lecting all distinct possible pairs from the mGT (see
the table 1 to better understand) and secondly by uni-
form all their weights.
Note that even if both ψ
i j
and ρ
is
are real values
of the interval [0,1], they are not comparable because
KDIR 2011 - International Conference on Knowledge Discovery and Information Retrieval
88

one is a joint probability and the latter is a conditional.
Therefore, in order to make them to be comparable
we consider the product ρ
is
· η
s
instead of each ρ
is
.
Finally, to uniform all weights we do not shift each
ψ
i j
and ρ
is
· η
s
values from [0,1] to [ρ
min
,ρ
max
] and
[ψ
min
,ψ
max
] respectively, which means that we com-
press the conceptual over the word level. Following
this procedure we obtain a single level representation
named Graph of Terms (GT ), composed of weighted
pairs of words as in fig. 3(a).
3.2 List of Terms
We can obtain the simplest representation by select-
ing from the mGT all distinct terms and associating
them their weight η
s
= P(v
s
) computed through the
Topic Model. We name this representation List of
Terms (LT ), see fig. 3(b).
4 EXPERIMENTS
We have compared 3 different query expansion
methodologies based on different vector of features:
the mixed Graph of Terms (mGT ), the Graph of
Terms (GT ) and the List of Terms (LT ).
We have embedded all the techniques in an open
source text-based search engine, Lucene from the
Apache project. Here the score function S (q, w) is
based on the standard vector cosine similarity
2
, used
in a Vector Space Model combined with the Boolean
Model (Christopher D. Manning and Schtze, 2008)
which takes into account the boost factor b
k
whom
default value is 1, and it is assigned to the words that
compose the original query.
Such a function permits the assignments of a rank
to documents w that match a query q and permits the
transforming of each vector of features, that is the
mGT , GT and LT , into a set of Boolean clauses.
For instance, in the case of the mGT , since it is rep-
resented as pairs of related words, see Table 1, where
the relationship strength is described by a real value
(namely ψ
i j
and ρ
is
, the Relation factors), the ex-
panded query is:
((tank AND roo f )
4.0
) OR ((tank AND larg)
2.0
)...
As a consequence we search the pair of words tank
AND roof with a boost factor of 4.0 OR the pair of
words tank AND larg with a boost factor of 2.0 and
so on. For all the experiments we have considered
ρ
min
= 1 and ψ
min
= 3 (table 1).
2
We have used the Lucene version 2.4 and you can find
details on the similarity at http://lucene.apache.org
4.1 Data Preparation
The evaluation of the method has been conducted on
a web repository collected at University of Salerno
by crawling 154,243 web pages for a total of about
3.0 GB by using the website ThomasNet (http://
www.thomasnet.com) as index of URLs, the refer-
ence language being English
3
.
ThomasNet, known as the “big green books” and
“Thomas Registry”, is a multi-volume directory of in-
dustrial product information covering 650,000 distrib-
utors, manufacturers and service companies within
67,000-plus industrial categories. We have down-
loaded webpages from the company websites related
to 150 categories of products (considered as topics),
randomly chosen from the ThomasNet directory.
Note that even if the presence or absence of cat-
egories in the repository depends on the random
choices made during the crawling stage, it could hap-
pen that webpages from some business companies
cover categories that are different from those ran-
domly chosen.
This means that the repository is not to be consid-
ered as representative of a low number of categories
(that is 150) but as a reasonable collection of hun-
dreds of categories. In this work we have considered
50 test questions (queries) extracted from 50 out of
the initial 150 categories (topics). Each original query
corresponds to the name of the topic, for instance if
we search for information about the topic ”genera-
tor” therefore the query will be exactly ”generator”.
Obviously, all the initial queries have been expanded
through the methodologies explored in section 3.
Here we show the summary results obtained on all
the 50 topics and the results obtained on the first 10
examples, that are: 1. Lubricant, 2. Pump, 3. Adhe-
sive, 4. Generator, 5. Transformers, 6. Inverter, 7.
Valve, 8. LAN Cable, 9. Storage Tank, 10. Extractor.
4.2 Evaluation Measures
For each example the procedure that obtains the re-
formulation of the query, is explained as follows. A
person, who is interested in the topic ”generator”, per-
forms the initial query ”generator” and so interac-
tively choosing 3 relevant documents for that topic,
which represent the minimal positive feedback.
From those documents the system automatically
extracts the three vectors of features. In table 2 we
show the average size of the list of terms and the
list of pairs, that is 57 and 73 respectively for each
3
The repository will be public on our website to allow
further investigations from other researchers.
A NOVEL QUERY EXPANSION TECHNIQUE BASED ON A MIXED GRAPH OF TERMS
89

Table 2: Number of terms and pairs for each mGT .
Topic Query ] of terms ] of pairs
1 Lubricant 54 69
2 Pump 63 70
3 Adhesive 45 67
4 Generator 58 68
5 Transformers 67 82
6 Inverter 62 84
7 Valve 47 66
8 LAN Cable 69 85
9 Storage Tank 51 66
10 Extractor 53 71
Average Size 55 72
topic. The user has interactively assigned the rele-
vance of the documents by following an xml based
schema coding his intentions and represented as in the
following:
<topic number=”9” type=”faceted” >
<query> storage tanks</query>
<description>
I am looking for information on storage tanks.
</description>
<subtopic number=”1” type=”inf” >
I am looking for web pages containing
datasheets of several storage tank types
</subtopic>
<subtopic number=”2” type=”inf” >
···
</subtopic>
<subtopic number=”10” type=”inf” >
I am looking for descriptions of storage tanks
as products
</subtopic>
</topic>
The expanded queries have been again performed
and for each context we have asked different humans
to assign graded judgments of relevance to the first
100 pages returned by the system.
Due to the fact that the number of evaluations for
each topic, and so the number of topics itself, is small,
humans have judged, in contrast to the Minimum Test
Collection method (Carterette et al., 2008), all the re-
sults obtained. The assessment is based on three lev-
els of relevance, high relevant, relevant and not rele-
vant, assigned, to avoid cases of ambiguity, by follow-
ing the xml based schema coding the user intentions,
and introduced before.
The accuracy has been measured through standard
indicators provided by (Christopher D. Manning and
Schtze, 2008) and based on Precision and Recall,
eAP =
1
ER
k
∑
i=1
x
i
i
+
∑
j>i
x
i
x
j
j
(3)
ePrec@k = eP@k =
1
k
k
∑
i=1
x
i
(4)
ERprec =
1
ER
ER
∑
i=1
x
i
(5)
ER =
n
∑
i=1
x
i
(6)
where eAP indicates the average precision on a topic,
x
i
and x
j
are Boolean indicators of relevance, k is the
cardinality of the considered result set (k=100), ER is
a subset of relevant documents
4
. The factor ERprec is
the precision at the level ER, while the measure eMAP
is the average of all eAP over topics. The measure
eP@k is the precision at level k (for instance eP5 is
the precision calculated by taking the top 5 results).
Further we have considered other standard mea-
sures of performance which take into account the
quality of the results related to the position in which
they are presented. We have considered the Cu-
mulative Gain (CG) and the Discounted Cumula-
tive Gain (DCG), the normalized Discontinued Cu-
mulative Gain (nDCG), and the Ideal DCG, that is
nDCG
x
=
DCG
x
IDCG
x
. Specifically:
CG
x
=
k
∑
i=1
rel
i
(7)
DCG
x
=
k
∑
i=1
2
rel
i
− 1
log
2
(1 + i)
. (8)
where we have considered rel = 2, rel = 1 and rel = 0
in case of High Relevant, Relevant and Not Relevant
documents respectively.
4.3 Discussion
In table 3 we find all the measures for each topic while
in table 4 we find summary results across topics and
both tables report results for each vector of features.
The overall behavior of the mGT method is bet-
ter than both the GT and LT , especially in the case
of the topics 2, 3 and 7. In fact, in these cases the
proposed method has listed 62, 67 and 76 relevant or
high relevant documents in the top 100, that is about
68% (see also the column Rel of table 5).
However, in the case of topics 4, 6 and 8 the num-
ber of relevant documents is comparable between the
systems, with the percentage of relevant documents
retrieved being about 30%, that is less than half of the
worst value obtained for the topic 2. This suggests
that the systems are comparable only if the total num-
ber of relevant documents returned by both systems is
less than 50%.
4
Note that, ER = |R
mGT
∪ R
GT
∪ R
LT
− R
mGT
∩ R
GT
∩
R
LT
|, where R
v f
is the set of relevant and high relevant doc-
uments obtained for a given topic and vf=vector of features.
KDIR 2011 - International Conference on Knowledge Discovery and Information Retrieval
90
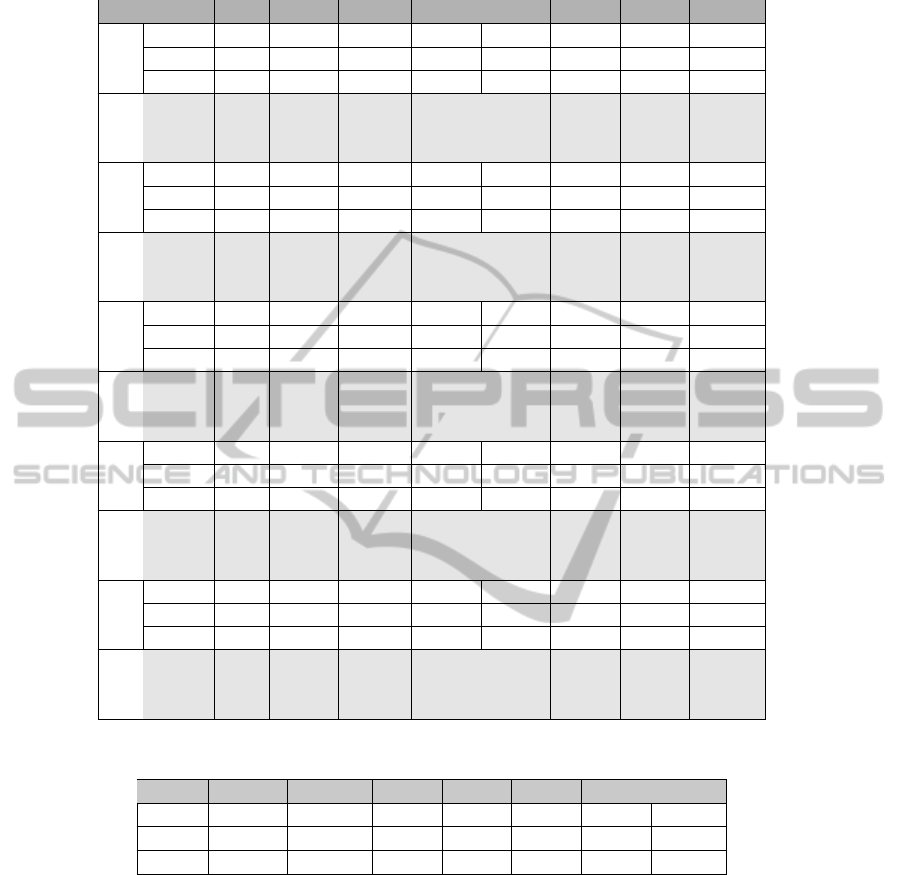
Table 3: Indices of performance on different topics.
Topic eR eAP eR pr eP5 eP10 eP20 eP30 eP100
mGT 64 0.594 0.703 1.000 0.778 0.737 0.586 0.546
1 GT 64 0.517 0.625 1.000 0.778 0.684 0.552 0.495
LT 64 0.330 0.406 0.750 0.667 0.737 0.655 0.354
mGT 76 0.561 0.592 1.000 1.000 0.737 0.690 0.626
2 GT 76 0.481 0.500 1.000 1.000 0.684 0.690 0.566
LT 76 0.254 0.395 0.750 0.667 0.632 0.552 0.374
mGT 75 0.740 0.720 1.000 1.000 1.000 0.793 0.667
3 GT 75 0.626 0.693 1.000 1.000 1.000 0.759 0.576
LT 75 0.366 0.440 0.500 0.778 0.895 0.621 0.444
mGT 73 0.501 0.589 1.000 0.667 0.842 0.862 0.485
4 GT 73 0.534 0.603 1.000 0.667 0.842 0.862 0.525
LT 73 0.683 0.658 0.750 0.889 0.947 0.828 0.616
mGT 49 0.484 0.469 1.000 0.889 0.842 0.552 0.364
5 GT 49 0.439 0.429 1.000 0.889 0.790 0.517 0.333
LT 49 0.299 0.429 1.000 0.556 0.368 0.379 0.313
mGT 39 0.575 0.590 0.750 0.778 0.842 0.724 0.333
6 GT 39 0.580 0.590 0.750 0.778 0.842 0.690 0.343
LT 39 0.657 0.667 0.750 0.889 0.895 0.724 0.354
mGT 100 0.615 0.760 1.000 0.889 0.842 0.828 0.758
7 GT 100 0.633 0.780 1.000 0.778 0.790 0.828 0.788
LT 100 0.392 0.570 1.000 0.667 0.632 0.621 0.566
mGT 28 0.318 0.321 0.500 0.556 0.316 0.345 0.242
8 GT 28 0.327 0.357 0.500 0.556 0.316 0.345 0.242
LT 28 0.465 0.393 1.000 0.556 0.474 0.379 0.273
mGT 45 0.735 0.667 1.000 1.000 0.895 0.793 0.434
9 GT 45 0.679 0.600 1.000 1.000 0.947 0.759 0.404
LT 45 0.146 0.156 0.750 0.556 0.368 0.241 0.162
mGT 63 0.584 0.693 0.999 0.768 0.727 0.576 0.536
10 GT 63 0.507 0.615 0.999 0.768 0.674 0.542 0.485
LT 63 0.320 0.396 0.740 0.657 0.727 0.645 0.344
Table 4: Average values of performance.
run eMAP eRprec eP5 eP10 eP20 eP30 eP100
mGT 0.569 0.601 0.917 0.840 0.784 0.686 0.495
GT 0.535 0.575 0.917 0.827 0.766 0.667 0.475
LT 0.399 0.457 0.806 0.691 0.661 0.556 0.384
This probably happens due to the fact that the doc-
uments feeding the vector of features builder have
not covered, in terms of subtopics, all the examples
present in the repository.
Notwithstanding this, the most important fact is
that, when the graph is added to the initial query,
the search engine shows better performances than the
case of both a graph of word pairs and a simple word
list. As we can see in Table 5, the results on topics 4, 6
and 8 are the worst cases, while topics 2, 3, 5, 7, 9 and
10 are the best, as confirmed by previous discussions
on table 3.
5 CONCLUSIONS
In this work we have demonstrated that a mixed
Graph of Terms based on a hierarchical representa-
tion is capable of retrieving a greater number of rel-
evant documents than a representations less complex
based on both a simple interconnected pairs of words
or a list of words, even if the size of the training set is
small and composed of only relevant documents.
These results suggest that our approach can be em-
ployed in a kind of interactive query expansion pro-
cess, where the user can initially perform a query
composed of key words, and later can select only rel-
A NOVEL QUERY EXPANSION TECHNIQUE BASED ON A MIXED GRAPH OF TERMS
91

Table 5: Cumulative Gain (CG), Discounted Cumulative Gain (DCG), Normalized Discounted Cumulative Gain (nDCG).
Topic Rel CG DCG IDCG nDCG
1 mGT 55 80 25.536 30.030 0.850
GT 49 74 24.528 28.985 0.846
LT 35 42 15.502 17.421 0.890
2 mGT 62 81 24.257 28.577 0.849
GT 57 75 22.654 27.271 0.831
LT 37 55 17.053 23.690 0.720
3 mGT 67 76 18.568 24.288 0.764
GT 57 64 16.320 21.385 0.763
LT 44 50 12.048 18.435 0.654
4 mGT 48 63 19.330 24.267 0.797
GT 52 67 20.361 24.970 0.815
LT 61 74 21.352 25.495 0.837
5 mGT 36 60 23.714 26.175 0.906
GT 33 55 22.325 24.728 0.903
LT 31 44 16.330 20.072 0.814
6 mGT 33 39 10.698 16.366 0.654
GT 34 40 10.823 16.561 0.654
LT 35 41 11.069 16.754 0.661
7 mGT 76 98 25.405 32.205 0.789
GT 78 100 25.696 32.522 0.790
LT 57 85 23.748 31.621 0.751
8 mGT 24 32 11.817 15.826 0.747
GT 24 32 11.943 15.826 0.755
LT 27 35 12.369 16.457 0.752
9 mGT 43 60 20.977 24.336 0.862
GT 40 55 19.763 22.814 0.866
LT 16 20 8.775 11.229 0.781
10 mGT 54 79 24.436 29.920 0.818
GT 48 73 23.428 27.885 0.840
LT 34 41 14.402 16.321 0.882
evant examples from the result set and so feed the
mGT builder. At this point, the system can add the
knowledge extracted from those documents suggested
by the user, and the query can be performed again.
REFERENCES
Baeza-Yates, R. and Ribeiro-Neto, B. (1999). Modern In-
formation Retrieval. ACM Press, New York.
Bhogal, J., Macfarlane, A., and Smith, P. (2007). A review
of ontology based query expansion. Information Pro-
cessing & Management, 43(4):866 – 886.
Blei, D. M., Ng, A. Y., and Jordan, M. I. (2003). Latent
dirichlet allocation. Journal of Machine Learning Re-
search, 3(993–1022).
Callan, J., Croft, W. B., and Harding, S. M. (1992). The
inquery retrieval system. In In Proceedings of the
Third International Conference on Database and Ex-
pert Systems Applications, pages 78–83. Springer-
Verlag.
Cao, G., Nie, J.-Y., Gao, J., and Robertson, S. (2008).
Selecting good expansion terms for pseudo-relevance
feedback. In Proceedings of the 31st annual inter-
national ACM SIGIR conference on Research and de-
velopment in information retrieval, SIGIR ’08, pages
243–250, New York, NY, USA. ACM.
Carpineto, C., de Mori, R., Romano, G., and Bigi, B.
(2001). An information-theoretic approach to auto-
matic query expansion. ACM Trans. Inf. Syst., 19:1–
27.
Carterette, B., Allan, J., and Sitaraman, R. (2008). Minimal
test collections for retrieval evaluation. In 29th In-
ternational ACM SIGIR Conference on Research and
development in information retrieval.
Christopher D. Manning, P. R. and Schtze, H. (2008). In-
troduction to Information Retrieval. Cambridge Uni-
versity.
Clarizia, F., Greco, L., and Napoletano, P. (2011). An adap-
tive optimisation method for automatic lightweight
ontology extractions. In Filipe, J. and Cordeiro, J., ed-
itors, Lecture Notes in Business Information Process-
ing, page 357371. Springer-Verlag Berlin Heidelberg.
Collins-Thompson, K. and Callan, J. (2005). Query expan-
sion using random walk models. In Proceedings of
the 14th ACM international conference on Informa-
KDIR 2011 - International Conference on Knowledge Discovery and Information Retrieval
92

tion and knowledge management, CIKM ’05, pages
704–711, New York, NY, USA. ACM.
Dumais, S., Joachims, T., Bharat, K., and Weigend, A.
(2003). SIGIR 2003 workshop report: implicit mea-
sures of user interests and preferences. SIGIR Forum,
37(2):50–54.
Efthimiadis, E. N. (1996). Query expansion. In Williams,
M. E., editor, Annual Review of Information Systems
and Technology, pages 121–187.
Griffiths, T. L., Steyvers, M., and Tenenbaum, J. B. (2007).
Topics in semantic representation. Psychological Re-
view, 114(2):211–244.
Jansen, B. J., Booth, D. L., and Spink, A. (2008). Determin-
ing the informational, navigational, and transactional
intent of web queries. Information Processing & Man-
agement, 44(3):1251 – 1266.
Jansen, B. J., Spink, A., and Saracevic, T. (2000). Real
life, real users, and real needs: a study and analysis
of user queries on the web. Information Processing &
Management, 36(2):207–227.
Ko, Y. and Seo, J. (2009). Text classification from unlabeled
documents with bootstrapping and feature projection
techniques. Inf. Process. Manage., 45:70–83.
Lang, H., Metzler, D., Wang, B., and Li, J.-T. (2010).
Improved latent concept expansion using hierarchi-
cal markov random fields. In Proceedings of the
19th ACM international conference on Information
and knowledge management, CIKM ’10, pages 249–
258, New York, NY, USA. ACM.
Lee, C.-J., Lin, Y.-C., Chen, R.-C., and Cheng, P.-J. (2009).
Selecting effective terms for query formulation. In
Lee, G., Song, D., Lin, C.-Y., Aizawa, A., Kuriyama,
K., Yoshioka, M., and Sakai, T., editors, Information
Retrieval Technology, volume 5839 of Lecture Notes
in Computer Science, pages 168–180. Springer Berlin
/ Heidelberg.
Noam, S. and Naftali, T. (2001). The power of word clus-
ters for text classification. In In 23rd European Collo-
quium on Information Retrieval Research.
Okabe, M. and Yamada, S. (2007). Semisupervised query
expansion with minimal feedback. IEEE Transactions
on Knowledge and Data Engineering, 19:1585–1589.
Piao, S., Rea, B., McNaught, J., and Ananiadou, S. (2010).
Improving full text search with text mining tools. In
Horacek, H., Mtais, E., Muoz, R., and Wolska, M., ed-
itors, Natural Language Processing and Information
Systems, volume 5723 of Lecture Notes in Computer
Science, pages 301–302. Springer Berlin / Heidelberg.
Robertson, S. E. (1991). On term selection for query expan-
sion. J. Doc., 46:359–364.
Robertson, S. E. and Walker, S. (1997). On relevance
weights with little relevance information. In Proceed-
ings of the 20th annual international ACM SIGIR con-
ference on Research and development in information
retrieval, SIGIR ’97, pages 16–24, New York, NY,
USA. ACM.
Ruthven, I. (2003). Re-examining the potential effective-
ness of interactive query expansion. In Proceedings
of the 26th annual international ACM SIGIR confer-
ence on Research and development in informaion re-
trieval, SIGIR ’03, pages 213–220, New York, NY,
USA. ACM.
Sebastiani, F. (2002). Machine learning in automated text
categorization. ACM Comput. Surv., 34:1–47.
A NOVEL QUERY EXPANSION TECHNIQUE BASED ON A MIXED GRAPH OF TERMS
93
