
LEARNING SIMILARITY FUNCTIONS FOR EVENT
IDENTIFICATION USING SUPPORT VECTOR MACHINES
Timo Reuter and Philipp Cimiano
Semantic Computing Group, CITEC, Universit
¨
at Bielefeld, Bielefeld, Germany
Keywords:
Clustering/classification, Machine learning, Similarity function, Event identification, Weight adjustment, Sup-
port vector machine, Data mining.
Abstract:
Every clustering algorithm requires a similarity measure, ideally optimized for the task in question. In this
paper we are concerned with the task of identifying events in social media data and address the question of
how a suitable similarity function can be learned from training data for this task. The task consists essentially
in grouping social media documents by the event they belong to. In order to learn a similarity measure using
machine learning techniques, we extract relevant events from last.fm and match the unique machine tags for
these events to pictures uploaded to Flickr, thus getting a gold standard were each picture is assigned to its
corresponding event. We evaluate the similarity measure with respect to accuracy on the task of assigning
a picture to its correct event. We use SVMs to train an appropriate similarity measure and investigate the
performance of different types of SVMs (Ranking SVMs vs. Standard SVMs), different strategies for creating
training data as well as the impact of the amount of training data and the kernel used. Our results show that
a suitable similarity measure can be learned from a few examples only given a suitable strategy for creating
training data. We also show that i) Ranking SVMs can learn from fewer examples, ii) are more robust com-
pared to standard SVMs in the sense that their performance does not vary significantly for different sizes and
samples of training data and iii) are not as prone to overfitting as standard SVMs.
1 INTRODUCTION
As the amount of data uploaded to social media por-
tals such as Flickr
1
, Youtube
2
, Panoramio
3
, etc. keeps
proliferating, techniques for structuring this massive
content become crucial. Clustering approaches rep-
resent an important technique to organize social me-
dia data according to topics, for example by group-
ing Flickr data into clusters of pictures describing the
same event (Becker et al., 2010; Firan et al., 2010).
The latter task has been dubbed event identification
(Becker et al., 2010).
While this task can be formulated as a supervised
classification task (Firan et al., 2010), it is most natu-
rally modeled as a clustering task as the set of events
is not fixed, but changes over time. Previous re-
search has in fact shown that incremental clustering
approaches which assign a new data point to the most
similar cluster can be applied successfully to the event
identification problem (Becker et al., 2010).
1
http://flickr.com
2
http://youtube.com
3
http://panoramio.com
In order to apply clustering algorithms to social
media data, an appropriate similarity measure sim :
D × D → ℜ is needed, where D is the representation
of some social media document.
This similarity measure can then be used in a clus-
tering algorithm of our choice. In order to improve
the performance of a clustering approach on a given
problem, it seems natural to optimize the similarity
measure and other parameters of the clustering algo-
rithm for the task at hand. This has been referred to
as supervised clustering (Finley and Joachims, 2005).
While some approaches only optimize the similarity
measure (Eick et al., 2005), other approaches even op-
timize the clustering parameters in a supervised fash-
ion by using a genetic algorithm to search efficiently
for a good clustering (Demiriz et al., 1999).
In this paper we are concerned with the optimiza-
tion of the similarity measure in the context of the
event identification task. Building on state-of-the-
art machine learning techniques, Support Vector Ma-
chines in particular, we analyze different approaches
to learn a similarity measure for the task of event iden-
tification. First of all, we analyze the impact of using
208
Reuter T. and Cimiano P..
LEARNING SIMILARITY FUNCTIONS FOR EVENT IDENTIFICATION USING SUPPORT VECTOR MACHINES.
DOI: 10.5220/0003654602000207
In Proceedings of the International Conference on Knowledge Discovery and Information Retrieval (KDIR-2011), pages 200-207
ISBN: 978-989-8425-79-9
Copyright
c
2011 SCITEPRESS (Science and Technology Publications, Lda.)

different types of Support Vector Machines, compar-
ing standard SVMs to the RankingSVMs by Joachims
(Joachims, 2002). Further, we show the impact of dif-
ferent strategies for constructing the training dataset
and investigate the performance of the learned models
depending on the number of training examples used.
We also analyze the impact of using a linear vs. RBF
kernel on the task and carry out a feature analysis.
In our experiments, we use a dataset derived from
Flickr consisting of 300,000 pictures. These pictures
have been uploaded to Flickr by users together with
a so-called machine tag that uniquely assigns these
pictures to an event from last.fm
4
. As we have knowl-
edge about which events pictures belong to, this data
is a natural choice to optimize the similarity measure
in a supervised fashion. We evaluate the similarity
function on the task of predicting the right cluster that
a new data item should be assigned to, using a sim-
ilar algorithm as presented by Becker et al. (Becker
et al., 2010). The main evaluation criteria is accuracy,
i.e. the percentage of data points that have been as-
signed to the correct cluster. In particular, we provide
the following contributions in this paper:
1. We directly compare standard SVMs and Ranking
SVMs on the task of inducing an appropriate simi-
larity measure for event identification on the basis
of training data consisting of assignments of pic-
tures to events. We show that the performance of
the RankingSVM is much more robust compared
to the performance of the standard SVM as the
results of the SVM vary significantly depending
on the amount of training data. In particular, we
show that the SVM is more prone to overfitting.
2. The ranking SVMs can learn very good models
with a small number of training examples, while
a standard SVM needs considerably more exam-
ples.
3. We investigate different strategies for creating
training datasets and show that strategies which
use the temporal order of the data are better than a
random strategy for sampling training examples.
4. Finally, we show that linear kernels outperform
RBF kernels on both a standard SVM as well as
the RankingSVMs of Joachims (Joachims, 2002).
The paper is structured as follows: in Section 2
we describe the event identification problem more for-
mally and show how standard SVMs and Ranking
SVMs can be used to optimize the parameters of a
similarity measure. We describe our dataset and show
the results of our experiments in Section 3. In Section
4 and 5 we discuss related work and conclude.
4
http://www.last.fm
2 PROBLEM STATEMENT
The problem of event identification in social media
has been introduced by (Becker et al., 2010). They
formulate this problem as a supervised clustering
problem in which the underlying similarity function
and other parameters of the clustering algorithm are
optimized using labeled data.
Let E be the set of all event clusters. In princi-
ple we need a function a
t
: D → E
t
which assigns a
document d ∈ D to some of the events E (clusters)
available at time t. As the number of documents and
event clusters is not known, we want our decision to
depend on a similarity function sim which assigns the
document to the event cluster maximizing the similar-
ity:
a
t
(d) = arg max
e∈E(t)
sim(d, e)
The similarity function to be learned has the fol-
lowing form:
sim : D × E → [0..1]
A central question is which model is assumed for
such a function. In our approach we follow Becker et
al. who assume a linear model for this function, using
features such as time, location, tags etc. The features
correspond essentially to simple similarity measures
for different dimensions. The similarity between a
picture and a centroid is calculated using the follow-
ing linear model:
sim(d, e) = ~w ·~v
sim
(d, e),
where ~w is a weight vector and ~v is the feature
vector for a document pair (see Section 2.1).
Therefore, the problem is to optimize the weight
vector ~w (and thus the function sim) for the task of
assigning documents to the right event.
In order to formalize the idea, let us introduce
some terminology. Let d
i
be a datapoint to be as-
signed to some cluster. Let e(d
i
) be the correct cluster
for d
i
according to our labeled training data. We de-
fine the following functions:
• a function cent assigning each event a centroid
vector averaging over all data items belonging to
this event: cent : E → R
n
• a function e assigning each document d
i
to its cor-
responding event: e : d
i
→ E (only used for eval-
uation purposes)
• a function defining the extension ext of a certain
event e ∈ E consisting of all the data items belong-
ing to this event: ext : E → P(D)
LEARNING SIMILARITY FUNCTIONS FOR EVENT IDENTIFICATION USING SUPPORT VECTOR MACHINES
209

2.1 Pairwise Features
We use 3 features to build up the feature vector
~v
sim
(d, c): timestamp, geographic feature, and tags.
The single features are defined as described in Reuter
et al. (2011). Overall, a feature vector for a pair of a
document and centroids looks as follows:
~v
sim
(d, c) =
sim
time
(d, c)
sim
geo
(d, c)
sim
tags
(d, c)
2.2 Problem Formulation using a
“Standard” SVM
Becker et al. show that using SVMs to learn such a
similarity function for the event identification prob-
lem delivers satisfactory results compared to more
naive strategies. A “standard” SVM determines a hy-
perplane h~w,~v
sim
(d, c)i + b = 0 which separates two
classes in a way that the margin to the hyperplane is
maximized. As a perfect separation between positive
and negative examples can not always be achieved,
classification errors are allowed, the goal being to
determine a hyperplane which minimizes errors and
maximizes the margin that separates the data. Ac-
cording to Cortes and Vapnik, this problem can be
formulated as follows (Cortes and Vapnik, 1995):
min
w,ξ
1
2
||w||
2
+C
`
∑
i=1
ξ
i
(1)
y
i
(hw, Φ(x
i
)i + b) ≥ 1 − ξ
i
,ξ
x
≥ 0 (2)
As usual, Φ(x
i
) is some kernel, the dot product in
the simplest case, C is a user-defined constant allow-
ing to trade-off margin size against the training error,
ξ
i
are slack variables and y
i
∈ {−1,1} is the class la-
bel.
In our case the training examples x
i
are defined as
follows:
x
i
=
(
(d
i
,e),−1
i f e
0
6∈ e(d
i
)
(d
i
,e),+1
else
Assuming a functional margin of 1 as typically
used in Support Vector Machines, the weight vector
~w needs to fulfill the following conditions:
∀d
i
h~w,Φ(d
i
,e(d
i
))i > 1(−ξ
i
) (3)
∀d
i
∀e
0
6= e(d
i
) h~w,Φ(d
i
,e
0
)i < −1(+ξ
i
) (4)
In Becker et al. such a function is applied to com-
pare a new document to the centroid of every cluster
constructed so far, assigning the new data point to the
cluster maximizing this similarity, provided it is over
a threshold θ
sim
. If the similarity is under the thresh-
old, a new event cluster is created. If a new cluster e
0
is created at time t, then E(t +1) = E(t)∪e
0
. Learning
the similarity function is thus formulated essentially
as a standard classification problem, separating those
pairs of documents that belong to the same event from
those that do not.
2.3 Event Identification as a Ranking
SVM Problem
According to the formulation of the event identifica-
tion problem according to Becker et al., the similarity
function is used to determine that cluster having the
highest similarity to the given data point. This can
be seen in fact as a ranking problem, the task being to
rank all the clusters according to their similarity to the
data point. This would provide us with an alternative
formulation of the problem, i.e. the one of learning a
similarity function that always assigns a higher value
to the right cluster compared to all the other clusters.
The task is to learn a similarity function that satisfies
the following condition:
∀d
i
∀e
0
6= e(d
i
) sim(d
i
,e(d
i
)) > sim(d
i
,e
0
) (5)
or, which is equivalent:
∀d
i
∀e
0
6= e(d
i
)
(sim(d
i
,e(d
i
)) − sim(d
i
,e
0
)) > 0 (6)
Assuming that we have a linear model for sim and the
weight vector is denoted by ~w, we have the following
condition:
∀d
i
∀e
0
6= e(d
i
)
~w(~v
sim
(d
i
,e(d
i
)) −~v
sim
(d
1
,e
0
)) > 0 (7)
Note that this problem is essentially equivalent
to the optimization problem solved by the ranking
SVMs of Thorsten Joachims (Joachims, 2002). As-
suming a margin of 1 we would get the equivalent
formulation, which is the one used by Joachims:
∀d
i
∀e
0
6= e(d
i
)
~w(~v
sim
(d
i
,e(d
i
)) −~v
sim
(d
1
,e
0
)) > 1(−ξ
i
) (8)
Given this formulation of the problem of learning
an adequate similarity as a learning to rank problem,
we can apply the Ranking SVM of Joachims in an off-
the-shelf manner directly to the problem of learning a
suitable similarity function for the event identification
problem.
Clearly, learning a ~w that fulfills the condition in
(8) also implies finding a ~w that fulfills the conditions
(1) and (2). In some sense, the conditions in (2) might
be too restrictive for the problem at hand. In this
sense, we might be solving a more difficult problem
than the one we indeed have to solve when using the
standard SVM criteria.
KDIR 2011 - International Conference on Knowledge Discovery and Information Retrieval
210

2.4 Sampling Strategies
In this section we describe three different strategies
to construct the training dataset on the basis of which
the similarity function is learned. Each data split con-
sists of a subset of all the documents in question.
For each document and each centroid representing an
event, the corresponding similarity vector~v
sim
(d, c) is
computed. Pairs (d
i
,e(d
i
)) consisting of a document
d
i
and the event e(d
i
) it belongs to are used as posi-
tive examples. For all strategies, we make sure that
the training data set is balanced, generating a num-
ber of negative examples that matches the number of
positive examples. We describe below how this is
achieved for the three different strategies we consider:
• Random. Using this method, we retrieve the sub-
set of documents from the training set randomly.
In order to create the negative examples, we com-
pute the similarity vector using the document and
a randomly chosen centroid to which the docu-
ment does not belong.
• Time-based. As documents of events are up-
loaded in a time-ordered manner to Flickr, it
seems natural to choose n consecutive documents
from the training dataset. For that, we use the first
documents appearing in each split. To create the
negative examples we use the random strategy as
described above.
• Nearest. Here, we also choose n consecutive doc-
uments from the training dataset as we did in the
time-based strategy. However, in this case, the
negative examples are chosen using the nearest
event class where the document does not belong
to:
neg(d
+
i
) = max
d
−
i
6∈ext(e(d
+
i
)
3
∑
i=1
sim
i
(d
−
i
,e(d
+
i
))
3 EXPERIMENTS
In this section we describe our dataset which has been
derived from Flickr. Furthermore, we present our ex-
perimental settings and finally we describe the results
for the experiments.
3.1 Experimental Settings
3.1.1 Dataset
For our experiments we use a dataset derived
from Flickr. We consider only pictures assigned
to a specific event via a so-called machine tag.
Machine tags represent unique event IDs – such
as “lastfm:event=679065” originating from last.fm.
Each event on last.fm has an unique ID assigned
which can thus be used by users when uploaded a
picture on Flickr to mark it as belonging to a certain
event. This assignment of pictures to events via ma-
chine tags can be used to construct a gold standard by
assuming that all pictures with the same machine tag
belong to the same event.
We downloaded a large number of Flickr pictures
with machine tags that have a lastfm:event as pre-
fix using the Flickr API. In particular, we are inter-
ested in the assigned metadata like the capture time,
geographic information, user-defined tags and many
more. Previous work showed that certain metadata is
more useful than other for clustering (Reuter et al.,
2011). Therefore, we concentrate on temporal and
spatial features as well as tags and titles. The titles are
tokenized and the resulting tokens are added to the set
of tags. All tags consisting of only a single character
are removed in order to reduce noise. Furthermore,
we remove all pictures whose timestamp is not plausi-
ble at the moment of download (taken before January
2006 or after April 2011). As we desire only pictures
to be in the dataset which are feature-complete, i.e.
have time and geographic information as well as tags
assigned to it, we filter out all pictures which did not
contain these features. The final dataset consists of
300,000 documents spread over 11,730 unique event
clusters. An event cluster thus contains 25.6 pictures
on average.
All machine tags were removed from the data and
we use them only to create the gold standard.
3.1.2 Data Splits
The documents in the dataset are ordered by their cap-
ture time. We divide the dataset into three equal parts
which we use for cross validation. This allows us to
train on one split and to test this model on the two
other splits.
3.1.3 Creation of Training Examples
For the creation of our training examples, we con-
sider each data split individually. We choose m posi-
tive and m negative examples from each split accord-
ing to the three sampling strategies presented in sec-
tion 2.4. For m we consider the following values:
m ∈ 100,200, 300,400, 500,1000, 2000,4000, 8000,
16000,32000,100000. In order to be able to compare
the results between the standard SVM and the ranking
one, we use the same training examples for both.
For the standard SVM we use the class labels 1
for positive and −1 for negative examples. For the
LEARNING SIMILARITY FUNCTIONS FOR EVENT IDENTIFICATION USING SUPPORT VECTOR MACHINES
211

ranking SVM we have to group positive and nega-
tive examples into a ranked group where the correct
document-centroid pair (d
i
,e(d
i
)) gets a higher rank
(label 2) than the pair (d
i
,e
0
) where the same doc-
ument is compared to a centroid of an event cluster
where it does not belong to (label 1).
3.1.4 Leave-One-Out
To conduct our experiments we use a leave-one-out
strategy. In particular, we choose k event clusters
from our test set and take one document out. The cen-
troids of the event clusters are thus recomputed as if
the document taken out was never part of it. We do
this for each data split individually.
Actually, we select 1000 event clusters from each
data split and choose a random document from each
cluster to be taken out. We end up with 1000 docu-
ments and 1000 clusters. In our experiments we thus
compare every document to every event cluster cen-
troid. As we know the correct assignment for each
document, we are able to measure the correct assign-
ment rate for each method. The accuracy is averaged
over all 6 train-test split pairs.
3.1.5 SVM Training
In our experiments we rely on a ranking SVM and a
standard SVM. As ranking SVM we use SVM
rank
, the
implementation from T. Joachims (Joachims, 2002).
For the standard SVM we make use of libsvm (Chang
and Lin, 2001). We feed both SVMs with the same
training data for equal scenarios (both SVMs get the
same correct and negative examples). For both SVMs
we use their standard settings. The trade-off between
training error and margin (C) is set to 1.0 for both
SVMs.
We use two kernels for our experiments:
Φ(d, e) = hd,ei (linear kernel)
Φ(d, e) = exp
−γ · ||d − e||
2
,γ =
1
3
(RBF kernel)
In order to yield an actual similarity measure, the
output of the SVMs needs to be normalized into the
interval [0..1]. We rely on the probability estimates
provided by libSVM for this purpose.
3.2 Results
In this section we present our results. Table 1 and
Table 2 show the average accuracy for both types of
Support Vector Machines using the different sampling
strategies and a different number of training exam-
ples.
Table 1: Average assignment rate using RankSVM with lin-
ear kernel.
Training
examples
Time-based Random Nearest
200 98,4% 66,9% 98,3%
400 98,4% 42,7% 98,3%
600 98,5% 75,6% 98,3%
800 98,5% 62,5% 98,3%
1000 98,5% 43,2% 98,3%
2000 98,5% 8,7% 98,3%
4000 98,5% 43,6% 98,3%
8000 98,5% 67,9% 98,3%
16000 98,5% 58,9% 98,2%
32000 98,6% 81,6% 98,2%
64000 98,6% 90,3% 98,3%
200000 98,9% 98,9% 98,3%
Table 2: Average assignment rate using a standard SVM
with linear kernel (libSVM with probability estimates).
Training
examples
Time-based Random Nearest
200 98,1% 66,1% 98,0%
400 97,4% 58,7% 97,9%
600 98,1% 68,0% 98,0%
800 98,2% 37,1% 97,7%
1000 98,0% 36,6% 97,7%
2000 92,8% 66,1% 98,2%
4000 87,0% 43,7% 98,8%
8000 87,7% 67,1% 99,1%
16000 85,9% 51,1% 99,1%
32000 90,5% 94,9% 98,7%
64000 90,2% 92,2% 98,4%
200000 89,4% 87,4% 98,2%
3.2.1 Standard vs Ranking SVM
Overall, one very surprising conclusion of our exper-
iments is the fact that a good similarity function can
already be learned with very few examples. While the
Ranking SVM can already learn a model with close
to 98% accuracy with only two examples (one pos-
itive and one negative), the standard SVM needs at
least 10 positive and 10 negative examples to learn
a model with 98% accuracy. While the performance
of the RankingSVM does not vary depending on the
amount of training data, the standard SVM clearly
suffers from overfitting, shown by the drop of perfor-
mance from around 2000 training examples onwards.
The RankingSVM does not suffer from such a perfor-
mance drop, thus showing a more robust behavior.
KDIR 2011 - International Conference on Knowledge Discovery and Information Retrieval
212
3.2.2 Impact of Sampling
The results license the conclusion that the sampling
strategy is crucial for the creation of a model as the
quality varies a lot.
We see that the random sampling strategy does not
allow to learn a good model. It might be possible that
a model created by a random selection of positive and
negative pairs gives acceptable results but in general
the results are much worse and unstable.
Both of the other methods work very well. We ex-
pected the nearest method to be the most compelling
but this is not true for a ranking SVM. Using a stan-
dard SVM we see clearly that the search for the near-
est wrong pair helps to create a better model. Using
the time-based sampling strategy we can see this ef-
fect, too. As the maximal distance between two data
points is low for smaller examples, the choice of a
random negative pair is comparable to the choice of
the nearest.
3.2.3 Choice of SVM Kernel
Both SVMs always achieve better results if a linear
kernel is used. This leads to the assumption that a lin-
ear kernel suits better to the problem. In the follow-
ing, we will thus report results using a linear kernel
only.
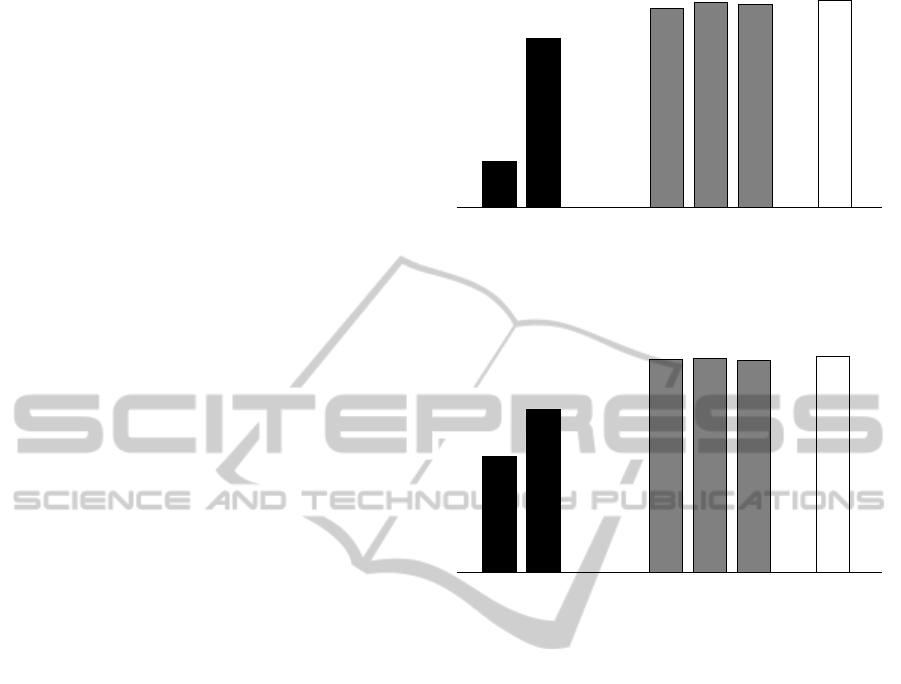
3.2.4 Feature Analysis
In Figure 1 and Figure 2 we compare the accu-
racy rates of the different features and all pos-
sible combinations. To obtain these figures,
we averaged over all accuracy rates for m ∈
500,1000,2000,4000,8000, 16000 as well as the
time-based and nearest sampling strategy.
We discovered that the use of only one single fea-
ture is not enough to ensure good predictions. It is
surprising that it is not possible to use textual features,
tags in our case, to determine a correct cluster assign-
ment at all. As there are a lot of events at the same
time or at the same location, it seems to be natural
that these features are not sufficient if they are used
alone. Nevertheless, the accuracy rate when using ge-
ographic information only is high which leads us to
the hypothesis that the uniqueness of locations in our
dataset is high.
It is interesting that all combinations of two fea-
tures out of the three are enough to produce reason-
able results. This is independent from their actual re-
sults as a single feature, e.g. even if the features time
and tags used with a standard SVM do not produce
any acceptable result, the combination of both reaches
a very high result. This leads us to the assumption that
Time
Geo
Tags
Time+Geo
Geo+Tags
Time+Tags
All
20.9%
1.0%
75.3%
90.6%
93.7%
93.2%
94.2%
Figure 1: Average accuracy rate for different features and
feature combinations using a standard SVM.
53.0%
0.0%
74.2%
96.8%
97.1%
96.5%
98.4%
Time
Geo
Tags
Time+Geo
Geo+Tags
Time+Tags
All
Figure 2: Average accuracy rate for different features and
feature combinations using SVM
rank
.
the availability of all features for a single document is
not compulsory and the lack of features can be com-
pensated.
4 RELATED WORK
In this paper, we compared different methods to learn
similarity functions for event identification. The most
directly related work is Becker et al. who also learn a
similarity function using supervised machine learning
techniques (Becker et al., 2010). In their paper they
use a standard SVM which they did not compare to
other types of SVMs such as ranking SVMs. Becker
et al. neither have systematically investigated the im-
pact of different strategies for creating training data
nor have carried out a systematic feature analysis. In
this sense our work closes a gap by providing advice
on how to learn an optimal similarity function for a
similar task.
The task of learning a similarity function from
training data is typically also addressed in the context
LEARNING SIMILARITY FUNCTIONS FOR EVENT IDENTIFICATION USING SUPPORT VECTOR MACHINES
213

of supervised clustering, where some approaches op-
timize or learn the clustering similarity function from
the training data. Eick et al. use a process of inter-
leaving clustering with distance function in order to
learn a distance function (Eick et al., 2005). Demirez
et al. (1999) use genetic algorithms and an appropri-
ate fitness function to guide the search for an opti-
mal clustering. Rendle et al. (2006) have also pro-
posed supervised techniques that use labelled data in
the form of Must-Link and Cannot-Link constraints to
guide the search for a clustering, have also applied in
the field of Record Linkage. Basu et al. use labelled
data to create Must-Link and Cannot-Link constraints
in their semi-supervised clustering approach in order
to cluster unlabeled data (Basu et al., 2003).
The Learning of a similarity function between
documents is directly related to the task of learning a
ranking function in the area of Information Retrieval.
In our paper we propose to use a method similar to
traditional information retrieval where the system re-
trieves and ranks a document according to the simi-
larity between the queried document and the entries
in the document collection. Joachims proposes Rank-
ingSVMs to learn a linear ranking model that can be
exploited to rank documents in information retrieval
scenarios (Joachims, 2002). In his scenario, the tar-
gets are not class labels but a binary ordering rela-
tion. Others like Fakeri-Tabrizi et al. use a Ranking
SVM for an imbalanced classification problem with
image annotation and show that this type of SVM
performs better than a standard SVM (Fakeri-Tabrizi
et al., 2011). Freund et al. propose an efficient boost-
ing algorithm to combine linear rankings by experts
(Freund et al., 2003). These experts correspond to
the similarity functions we use as features in our ap-
proach. Our results indeed show that a ranking SVM
can be successfully applied for the task of finding and
learning a similarity function for the event identifica-
tion problem. It is showing a more stable behavior
than a standard SVM and is also able to learn the sim-
ilarity function with less training examples. Gao et al.
have developed a similar approach but using a percep-
tron to learn the ranking function instead of a SVM
(Gao et al., 2005).
In the area of event identification, there have been
several attempts to decide whether a document is as-
sociated with an event or not. The task of grouping
documents into clusters describing the same event has
been dubbed event identification (Becker et al., 2010).
Others learn to distinguish Flickr documents repre-
senting an event from those that do not (Rattenbury
and Naaman, 2009). Allan and Papka used an incre-
mental clustering approach for detecting events in text
document streams (Allan et al., 1998). Becker et al.
use a similar method to identify event clusters (Becker
et al., 2010).
Firan et al. provide a formulation of the event
identification problem as a standard classification
task, thus learning a function class : D → E (Firan
et al., 2010). They used a Naive Bayes classifier to do
this. This is problematic in our view. It does not ac-
count for the dynamic nature of data in the sense that
it does not model the fact that new events constantly
emerge. In order to accommodate this, a new classi-
fier has to be trained for each new event that is added
to the system. There is no mechanism for detecting
new events. Our results have shown that there are on
average only 26 data points on each event. Given this
sparsity of data, it is not clear if it is possible to learn
appropriate classifiers for each of them.
5 CONCLUSIONS
In this paper we addressed the question of how we
can learn a suitable similarity function from training
data for the task of identifying events in social media
data. We made use of different types of SVMs (Rank-
ing and Standard SVMs) in order to train an appro-
priate similarity measure. We investigated different
strategies for creating training data, the impact of the
amount of training data and the kernel used. We have
shown that it is possible to learn a suitable similarity
measure using both SVMs. It is sufficient to use only
few examples to train a model. Using a ranking SVM,
one positive and one negative pair allows the creation
of a suitable similarity measure. Furthermore, the per-
formance of a ranking SVM does not vary signifi-
cantly for different sizes of training data and is thus
more robust than a standard SVM. Besides, we fig-
ured out that a linear kernel always outperforms an
RBF one regardless of which type of SVM we use.
We have clearly shown that the sampling strat-
egy is crucial for the success of the training process.
The use of well-chosen training examples improve the
quality significantly. We have seen that the search for
the nearest wrong pair helps to create a good model.
The fact that the time-based sampling strategy is com-
parable to the nearest one for small amounts of data
explains the good results of the SVM in the approach
of Becker et al. They used a time-based strategy with
500 training examples (Becker et al., 2010). In gen-
eral there is only few data needed to be able to create
a working model. If too much training data is used, at
least the standard SVM suffers from overfitting.
Furthermore, we have discovered in our feature
analysis that the lack of a single feature has no great
impact on the quality of the system. The results are
KDIR 2011 - International Conference on Knowledge Discovery and Information Retrieval
214

still compelling with the use of only two features. A
lot of pictures in social media are missing some of the
features but our method is still applicable as we know
from our downloaded data that about 99.8% of all
documents have at least two features assigned. Thus,
the methods we proposed in this papers are applica-
ble in a real-world scenario. In addition there is other
data like author and a description available which also
might be useful as a feature.
ACKNOWLEDGEMENTS
The research is funded by the Deutsche Forschungs-
gemeinschaft (DFG), Excellence Cluster 277 “Cogni-
tive Interaction Technology”.
REFERENCES
Allan, J., Papka, R., and Lavrenko, V. (1998). On-line new
event detection and tracking. In Proceedings of the
21st annual international ACM SIGIR conference on
Research and development in information retrieval,
pages 37–45. ACM.
Basu, S., Bilenko, M., and Mooney, R. (2003). Comparing
and unifying search-based and similarity-based ap-
proaches to semi-supervised clustering. In Proceed-
ings of the ICML-2003 Workshop on the Continuum
from Labeled to Unlabeled Data in Machine Learning
and Data Mining, pages 42–49. Citeseer.
Becker, H., Naaman, M., and Gravano, L. (2010). Learn-
ing similarity metrics for event identification in social
media. In Proceedings of the third ACM International
Conference on Web search and Data Mining, pages
291–300.
Chang, C. and Lin, C. (2001). LIBSVM: a library for sup-
port vector machines.
Cortes, C. and Vapnik, V. (1995). Support-vector networks.
Machine learning, 20(3):273–297.
Demiriz, A., Bennett, K., and Embrechts, M. (1999). Semi-
supervised clustering using genetic algorithms. Ar-
tificial neural networks in engineering (ANNIE-99),
pages 809–814.
Eick, C., Rouhana, A., Bagherjeiran, A., and Vilalta, R.
(2005). Using clustering to learn distance functions
for supervised similarity assessment. Machine Learn-
ing and Data Mining in Pattern Recognition, pages
120–131.
Fakeri-Tabrizi, A., Tollari, S., Usunier, N., and Gallinari, P.
(2011). Improving image annotation in imbalanced
classification problems with ranking SVM. Multi-
lingual Information Access Evaluation II. Multimedia
Experiments, pages 291–294.
Finley, T. and Joachims, T. (2005). Supervised clustering
with support vector machines. In Proceedings of the
22nd international conference on Machine learning,
pages 217–224. ACM.
Firan, C., Georgescu, M., Nejdl, W., and Paiu, R. (2010).
Bringing order to your photos: event-driven classi-
fication of flickr images based on social knowledge.
In Proceedings of the 19th ACM international con-
ference on Information and knowledge management,
pages 189–198. ACM.
Freund, Y., Iyer, R., Schapire, R., and Singer, Y. (2003).
An efficient boosting algorithm for combining prefer-
ences. The Journal of Machine Learning Research,
4:933–969.
Gao, J., Qi, H., Xia, X., and Nie, J. (2005). Linear discrim-
inant model for information retrieval. In Proceedings
of the 28th annual international ACM SIGIR confer-
ence on Research and development in information re-
trieval, pages 290–297. ACM.
Joachims, T. (2002). Optimizing search engines using click-
through data. In Proceedings of the eighth ACM
SIGKDD international conference on Knowledge dis-
covery and data mining, pages 133–142. ACM.
Rattenbury, T. and Naaman, M. (2009). Methods for ex-
tracting place semantics from Flickr tags. ACM Trans-
actions on the Web (TWEB), 3(1):1.
Rendle, S. and Schmidt-Thieme, L. (2006). Object identifi-
cation with constraints.
Reuter, T., Cimiano, P., Drumond, L., Buza, K., and
Schmidt-Thieme, L. (2011). Scalable event-based
clustering of social media via record linkage tech-
niques. In Proceedings of the Fifth International AAAI
Conference on Weblogs and Social Media.
LEARNING SIMILARITY FUNCTIONS FOR EVENT IDENTIFICATION USING SUPPORT VECTOR MACHINES
215
