
SPATIAL-BASED FUZZY CLASSIFICATION OF LAND
SUITABILITY INDEX FOR AGRICULTURE DEVELOPMENT
A Model Validation Perspective
Sumbangan Baja, Andi Ramlan
Department of Soil Science, Hasanuddin University, Makassar, Indonesia
Muhammad Ramli
Stalitan Maros, Ministry of Agriculture, Jakarta, Republic of Indonesia
Keywords: Fuzzy set, Land suitability index, Spatial modeling, Corn development.
Abstract: The primary aim of this research is to develop and test fuzzy modeling procedures to assess spatial
distribution of actual corn yields in the field in relation to land characteristics. This experiment implements
a fuzzy set methodology to generate a land suitability index (LSI) for corn development. It also uses a direct
yield record method in the fields, and utilizes geographic information systems (GIS) in spatial analysis, in
synchrony with global positioning system (GPS). This study produced a set of spatial information on LSI on
a cell-by-cell basis in the study area. A simple regression method was also employed to calculate spatial
correlation between two sets of information (i.e., corn yield in kg/ha and fuzzy set-based LSI). Although the
correlation coefficient (R
2
) is relatively low, the scatter points have shown a good indication that the higher
the LSI the better yield can be produced in the area under consideration. Spatial interpolation was then
undertaken to map predicted corn yields on a regional basis. Spatial segmentation of land area in form of a
fuzzy-based land suitability index map can assist land managers or decision makers in allocating future corn
cultivation area in the study region.
1 INTRODUCTION
Basically, there are at least three main reasons for
using fuzzy set methodology rather than a Boolean
technique in land suitability evaluation. First, in the
Boolean classification technique an ordinary set
defines an exact boundary, while a fuzzy set permits
flexibility in defining the boundary of the object in
the set. Second, only two possibilities exist in the
Boolean technique: an element or suitability level is
either included or excluded in a set, while in the
fuzzy set the degree of closeness to the ideal point is
considered in the inclusion. Finally, unlike the fuzzy
set technique, Boolean logic cannot take account of
partial membership of an element in a set. Therefore,
when using a raster GIS, calculation can be made on
a cell-by-cell basis (Baja et al., 2007; Maeda et al.,
2009), and this provides an opportunity for applying
statistical procedures (Olano et al., 1998).
However, limited number of model-based studies
on land suitability gives a comprehensive validation
exercise that could describe uncertainty (Cook and
Bramley, 2001). It is thus always necessary,
particularly in complex GIS modeling, that the
model built be tested for its validity. Commonly-
used approaches of model validation include testing
for predictive ability and comparison against
performance standards (Harrison, 1991). For land
suitability assessment, the second method may be
more appropriate to use, and land productivity
measures (such as crop yields, costs required for
improving biophysical constraints, etc.) are
employed as a performance standard.
From the perspective of fuzzy set-based
agricultural applications, a cell-by-cell land
suitability grade may be related to the actual
production in the field, while collection of yield
information over space and time has sometimes
outperformed our ability to interpret and apply the
data. There is therefore a need for a spatial based
model for generating information that can depict
stronger linkages between information sets on land
435
Baja S., Ramlan A. and Ramli M..
SPATIAL-BASED FUZZY CLASSIFICATION OF LAND SUITABILITY INDEX FOR AGRICULTURE DEVELOPMENT - A Model Validation Perspective.
DOI: 10.5220/0003653604350440
In Proceedings of the International Conference on Evolutionary Computation Theory and Applications (FCTA-2011), pages 435-440
ISBN: 978-989-8425-83-6
Copyright
c
2011 SCITEPRESS (Science and Technology Publications, Lda.)

characteristics and crop yields on specified farmland
management in a given study region. The primary
aim of this study is to implement available fuzzy
modeling approaches in a spatial context, and to
assess and map the spatial distribution of corn (Zea
mays L.) yields in the field in relation to land
suitability indices. Geographic information Systems
(GIS) technology, was employed in synchrony with
global positioning system (GPS).
2 METODOLOGY
2.1 Study Area
The area selected for this study includes some parts
of the lower Jeneberang River catchment covering
an area of approximately 37.000 ha, located about
30 km Southeast of Makassar City, South Sulawesi,
Indonesia (Figure 1). According to existing land use
map, agriculture is the predominant land use in the
study region consisting of paddy field 16,725 ha
(45%), followed by shrubs 9,335 ha (25%), mixed
farms 5,071 ha (14%), forest 4,087 ha (11%), water
body (Bili-Bili Dam) 1,766 ha (5%), and residential
379 ha (1%). It was found in the study area that in
addition to rice, rainfed paddy field is also cultivated
with corn.
Figure 1: Location of study area.
2.2 Identification of Land under Corn
Cultivation
Identification of land under traditional corn
cultivation in the study area was undertaken during
cultivation period (March to April 2009). As many
of 31 farmers of corn cultivars from different
villages were involved in this study. These farms
were taken from different land units and identified
as having different land characteristics. At the same
time, soil samples with precise GPS records were
taken from different units for laboratory analysis. An
informal agreement was made between our
surveyors with these farmers to harvest the crops
together (in May and June), in order the corn yields
can be further weighted in kg/ha.
2.3 Calculating Land Suitability
Indices
A fuzzy set is most commonly used for
classifications of objects or phenomena in
continuous values, where the classes do not have
sharply defined boundaries. It deals with a class with
a continuum of grades of memberships (Zadeh,
1965). A fuzzy set A may be defined as follows:
A = {x,
A
(x)} x X
(1)
Where X = {x} is a finite set (or space) of objects or
phenomena,
A
(x) is a membership function of X for
subset A.
Therefore, a fuzzy subset is defined by the
membership function (MF) that defines the
membership grades of fuzzy objects or phenomena
in the ordered pairs, consisting of the objects and
their membership grades. The MF of a fuzzy subset
determines the degree of membership of x in A
(Burrough et al., 1992).
Calculation procedure implemented in this study
utilizes an a priori membership function (MF) for
individual variables under consideration, where the
technique is called “a Semantic Import” (SI) model
(Burrough and McDonnel, 1998). Examples can be
seen in Baja et al. (2002a) and Davidson et al.
(1994). With this approach, the attribute values
considered are converted to common membership
grades (from 0 to 1.0), according to the class limits
specified by the analysts based on experience or
conventionally imposed definitions.
If MF(x
i
) represents individual MF values for i
th
land property x, then, the basic SI model function
take the following form in the computation process:
}]/)[(1{
1
)(
2
dbx
xMF
i
i
(2)
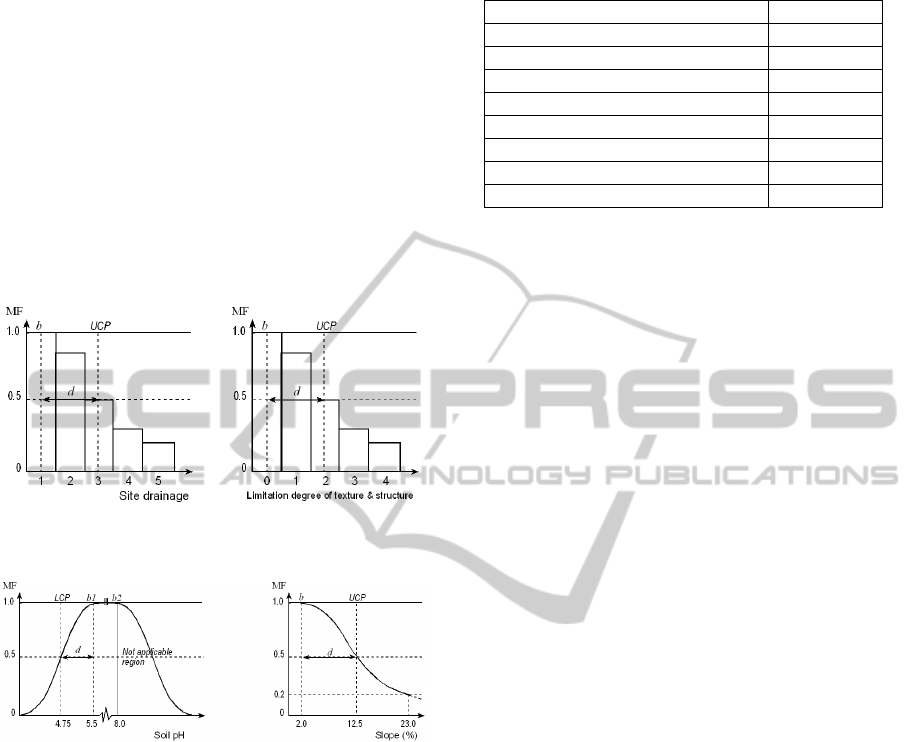
In the computation, it is crucial to examine an
appropriate fuzzy model parameter to suit each
decision criterion. The choice depends on the ‘trend
of performance’ of the respective land attribute in
accommodating a favorable condition for a selected
land use type (Baja et al., 2002b). Model parameters
include LCP (lower crossover point), b (central
concept), UCP (upper crossover point), and d (width
of transition zone).
Land and climate characteristics used for
FCTA 2011 - International Conference on Fuzzy Computation Theory and Applications
436
calculating LSI in this experiment include drainage,
texture, soil depth, cation exchange capacity (CEC),
organic matter (OM), pH, slope, and average annual
rainfall (Appendix 1).
Based on its nature of data representation, land
characteristic information can be divided into
ordinal and cardinal numbers. The former include
site drainage, soil texture and structure, CEC, OM,
while the latter are pH, slope, and rainfall. The
individual MF value is calculated based on Equation
(2). For ordinal value, the technique used following,
for example, Figure 2, while for cardinal number it
implements Figure 3. These apply for the rest of
land characteristics.
Figure 2: Example for calculating MF values for ordinal-
based land characteristics.
Figure 3: Example for calculating MF values for cardinal-
based land characteristics.
As there are n land characteristics to be rated, the
MF values of individual land characteristics under
consideration are then combined using a convex
combination function to produce a join membership
function (JMF) of all attributes, Y as follows:
)()(
1
n
i
ii
xMFYJMF
(3)
where
i
is a weighting factor (see Table 1) for the
i
th
land property x, and MF(x
i
) denotes a membership
grade for the i
th
land property x.
Calculation of LSI was done on a cell-by-cell
basis, in a raster GIS data base. The result of such a
procedure is a map representing spatial distribution
of land suitability index in a continuous grade,
ranging from 0 (not suitable) to 1.0 (very suitable).
Table 1: Weighting factor for land characteristic used.
Land characteristics Weight,
i
Site drainage 0.10
Soil texture and structure* 0.20
Solum depth 0.15
Cation exchange capacity, CEC (topsoil) 0.10
Organic matter, OM (topsoil) 0.05
pH (1:5 soil:water) 0.05
Slope gradient (%) 0.15
Rainfall (mm/annum) 0.15
2.4 Calculation of Corn Yields
Corn was harvested in a randomly determined land
sample of 2.5 by 2.5 sq metres, with 3 replications.
The harvested seeds of corn were then drayed at
approximately 14% water content. The drayed corn
seeds were then weighed and transformed in kg/ha,
using the following formula:
Wc-ha = 1,600 x Wc-spl (4)
Where Wc-ha is a weight of corn seeds in kg per ha,
Wc-spl is weight of corn seeds in each sample of 2.5
by 2.5 sq meters, and a coefficient of 1,600 is taken
from 10.000/(2.5 x 2.5).
2.5 Analysis of Correlation
Analysis of correlation was undertaken between land
suitability, LSI and corn yields in the study area
using a simple regression method. Land
characteristics and LSI were generated from the
results of laboratory test and GIS analyses, while
corn yield data were derived from the average seed
weight (from 3 replications).
2.6 Yield Mapping
Yield mapping was done using GPS and GIS, using
the formula generated from the analysis of
correlation. This map indicates spatial distribution of
corn yield in the study area under land management
currently practiced by farmers.
3 RESULTS AND DISCUSSION
3.1 Land Suitability Indices
Spatial distribution of land suitability index in a
continuous grade is depicted in Figure 4, and that for
grid values (i.e., LSI) in the data space can be seen
in Figure 5. It can be seen that use of fuzzy measures
SPATIAL-BASED FUZZY CLASSIFICATION OF LAND SUITABILITY INDEX FOR AGRICULTURE
DEVELOPMENT - A Model Validation Perspective
437
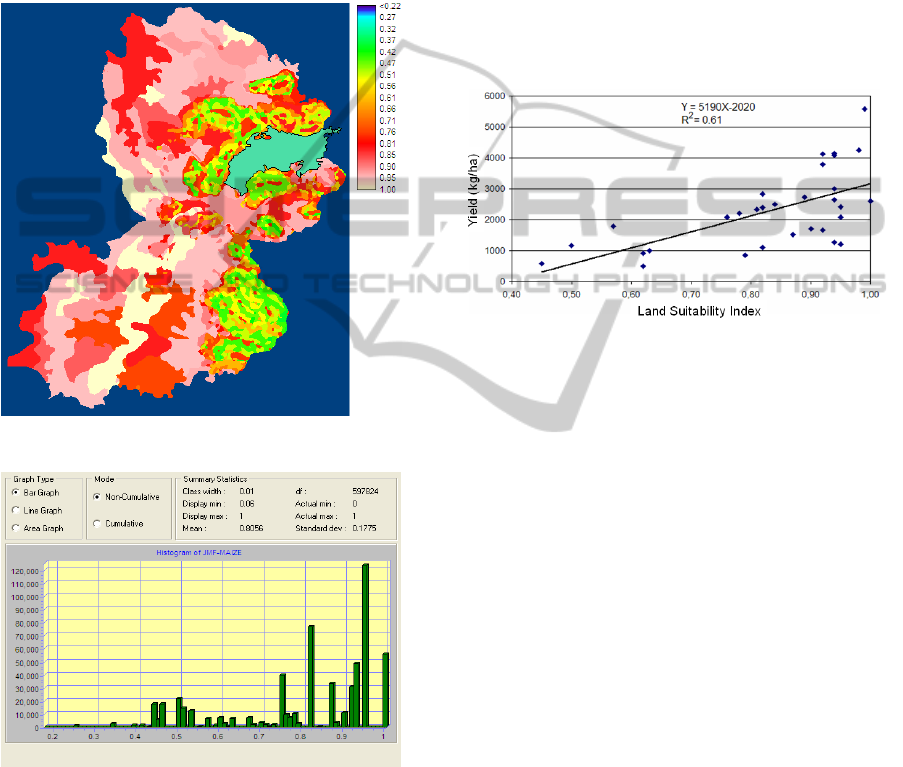
in a raster GIS can produce a detailed index of land
suitability; where in this application the values
ranges from around 0.30 (less suitable) to 1.0 (very
suitable) for corn development. It seems that the
most suitable areas for corn development is found in
the western section of study area. Based on the pixel
values trace from the criteria developed, it was
found that the main limitation for land units in the
east is topography, where slope is more than 15%.
Figure 4: Spatial distribution of LSI in the study area.
Figure 5: Distribution of LSI in the grid data space.
3.2 Spatial Distribution of Crop Yields
The result of field study was presented in form of
corn yields from different map units with clear
indication of ground coordinates and 31 village
names. It was found that yield variation occurs over
the study area, ranging from 500 kg/ha to 5.575
kg/ha. Identification from field study reveals that
agricultural land management were slightly different
from one farm land to another, which may contribute
to slight differences in a crop yield.
3.3 Correlation between LSI and
Yields
Correlation was tested between LSI and corn yields,
and the result can be seen in Figure 6, forming the
following formula:
Y = 5190X - 2020; R
2
= 0.61 (5)
Where Y is corn yield and X is average LSI of
corresponding land units in the study area.
Figure 6: Correlation between LSI and corn yield.
Although the coefficient of correlation (R
2
) is
relatively low, the scatter points have shown a good
indication that the higher the LSI the better yield can
be produced in the area under consideration. It is
recognized that variation occurs due to differences in
land management practices, as the samples were
collected from different farm land with different
owners. Variations in land management practices
may result in a significant difference in yields
although the land parcels under consideration have
similar biophysical characteristics.
It is argued that attempts to correlate land
potential (expressed in form of land suitability
indices) with crop yields only, may not always result
in a good representation of the land performance.
The main reason is that data on crop yields are not
readily available, particularly in undeveloped
regions; or on the other hand, most available
agricultural production data are not well geo-
referenced. However, this experiment has
successfully designed a methodological framework
where crop yields were collected from 31 farm lands
(involving 31 land owners) during March to June
cultivation period.
Furthermore, assuming that the data sets are
accompanied by spatial geo-references, details of
land management such as fertilizers, irrigation,
weeding, date of planting, etc. should also be taken
FCTA 2011 - International Conference on Fuzzy Computation Theory and Applications
438
into account. In this experiment, such phenomenon
has suppressed correlation coefficient. Differences
in land management may lead to yield differences
between farms especially between the best and the
worst management practices.
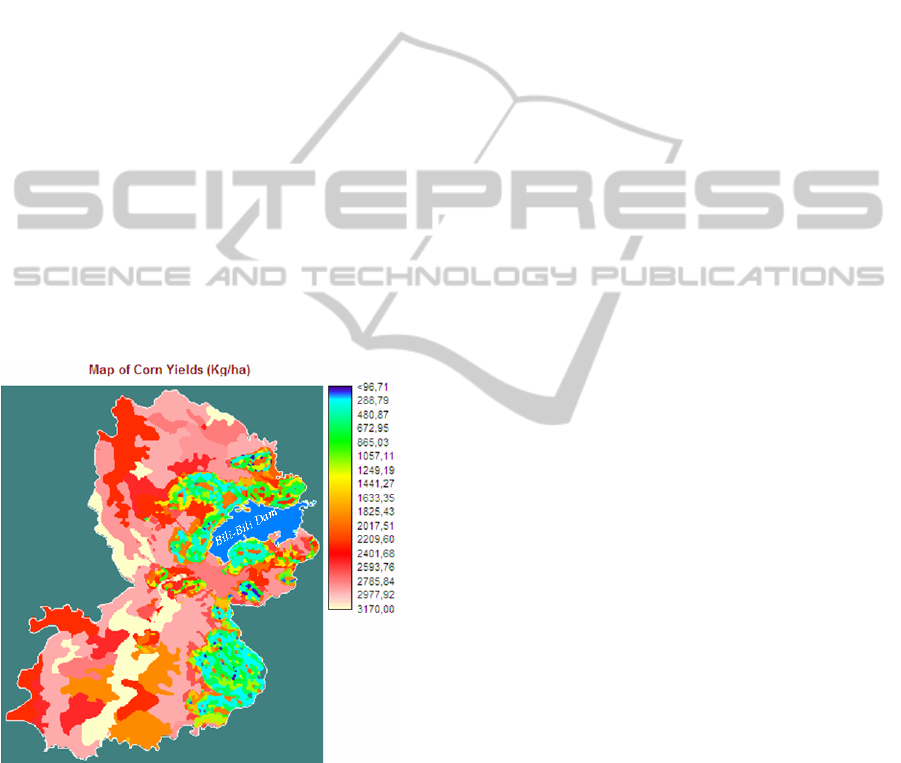
3.4 Yield Mapping
Using the formula in equation (5), potential yield
(kg/ha) of corn (Zea mays L.) in the study area is
then extrapolated and mapped in Geographic
Information Systems (GIS) (Figure 7). This map
depicts spatial distribution of corn yields (kg/ha)
across the study area under crop management
currently practiced in this region. The map shows
that land with relatively high crop yields is found
around the flood plains, where most paddy field
exists. Land parcels with low yields are mostly
located in the higher altitude eastern sections of the
study area. The map shows that with existing crop
management, the maximum possible production of
corn in the region is 3170 kg/ha, with the averaged
figure of about 2500 kg/ha. This is somewhat above
the averaged corn production in South Sulawesi
Province, which is of 2200 kg/ha.
Figure 7: Map of potential yield (kg/ha) of corn (Zea mays
L.) in the study area.
In terms of future crop management to improve
corn yield in the study area, spatial segmentation as
seen in Figure 7 can assist the land managers or
decision makers in the allocation of different types
of land and crop management. The areas having a
high potential yield (as in the western sections of the
study area) needs only a low input management to
achieve optimal yields, while land parcels with
relatively low potential yield (as in the eastern
sections) will need medium to high input. The map
is also useful for designing a spatial planning
program in a regional level for optimal decision
making in land use and land management.
4 CONCLUSIONS
Based on the study on using fuzzy set methodology
and intensive field work, it can be concluded that:
Use of fuzzy set modeling approaches has
resulted in a cell-by-cell land potential map for
developing corn in the study region.
An indication of correlation exists between land
quality (in form of LSI) and corn yield in the field,
and variation in the scatter diagram gives insights
into differences in existing land and crop
management in the study area.
This experiment has shown potential use of
fuzzy modeling procedures combined with a
regression model to map the potential yield at a
regional level, and this can assist in setting up
regional-based agricultural programs especially corn
development.
It becomes obvious that the results of analyses
here not only show how the relationships between
two sets of data can be examined in a continuous
(fuzzy) manner, but also illustrate the significance of
using fuzzy set approaches for micro-mapping, and
fine discriminations of land quality and potential
yield in a large scale corn-based program.
ACKNOWLEDGEMENTS
Financial support provided by The Ministry of Riset
and Technology, and The Directorate of Higher
Education, Republic of Indonesia is highly
appreciated.
REFERENCES
Baja, S., Chapman, D. M., and Dragovich, D., 2002a. A
conceptual model for defining and assessing land
management units using a fuzzy modelling approach
in GIS environment. Environmental Management, Vol.
29: 647-661.
Baja, S., Chapman, D. M. and Dragovich, D., 2002b.
Using GIS-based continuous methods for assessing
agricultural land use potential in sloping areas.
SPATIAL-BASED FUZZY CLASSIFICATION OF LAND SUITABILITY INDEX FOR AGRICULTURE
DEVELOPMENT - A Model Validation Perspective
439

Environment and Planning B: Planning and Design,
Vol. 29: 3-20.
Baja, S, Dragovich, D. and Chapman, D., 2007. Spatial
Based Compromise Programming for Multiple Criteria
Decision Making Modeling in Land Use Planning.
Environmental Modelling and Assessment Vol. 12:
171-184.
Burrough, P. A, and McDonnell, R. A., 1998. Principles
of Geographical Information Systems. Oxford
University Press Inc., New York.
Burrough, P. A., MacMillan, R. A. and van Deursen, W.,
1992. Fuzzy classification methods for determining land
suitability from soil profile observations and topography.
Journal of Soil Science, 43: 193-210.
Cook, S. E., and Bramley, R. G. V., 2001. Is agronomy
being left behind by precision agriculture? In
Proceedings of the 10th Australian Agronomy
Conference, Hobart, 28 January -1 February. (ASA:
Hobart).
Davidson, D. A., Theocharopoulos, S. P. and Bloksma, R.
J., 1994. A land evaluation project in Greece using
GIS and based on Boolean and fuzzy set
methodologies. International Journal of Geographic
Information Systems, 8: 369-384.
Harrison, S. R., 1991. Validation of agricultural expert
system. Agricultural Systems, Vol. 35: 265-285.
Maeda, S., Kawachi, T., Unami, K., Takeuchi, J., Izumi,
T., and Chono, S., 2009. Fuzzy optimization model for
integrated of total nitrogen loads from distributed and
nonpoint sources in watershed. Paddy Water Environ
Vol. 7:163–175.
Olano, J. M., Loidi, J. J., Alez, A. G., and Escudero, A.,
1998. Improving the interpretation of fuzzy partitions
in vegetation science with constrained ordinations.
Plant Ecology Vol. 134: 113–118.
Zadeh, L. A., 1965. Fuzzy sets. Information and Control,
8: 338-353.
APPENDIX
Appendix 1: Evaluation criteria of land suitability for corn.
Land characteristics
Limitation degree**
0 1 2 3 4
Site drainage well moderate imperfect
Poor & very
poor
-
Soil texture and structure*
Z, ZL, ZCL, ZCs, SCs,
CSs, Cs, CLs, Ls
SCL, SCm, ZCm, Cm,
HCs, CLm, CSm, Lm
HCm, SL, SCLm,
LS
S Sm
Solum depth very deep deep moderate shallow very shallow
Cation exchange capacity, CEC
(topsoil)
high – very high moderate low – very low -
Organic matter, OM (topsoil) very high high moderate
low – very
low
-
pH (1:5 soil:water) 5.5 - 8.0
5.1 - 5.5 and
8.1 - 8.5
4.5 - 5.0 and
8.6 - 9.0
< 4.5 and
9.1 - 9.5
-
Slope gradient (%) < 2 2 - 8 8 - 16 16 - 25 > 25
Rainfall (mm/annum) 500 – 1200
1200 – 1600
400 – 500
>1600
300 – 400
< 300 -
Note: *Texture: C = Clay, CL= Clay loam, CS = Clayey sand, HC = Heavy clay, L = Loam, LS = Loamy sand, S = Sand, SC = Sandy
clay, SCL = Sandy clay loam, SL = Sandy loam, Z = Silt, ZC = Silty clay, ZCL = Silty clay loam, ZL = Silt loam; Structure: s =
Structured, m = Massive (or apedal).
**Limitation degree: 0=None, 1=Slight, 2=Moderate, 3=Severe, 4=Very severe
FCTA 2011 - International Conference on Fuzzy Computation Theory and Applications
440
