
COULD TYRANNOSAURUS RUN FAST?
Mechanical Power Calculation for 15.7 m/s Tyrannosaurus Running
Yoshiyuki Usami
Institute of Physics, Kanagawa University, Rokkakubashi 3-25-1, Kanagawa-ku, Japan
Keywords: Tyrannosaurus, Locomotion, Theropod, Biomechanics, Mechanical power.
Abstract: Running ability of large bepidal theropod Tyrannosaurus is studied with the use of evolutionary
computational method. In 2002 Hutchinson and Garcia published a paper titled as "Tyrannosaurus was not a
fast runner" (Hutchinson and Garcia, 2002). They postulated an arbitrary mid-stance posture in running
motion, and calculated required muscle mass of the hind limb. This method can not tell information on
running speed, because it is a static method. Then, running speed of Tyrannosaurus could not be evaluated
quantitatively. We accomplished numerical simulation to obtain whole running motion of Tyrannosaurus
with the use of evolutionary computation method. As a result, we have obtained running motion of
Tyrannosaurus in a speed of 15.7 m/s within allowed parameters range. We have discussed on mechanical
power output of the running motion of Tyrannosaurus for the first time in this research area. As for a
problem of the simulation algorithm, there is room to improve simple evolutionary computation method
applied in the present work. Generally, a solution of evolutionary computation method falls into a local
minimum. However, finding the global minimum of the evaluation function i.e., velocity and vertical
acceleration are needed for this problem. Then, developing such an algorithm is left as the future problem.
1 INTRODUCTION
A problem of running ability of dinosaurs has not
been solved for many years. Both of the numbers of
theoretical researchers, and evidence of foot print
that show running motion have been quite limited.
Early estimation on running speed of Tyrannosaurs
was accomplished by Bakker and Paul in 1986 and
1988, respectively, based on morphological
consideration of muscle and limb structure (Bakker,
1986; Paul, 1988). Bakker and Paul proposed 45
mph and 40 mph running, respectively, which
correspond to the speed of 20 m/s and 17.9 (
≅
18)
m/s. These estimates are almost two times faster
than one of the humans at best. A monumental
qualitative study was achieved by Alexander with
the use of Froude number
hg
v
Fr
⋅
=
2
, where v, h,
and g are velocity, characteristic length of leg and
gravitational constant, respectively. He employed
dynamic similarity hypothesis such that animal walk
or run in a dynamically similar fashion at the same
Froude number (Alexander 1976, 1985, 1989, 1996,
2006; Alexander and Jayes1983). With comparing
extant animal data, he found that relative stride L
st
/h
has a relation with Froude number as,
3.0
2
)(3.2
hg
v
h
L
st
⋅
=
(1)
where L
st,
h, v and g are the stride length which is a
distance between two successive falls of the same
foot, and hip height, velocity, and gravitational
constant, respectively (Alexander 1976). Alexander
proposed that the hip height h can be estimated from
foot print of dinosaurs as h=4FL, where FL is foot
length. Since then, many improvements have been
added to this expression. (Gatesy and Biewener
1991; Russell and Beland 1976; Thulborn 1981,
1989, 1990; Rainforth and Manzella 2007; Wallace
and Brooks, 2003). Recently, Rainforth and
Manzella re-analyzed this factor using 24 specimens
from different dinosaurian groups, and concluded
that speed estimation could be incorrect by a factor
of two (Rainforth and Manzella, 2007).
From fossilized foot print remains two evidence
of large dinosaurs running motion have been
reported. Farlow and Day et al. reported that 11.1
m/s and 8.11 m/s running evidence of medium and
large size bipedal theropod is obtained, which are
13
Usami Y..
COULD TYRANNOSAURUS RUN FAST? - Mechanical Power Calculation for 15.7 m/s Tyrannosaurus Running.
DOI: 10.5220/0003652100130022
In Proceedings of the International Conference on Evolutionary Computation Theory and Applications (ECTA-2011), pages 13-22
ISBN: 978-989-8425-83-6
Copyright
c
2011 SCITEPRESS (Science and Technology Publications, Lda.)

calculated using Eq.(1) (Farlow, 1981; Day et al.
2002). Although the absolute value of running speed
has to be re-considered with care, foot prints show
that bipedal theropod was a fast runner with
comparable to human.
In 2002 Hutchinson and Garcia published a
paper titled as "Tyrannosaurus was not a fast
runner" (Hutchinson and Garcia, 2002). They
accomplished static calculation in which required
muscle mass is calculated for an arbitrary chosen
mid-stance posture in running motion. The result
yields that 43 % muscle mass is required for one
hind limb of Tyrannosaurus. On the other hand,
computer aided mass property study revealed that
the value is 16.0 % for MOR555 (Bates et al. 2009),
14.2 % for MOR 555 (Hutchinson et al. 2007), 14.4
% for BHI3033 (Bates et al. 2009). The abbreviation
stands for Museum of Rockies, and Black Hills
Institute, respectively. Then, Hutchinson concluded
that Tyrannosaurus was not a fast runner.
In 2004 Hutchinson re-evaluated this value, and
obtained a result that 21 % muscle mass is required
for one hind limb of Tyrannosaurus (Hutchinson
2004b). Recently, Gatesy et al. calculated the value
for various mid-stance postures (Gatesy et al. 2009).
The methodology is the same with Hutchinson and
Garcia's, then, the speed estimation is heuristic. The
results are considered as medium speed running is
possible, because 18.3 (~1.87× 9.8) m/s
2
vertical
acceleration is allowed in their estimation for static
postures.
In our recent studies, re-consideration of
involved parameters leads to almost two folds error
in the estimation of required muscle mass (Usami,
2011a-c). Figure 1 displays 3D bone structure of
BHI3033 specimen taken by us using 3D laser
scanner FARO LS. Recently, Sellers and Manning
accomplished numerical simulation study for this
problem. They obtained that about 8~9 m/s running
is possible for Tyrannosaurus (Sellers and Manning,
2007).
Figure 1: 3D bone structure of BHI3033 specimen taken
by using FARO co. LS.
Instead of this methodology, this paper presents a
result of calculation of mechanical power in running
motion of Tyrannosaurus. This metho-dology
excludes uncertainty of many biomechanical
parameters. Then, this evaluation is superior to the
static evaluation in evaluating running speed of
Tyrannosaurus.
2 DYNAMICAL CALCULATION
OF THE LOCOMOTION OF
TYRANNOSAURUS
This section describes the method of numerical
simulation of Tyrannosaurus running motion.
2.1 A Solid Object Approximation and
Calculation of the Moment of the
Force
Running motion is a periodic one, hence, expressing
time change of each joint angle by Fourier
expansion series is appropriate. Validity of this
method was checked in advance on human
locomotion. The motion capture of human running
motion was accomplished by the combination of
optical measurements and the use of force plate on
the ground. These data were analyzed by the reliable
system VICON (Vicon Motion Systems). Next, time
change of each joint angle is expressed by Fourier
expansion series. Convergence within 1 % accuracy
is checked by taking into account of 5
th
order Fourier
expansion. Thus, an expression of 5
th
order Fourier
expansion is a good method to describe the periodic
motion of each joint. For i-th joint angle
)(t
i
θ
the
expansion is expressed as follows,
"++++= )sin()0sin()(
1100
iiiii
tatat
δωδθ
(2)
where
j
i
a ,
j
i
δ
are the amplitude and the phase of j-
th order of expansion series for i-th angle,
respectively. The
ω
is angular velocity. The
segment structure of Tyrannosaurus is the same of
Hutchinson and Garcia’s model shown in Fig. 2(a)
(Hutchinson and Garcia, 2002). To study time-
dependent dynamics a solid object model is used to
describe the motion of Tyrannosaurus limb.
Namely, the model Tyrannosaurus moves as one
solid object for the external force
)(rF
G
G
as the
following equations,
)(
2
2
rFgm
dt
Xd
m
y
bodybody
G
G
G
+−=
(3a)
)(
2
2
rFr
dt
Φd
I
G
G
G
⋅=
(3b)
ECTA 2011 - International Conference on Evolutionary Computation Theory and Applications
14
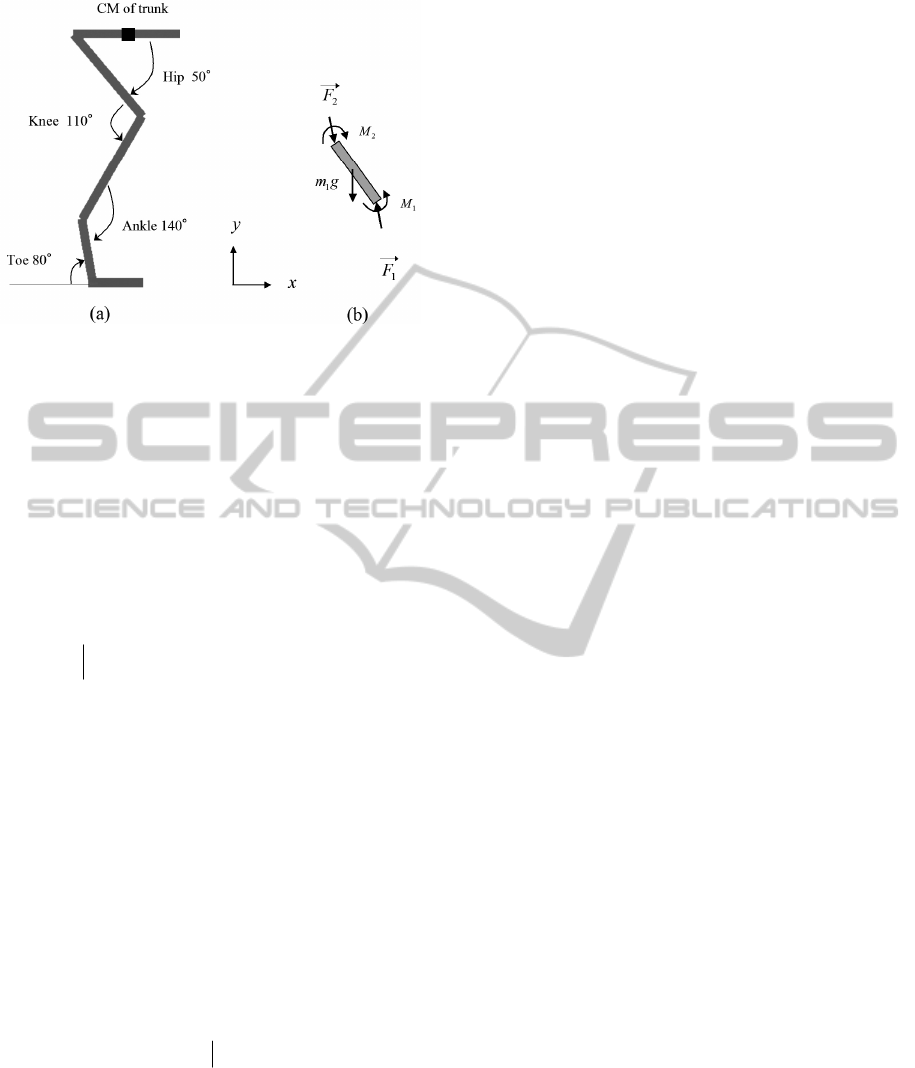
Figure 2: (a) Segment model of Tyrannosaurus of
Hutchinson and Garcia (Hutchinson and Garcia, 2002). (b)
A free-body diagram. Using (b) the torque at a joint can be
calculated from foot segment, sequentially.
where
X
G
and
Φ
are the position vector of the
center of mass and the rotational angle of the object,
respectively. The calculation is achieved in the
sagittal plane, i.e., two-dimensional space x
(horizontal) and y (vertical). I, g and
r
G
are the
momentum of inertia of Tyrannosaurus,
gravitational constant, and the position vector to the
point of the force, respectively. The term
y
body
gm− expresses that gravitational force acts in
vertical direction y. The value of inertia I is chosen
as I=19000
2
mkg ⋅ in our work with the references
(Hutchinson et al. 2007; Bates et al. 2009). A solid
object model is simple, however, it is known to
express dynamics of moving object with many
degree of freedom (Usami et al. 1998).
For calculating joint torque, or moment of the
force about joint, a free-body diagram analysis is
applied as shown in Fig.2(b). For example, let us
call the foot segment as segment “1” , and define the
mass and the moment of inertia as m
1
and I
1
,
respectively. Then, the equations of motion for
translation and rotation become as follows in (x, y)
plane,
11121
amgmFF
y
G
GG
=−−
(4a)
11212211
ω
G
G
G
G
IMMFxFx
gg
=−+×−×
(4b)
where
1
F
G
,
2
F
G
and
1
a
G
are the force from downside
segment, the force from upper segment and
acceleration, respectively. For rotational motion,
g
x
1
G
and
g
x
2
G
are the vectors from the center of mass
of 1-th segment to the point acting force
1
F
G
and
2
F
G
.
M
1
and M
2
are the moment of force between the 0-th
and 1-th, 1-th and 2nd segments, respectively. For
the case of 1-th segment
1
F
G
corresponds to the
ground reaction force.
1
ω
is time derivative of
angular velocity. Putting known terms
1
F
G
,
1
a
G
,
1
ω
and M
1
into Eq.(4) yields unknown terms
2
F
G
and
M
2
. Thus, the moment of force acting to upper
segment is obtained, subsequently. In the usual
motion the term
1
ω
and
11
am
G
are negligible. Then,
these terms are set as zero in our calculation. The
parameter for ground reaction is described in our
paper in detail (Usami, 2011c).
2.2 Evolutionary Computation Method
Solid Object Approximation for the
Motion of the Whole Body
Searching the optimal Fourier coefficient
j
i
δ
in
Eq.(2) for running motion is the next task. The other
parameters are fixed in the simulation.
Computational method for obtaining the optimal
solution in many degree of freedom is usually not an
easy task. So, a variety of approximation methods
have been proposed in many research areas. One of
the famous and well studied methods is the genetic
algorithm (GA) (Fraser 1970; Holland 1975;
Goldberg 1989). A vast number of studies has been
published in many research areas concerning to GA.
This method is based on an idea of gene evolution
observed in the actual life system. In this method
digitized virtual genes are introduced, and its
evolution is simulated. The virtual gene falls into the
stable state in which a value of evaluation function
has the local minimum. On the contrary, the
introduction of virtual genes is not necessary in the
present study. So, looking for another convenient
approximation method is appropriate. Another
approximation method for obtaining near optimal
solution is the evolutionary computational method
(Sellers and Manning 2007; Usami 1998; Fogel
1995). This method is known as well as genetic
algorithm method on searching near optimal
solution. This method does not introduce digitized
virtual gene, but change the parameters of the
system directly. A value of the evaluation function
converges into the local minimum rapidly, and the
result is usually satisfactory. Then, we use
evolutionary computational method for this problem.
COULD TYRANNOSAURUS RUN FAST? - Mechanical Power Calculation for 15.7 m/s Tyrannosaurus Running
15
At first, we create several typical patterns of
running motion at hand using 3D software 3dsmax
(Autodesk co.). The typical patterns include various
motions from flexed one to upright one. Next, we
apply dynamical simulation described above. Our
method does not introduce virtual gene as appeared
in the usual genetic algorithm, but, changes
parameters itself in the Eq.(2).
Let us call the initial set of parameters as the
initial parent. The initial parent makes 2000 children
whose parameters are slightly different from the
initial parent. The different parameters are generated
by a random algorithm. The running simulation is
applied for the 2000 children, and the best
performance child is selected among those. Then,
the best performance child becomes the parent in the
next generation. Thus, near optimal solution on
running motion is obtained as a result of the
evolutionary computation scheme. The term "best
performance" is determined by the introduction of
the evaluation function. It is discussed in the next
section in detail.
3 MECHANICAL POWER IN
TYRANNO-SAURUS RUNNING
MOTION
In this section result of calculation of mechanical
power output for Tyrannosaurus running motion is
presented.
3.1 Moment of Force, Angular Velocity
and Mechanical Power
In the simulation, we have carried out calculation in
a range of cycle time T=0.5~0.7(s). Many different
running patterns are appeared in the simulations with
different initial conditions. Let us define ground
reaction force multiplier factor G as
GgmF
body
−= , where F and
body
m is ground
reaction force in the vertical direction and the total
mass of Tyrannosaurus. Then, biomechanical
knowledge tells that moderate speed running motion
is realized when 1<G<2, and fast running is realized
when 2<G<4. If G exceeds 4, the running motion is
said to be beyond reality.
As for the evaluation function in the optimization
process, we have tried several types of evaluation
function such as vertical acceleration, running
velocity and the product of velocity and vertical
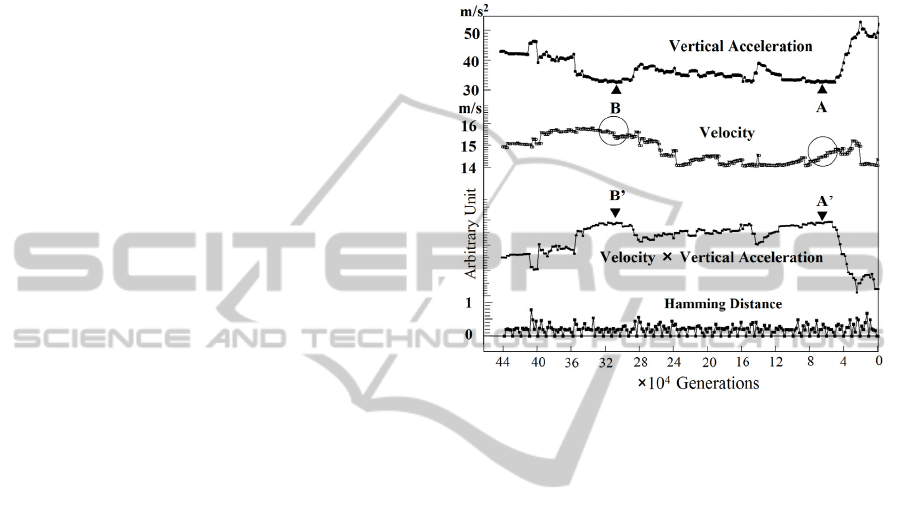
acceleration, etc. Figure 3 displays a successful case
that local minimum of vertical acceleration appeared
in the simulation, which is shown as A and B. A and
B give the same value of the local minimum in the
simulation. However, corresponding velocities are
different as shown by the circle in Fig.3. Then, B’
gives a slightly better solution in the criteria of
velocity times vertical acceleration.
Figure 3: An example of simulation of
5
104.4 ×
generations. Vertical acceleration, velocity,
velocity
×
vertical acceleration, and Hamming distance of
subsequent generations are plotted.
Hamming distance for subsequent generations is
also plotted in Fig.3. This data shows that small
change of the parameters affects pattern of
locomotion, which leads to the change of vertical
acceleration and running velocity.
In the computer simulation most of the examples
yielded bad results, namely, there was no
appropriate local minimum. Or, in many cases
vertical acceleration increased in the simulation of
the evolution algorithm. Figure 4 displays such an
example. It started from a slightly different initial
condition from the one of Fig.3. Thus, a result of
simulation depends on the choice of the initial
condition. Then, we have carried out many running
simulations for searching a solution which gives the
lowest vertical acceleration and the fastest running
velocity.
Generally, an evolution algorithm is able to
obtain a local minimum of evaluation function.
However, we have to obtain the global minimum of
the evaluation function, i.e., running speed and
vertical acceleration. Thus, searching efficient
algorithm, which brings an appropriate solution for
this study is left for us as the future problem.
ECTA 2011 - International Conference on Evolutionary Computation Theory and Applications
16
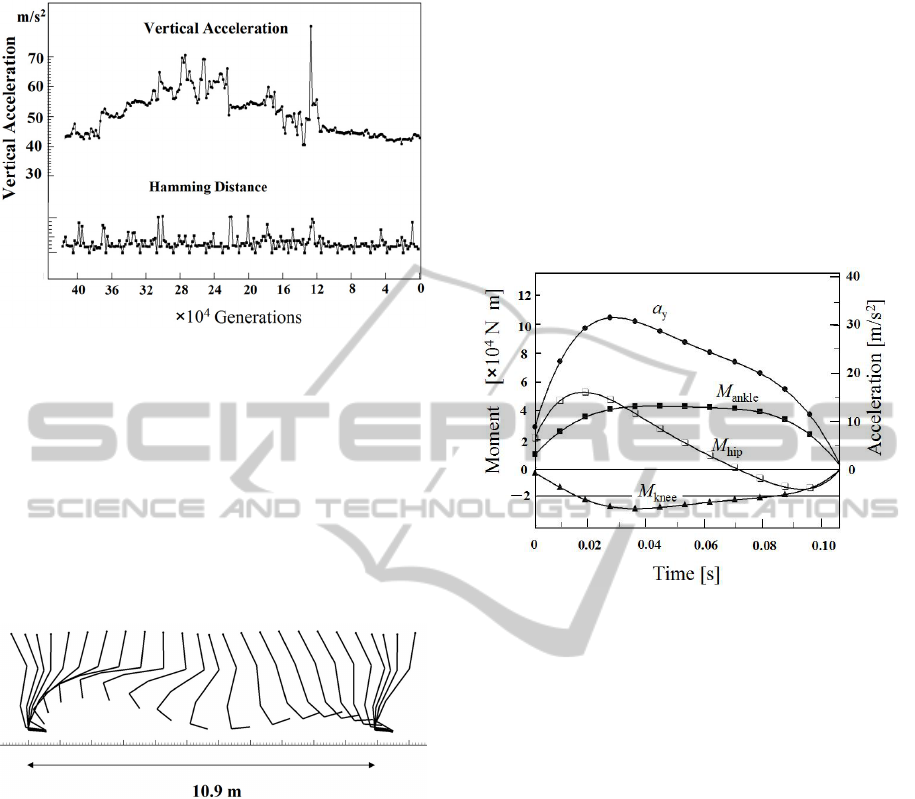
Figure 4: Another example of running simulation, which is
failed to obtain a local minimum.
Furthermore, it is noted that the present
evolutionary algorithm is rather primitive.
Developing better algorithm to search the global
minimum would shed light on this problem.
However, it is also noted that running motion in the
simulation is very sensitive to a small change of
parameters. The choice of the evaluation function,
i.e., running velocity, vertical acceleration, or the
product of those is also not a simple problem.
Figure 5: Stick diagram of the fastest running motion in a
speed of 15.7 m/s appeared in our numerical simulation.
Then, as a whole finding the global minimum of
the system is said to be a difficult problem.
In the range of cycle time T=0.5~0.7(s) we have
searched solution with 1<G<4. In this range of G we
have obtained solution of running speed v=8.0~15.7
(m/s). Then,
v
=15.7 (m/s) is the maximum speed
appeared in our numerical simulation with
G
=3.2,
which is valid in biomechanical knowledge. Figure 5
displays stick diagram of running motion of
v =15.7
(m/s). The cyclic time is T=0.69 (s) in this case,
and the stride length is 10.9 (m) as appeared in
Fig.5. Figure 6 shows vertical acceleration
y
a
, and
moment of the force of the hip joint
hip
M
, knee joint
knee
M and ankle joint
knee
M . The contribution of
the toe joint is omitted because the ankle extensors
could have been producing most of the required toe
joint moments (Hutchinson 2004a, 2004b). We
observe that the maximum of vertical acceleration is
31, which yields multiplier factor G=3.2. The
maximum of the moment of force is 5.1 ×10
4
(N・
m). Note that the center of mass is located at the hip
joint in this calculation. It is known that the center of
mass of Tyrannosaurus is located 0.3-0.7m cranial
based on mass property study (Bates et al., 2009:
Gatesy and Hutchinson, 2009).
Figure 6: The vertical acceleration
y
a
, and moment of
force of each joint
i
M
where i=hip, knee and ankle.
It should be noted that these may change the
value of the moment of force by a factor of two
based on our works (Usami 2011b, 2011c).
Corresponding angular velocity of each joint is
plotted in Fig.7. Then, mechanical power output of
each joint
i
P
is calculated using the relation.
iii
MP
⋅
=
ω
. The
i
P
, the sum of each power
anklekneehiptotal
PPPP
+
+
=
, and vertical acceleration
is plotted in Fig.8. The moment of force of the hip
joint M
hip
changes its sign from plus to be minus in
Fig.6, then,
hip
P
and
Total
P
shows the double peak.
In the data of biomechanical study, vertical
acceleration usually shows the sine curve with time.
It is observed that
y
a is slightly different from
sine curve in Fig. 6 and Fig.8. This is mainly due to
the fact that each part of the body is smoothly
connected. And, it prevents sudden change of
acceleration.
Our
Tyrannosaurus model is only made by leg
part, then there is no room to absorb large change of
acceleration. Each body part such as neck, trunk and
tail would absorb such large change of acceleration
COULD TYRANNOSAURUS RUN FAST? - Mechanical Power Calculation for 15.7 m/s Tyrannosaurus Running
17
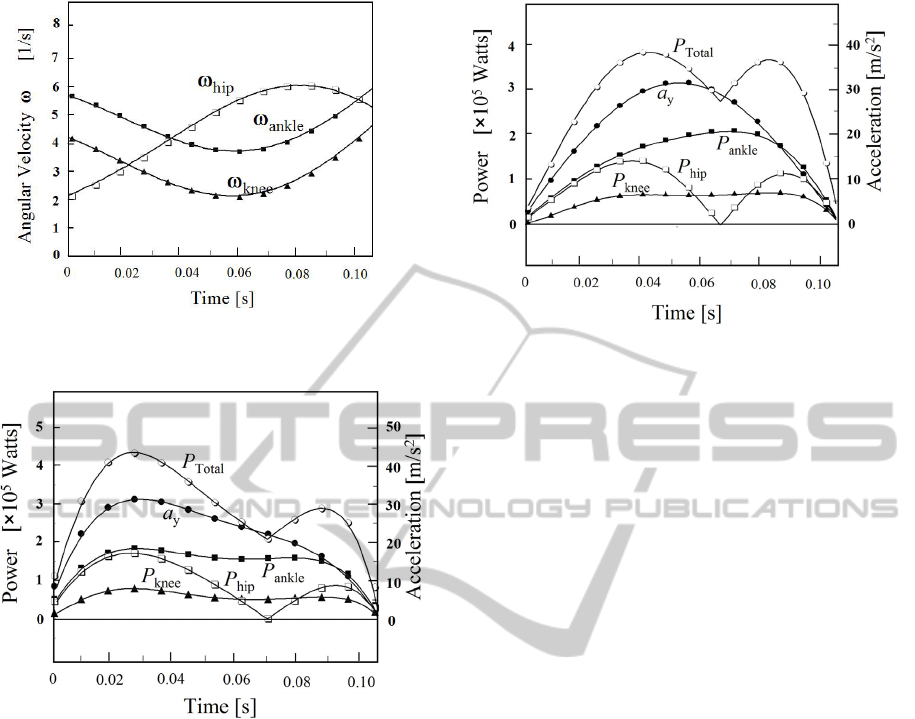
Figure 7: Angular velocity of each joint ω
i
, where i=hip,
knee and ankle.
Figure 8: Mechanical power for i-th joint Pi, the sum and
the vertical acceleration
y
a
.
in Tyrannosaurus. Then, we correct this discrepancy
by giving sine function for vertical acceleration in
the calculation of Fig.8. The result is shown in Fig.9,
in which the maximum value of acceleration is set
equal to the one of Fig.6. Namely, we give the sine
function for vertical acceleration, and re-calculate
P
i
.
The maximum power of
P
total
is obtained as
3.89×10
5
(Watts) in the stance phase of 15.7 (m/s)
running. Contribution of the power of the toe joint is
omitted as the same reason discussed in the
evaluation of the moment of force in Fig.9.
3.2 Mechanical Power per Kilogram of
Muscle Mass, and Comparison with
the Data of Extant Animals
For the evaluation of running ability, the mechanical
power per kilogram muscle is calculated, and
compared to the other data. The value of
P
total
in Fig.
Figure 9: Each Pi is re-calculated as the vertical accele-
ration being set as sine function for Fig.6.
9 is divided by the muscle mass of a leg. As for
muscle mass of leg, 16 % of the total mass are
employed. 16 % muscle mass per leg is the
maximum ratio derived from recent mass property
studies (e.g. Bates et al. 2009, Hutchinson et al.
2007).
The result is shown in Fig.10. For the
comparison, the data of extant animal is introduced.
Pontzer et al. recently suggested that endothermy is
plausible for large bipedal dinosaurs (Pontzer et al.
2009). And at present, birds are widely recognized
as flying theropod dinosaurs. These may imply high
activity in locomotion for such dinosaurs. The
mechanical power output of muscle has been
reported in many articles. Askew et al. reported that
a power output for one individual of blue-breased
quail (Coturnix chinensis) was 530 W/kg (Askew et
al. 2001a, 2001b). They also calculated the power
requirements during takeoff flights in four other
species in the family Phasianidae, one species of
hawk, several species of hummingbird and two
species of bee. Remarkably, they concluded that,
over a broad range of body size (0.0002–5 kg) and
contractile frequency (5–186 Hz), the myofibrillar
power output of flight muscles during short maximal
bursts was very high as 360–530W/kg (Askew et al.
2001a, 2001b). On measurements on bundles of
muscle fibres
in vitro Askew and Marsh reported
that the highest was 433 W/kg (Askew and Marsh,
2001a).
Smaller values were reported by Dial and
Biewener as 119 W/kg for pegion during takeoff
(Dial and Biewener, 1993). For Australian rocket
frogs (Litoria nasuta) James and Wilson reported
that an average power output during takeoff in
jumping varied between individuals within a range
from 318 to 747 W/kg (James and Wilson, 2008).
ECTA 2011 - International Conference on Evolutionary Computation Theory and Applications
18
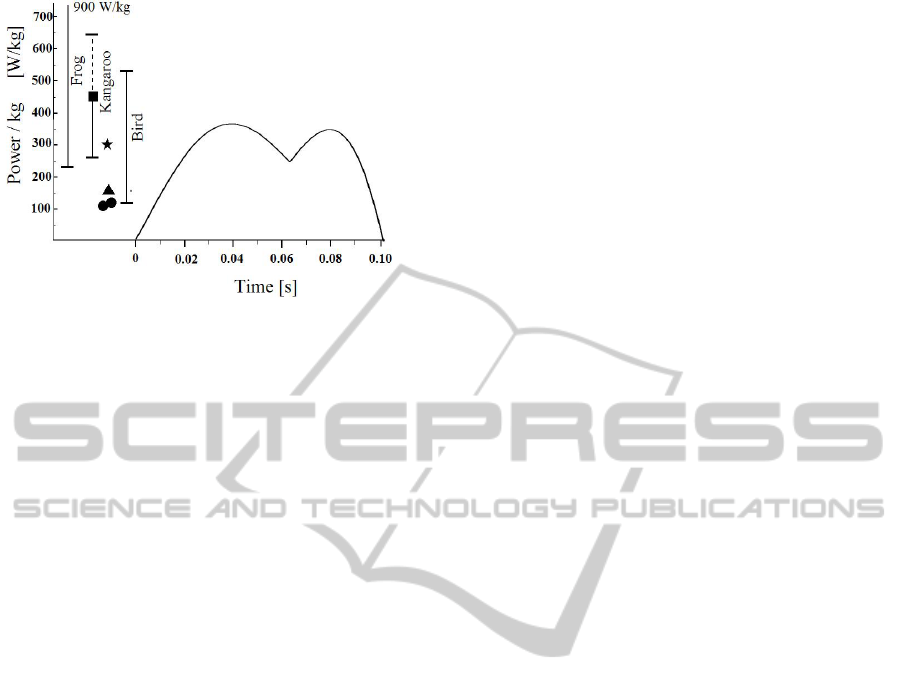
Figure 10: The power per kilogram of muscle mass and
the data for extant animal.
Wilson et al. reported high power output of 900
W/kg (Wilson et al., 2000). The others are in a range
of 225-550 W/kg (225-550 W/kg by Marsh and
Alder 1994; 360 W/kg by Lännergren et al. 1982).
On mammals, high power output was observed in
kangaroo jumping as 495-640 W/kg by McGowan et
al. (McGowan et al. 2005). They suggested that back,
trunk and tail musculature likely play a substantial
role in contributing power during jumping. Inclusion
of this musculature decreased the value to 452 W/kg
for the power output.
To sum up, animal's mechanical power output
high values of several hundreds W/kg have been
widely observed in different taxa. Relation with the
result obtained in contractile property study of
bundles of muscle fibre is left as future works.
Currently, it is not solved yet how an animal can
generate such high mechanical power output.
Remarkably, Lappin et al. reported that mechanical
power of mandibulae muscles of frog reached to
9600 W/kg for (Lappin et al., 2006). It is noted that
lower values in different taxa have been widely
reported as 107 W/kg for mouse (James et al. 1995),
110-122 W/kg for dolphin (Gray, 1936; Weis-Fogh
et al., 1977). As a conclusion, these values permit
for
Tyrannosaurus to run in a speed of 15.7 (m/s).
4 CONCLUSIONS
In 2002 Hutchinson and Garcia doubted fast running
ability of
Tyrannosaurus for the first time
(Hutchinson and Garcia, 2002). Since then, large
bipedal theropod such as
Tyrannosaurus has been
considered as a slow runner. Sellers and Manning
studied this issue in 2007, and published a result that
8~9 (m/s) running is possible. However, parameters
used in the simulation was not well described. Then,
it is difficult to check their result. Quite recently, we
have studied this issue in detail (Usami, 2010a-c). In
the study, it is revealed that parameters used in
Hutchinson et al.'s studies (Hutchinson and Garcia,
2002; Hutchinson 2004b, Gatesy et al. 2009) have
uncertainty of approximately two folds. In addition,
we have obtained a result that 15.7 (m/s) running is
possible even in the framework of Hutchinson et al's
work. In this paper, we have studied on this issue
from a different angle, namely, based on a
calculation of mechanical power output. A
calculation of this quantity has never been done in
this research field. This methodology is superior
than Hutchinson et al.'s methodology. Because,
Hutchinson et al.'s methodology relied on static
calculation. There is no explicit relation of running
velocity with the other quantity in the theory. The
discussion of Froude number is employed for speed
evaluation, however, it is primitive, and known that
it may contain two folds error (Rainforth and
Manzella, 2007). There is no such uncertain
parameter in the calculation of mechanical power
output.
For the final evaluation for running ability only
the quantity of power per kilogram of muscle mass
is a parameter in the calculation. In addition, there
has been detailed studies on how much muscle mass
Tyrannosaurus has for hind limb. It tells that
Tyrannosaurus has 15~16 % muscle mass for one
hind limb. Then, comparatively accurate evaluation
can be achieved. Note that approximately two folds
error can be contained in our mechanical power
calculation because of uncertainty of the position of
the center of mass. Even considering this factor the
data of power output of extant animal allows fast
running motion of
Tyrannosaurus. The speed is 15.7
(m/s), which is faster than human. Then, we can
conclude that a possibility of fast running of
Tyrannosaurus can not be excluded.
Figure 11 summarizes the published data and the
present data of running speed and Froude number
Fr.
The original Hutchinson and Garcia's estimation,
which deny a possibility of fast running is for
v=20
(m/s) and Fr=16 with hip height h=2.5 (m). Our data
presented by this paper does not conflict with their
evaluation.
We show how it looks like if
Tyrannosaurus runs in
a speed of 15.7 (m/s) in Fig.12. Two poles are
located with distance of 31.4 m as shown in Fig.12.
A car ran between them with 2.0 seconds, which
leads a speed of 15.7 (m/s) (56.9 km/h, 35.4 mph).
This scene was filmed at first, and next 3D
reconstructed
Tyrannosaurus was synthesized in the
scene.
COULD TYRANNOSAURUS RUN FAST? - Mechanical Power Calculation for 15.7 m/s Tyrannosaurus Running
19
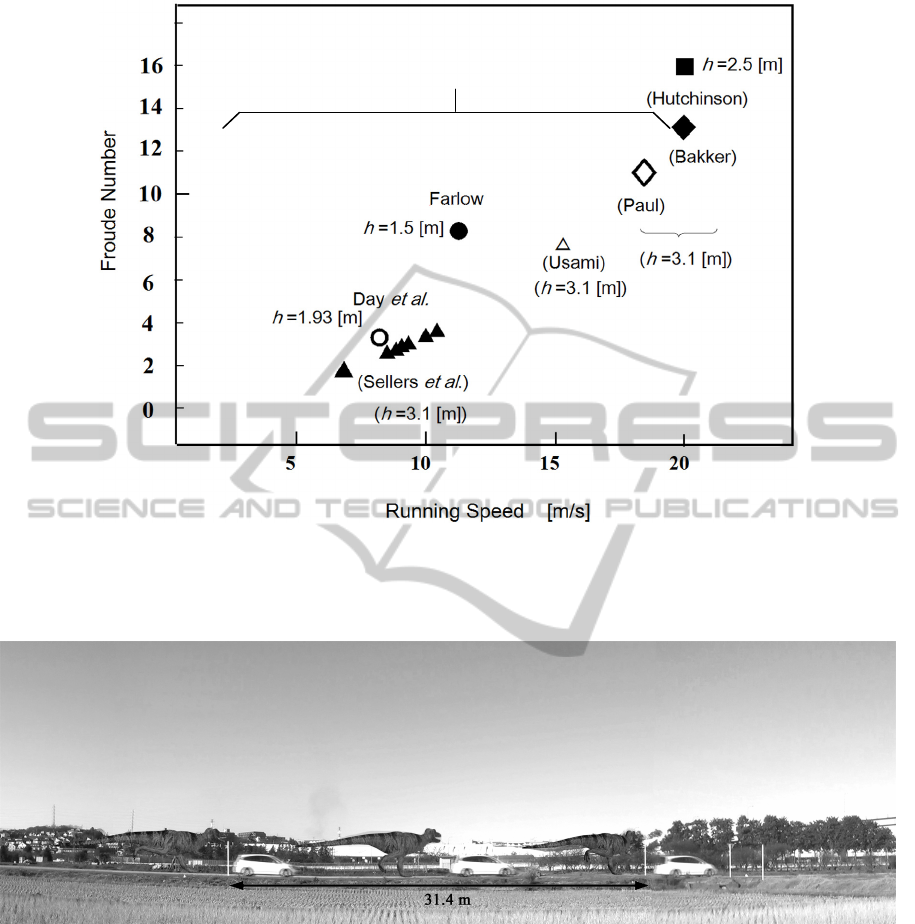
Figure 11: Running speed v.s. Froude number. Hutchinson and Garcia's data is located for v=20 (m/s) and Fr=16 with hip
height h=2.5 (m). They denied such fast running of Tyrannosaurus. However, the other data permit fast running of
Tyrannosaurus from the one that is comparable to human by Sellers et al. (Sellers et al. 2007) to the present result and Paul
and Bakker (Bakker 1986; Paul, 1988). The h represents hip height in the figure.
Figure 12: How it looks like if Tyrannosaurus runs in a speed of 15.7 (m/s) in the present world.
As it is noted in Section 3, searching the global
minimum of the evaluation function of running
velocity and vertical acceleration is a difficult
problem. Small difference of parameters changes
pattern of locomotion greatly as appeared in Fig.3
and Fig.4. We have carried out many running
simulations to obtain a good solution, i.e., the lowest
vertical acceleration and the fastest running speed.
Evolution algorithm is able to obtain a local
minimum of the evaluation function. However, it is
needed to obtain the global minimum of the
evaluation function, i.e., vertical acceleration and
running velocity for this problem. Then, developing
more sophisticated algorithm to bring an appropriate
solution easily is left as a future problem. If a better
algorithm was developed, it would be of great help
for the study of this research area.
ACKNOWLEDGEMENTS
The author thanks to Prof. Yoshiyuki Kazuyoshi to
provide human locomotion data using VICON
Running
No Running
ECTA 2011 - International Conference on Evolutionary Computation Theory and Applications
20

system and his original software WaveEyes. The
author thanks to a referee who suggested power
output evaluation.
REFERENCES
Alexander, R. Mc. N.,1976. Estimates of speeds of
dinosaurs. Nature, vol. 261, p. 129-130.
Alexander, R. Mc. N., 1985. Mechanics of posture and gait
of some large dinosaurs, Zoological Journal of
Linnean Society, vol. 83, p. 1-25.
Alexander, R. Mc. N., 1989. The Dynamics of Dinosaurs
and Other Extinct Giants, Columbia University Press,
New York.
Alexander, R. Mc. N., 1996. Tyrannosaurus on the run,
Nature, vol. 379, p. 121-121.
Alexander, R. Mc. N., 2006. Dinosaur biomechanics,
Proceedings of the Royal Society, vol. B 273, p. 1849-
1855.
Alexander, R. Mc. N. and Jayes, A. S., 1983: A dynamic
similarity hypothesis for the gaits of quadrupedal
mammals, Journal of Zoology, vol. 201, p. 135-152.
Askew, G. N., March, R.L. and Ellington C, P., 2001a:
The mechanical power output of the flight muscles of
blue-breasted quail (Coturnix chinensis) during take-
off. Journal of Experimental Biology, vol. 204,
p.3601-3619.
Askew, G. N. and Marsh, R.L., 2001b: The mechanical
power output of the pectoralis muscle of blue-breated
quail (Coturnix chinensis): the in vivo length cycle and
its implications for muscle performance. Journal of
Experimental Biology, vol. 204, p. 3587-3600.
Bakker, R. T., 1986: Dinosaur Heresies. William Morrow,
New York.
Bates, K. T., Manning, P. L., Hodgetts, D. and Sellers, W.
I., 2009: Estimating Mass Properties of Dinosaurs
Using Laser Imaging and 3D Computer Modelling,
PLoS ONE, 4 (2): e4532 doi:10.1371/
journal.pone.0004532.
Day, J. J., Norman, D. B., Upchurch, P. and Powell, H. P.,
2002: Dinosaur locomotion from a new trackway,
Nature, vol. 415, p. 494-495.
Dial, K. P. and Biewener, A. A. 1993. Pectorialis muscle
force and power output during different modes of
flight in pigeons (Columba livia), Journal of
Experimental Biology 176: 31-54.
Farlow, J. O., 1981: Estimates of dinosaur speeds from a
new trackway site in Texas, Nature, vol. 294, p. 747-
748.
Fogel, D. B., 1995. Evolutionary Computation, Toward a
New Philosophy of Machine Intelligence, IEEE Press,
Piscataway, NJ.
Fraser, A., 1970: Computer Models in Genetics, McGraw-
Hill , Donald Burnell, New York.
Fraser, A. 1970. Computer Models in Genetics, McGraw-
Hill , Donald Burnell, New York, 192pp.
Gatesy, S. M., Baker, M. and Hutchinson, J. R., 2009.
Constraint-Based Exclusion of Limb Poses for
Reconstructing Theropod Dinosaur Locomotion,
Journal of vertebrate paleontology, Vol. 29. p. 535-
544. Gatesy, S. M. and Biewener, A. A. 1991. Bipedal
locomotion: effects of speed, size and limb posture in
birds and humans, Journal of Zoology, London 224:
127-147.
Goldberg, D. E., 1989: Genetic algorithms in search,
optimization and machine learning, Addison Wesley.
Gray, J. 1936. Studies in animal locomotion. VI. The
propulsive powers of the dolphin, Journal of
Experimental Biology 13:192-199.
Holland, J. H., 1975. Adaptation in natural and artificial
systems, University of Michigan Press.
Hutchinson, J. R., 2004a. Biomechanical modeling and
sensitivity analysis of bipedal running. I. Extant Taxa.
Journal of Morphology, vol. 262, p. 421-440.
Hutchinson, J. R., 2004b. Biomechanical modeling and
sensitivity analyis of bipedal running ability. II.
Extinct taxa, Journal of morphology, vol. 262, p. 441-
461.
Hutchinson, J. R. and Garcia, M., 2002: Tyrannosaurus
was not a fast runne, Nature, vol. 415, p. 1018-1021.
Hutchinson, J. R. Ng-Thow-Hing, V. and Anderson, F. C.,
2007: A 3D interactive method for estimating body
segmental parameters in animals: Application to the
turning and running performance of Tyrannosaurus
rex., Journal of theoretical biology., vol. 246, p. 660-
680.
James, R. S., Atringham, J. D. and Goldspink, D. F. 1995.
The mechanical properties of fast and slow skeletal
muscles of the mouse in relation to their locomotory
function, Journal of Experimental Biology 198: 491-
502.
James, R. S. and Wilson, R. S. 2008. Explosive Jumping:
Extreme Morphological and Physiological
Specializations of Australian Rocket Frogs (Litoria
nasuta), Physiological and Biochemical Zoology 81:
176-185.
Lännergren, J.,Lindblom, P. and Johansson, B. 1982.
Contractile properties of two varieties of twitch muscle
fibtres in Xenopus laevis. Acta Physiologica
Scandinavica. 114: 523-535.
Lappin, A. K., Monroy, J. A., Pilarski, J. Q., Zepnewski,
E. D., Pierotti, D. J. and Nishikawa, K. C. 2006.
Storage and recovery of elastic potential energy
powers ballistic prey capture in toads. Journal of
Experimental Biology 209: 2535-2553.
Marsh, R. L. and John-Alder, H. B. 1994. Jumping
performance of hylid frogs measured with high-speed
cine film. Journal of Experimental Biology 188: 131-
141.
McGowan, C. P., Baudinette, R. V., Usherwood, J. R. and
Biewener A. A. 2005. The mechanics of jumping
versus steady hopping in yellow-footed rock wallabies.
Journal of Experimental Biology 208: 2741-2751.
Paul, G. S., 1988: Predatory Dinosaurs of the World,
Simon & Schuster, New York
Pontzer, H., Allen, V. and Hutchinson, J. R., 2009
Biomechanics of Running Indicates Endohermy in
COULD TYRANNOSAURUS RUN FAST? - Mechanical Power Calculation for 15.7 m/s Tyrannosaurus Running
21

Bipedal Dinosaurs, PLoS ONE, 4 (11):e7783
doi:10.1371/journal.pone.0007783.
Rainforth, E. C. and Manzella, M., 2007: Estimating
speeds of dinosaurs from trackways: a re-evaluation of
assumptions. GANJ 24: Contributions to the
paleontology of New Jersey (II) (Ed. Rainforth E. C. ),
p. 41-48.
Russell, D. A. and Beland, P. 1976. Running Dinosaurs,
Nature 264: 486.
Sellers, W. I., Manning, P. L., 2007: Estimating dinosaur
maximum running speeds using evolutionary robotics,
Proceeding of the Royal Society., vol. B 274, p. 2711-
2716.
Thulborn, R. A., 1981: Estimated speed of a giant bipedal
dinosaur, Nature, vol. 292, p. 273-274.
Thulborn, R. A., 1989: The Gais of dinosaurs. In. Gillette,
D. D. and Lockley, M. G. eds., Dinosaur Tracks and
Traces, p. 39-50. Cambridge University Press,
Thullborn, R. A., 1990: Dinosaur Tracks, Chapman &
Hall, London.
Usami, Y., 2011a, Was Tyrannosaurus really not a fast
runner? Reports of faculty of engineering (in
Japanese), Kanagawa University, pp13-17.
Usami, Y., 2011b: On the possibility of fast running of
heavy theropod Tyrannosaurus. Submitted to
BIOPHYSICS.
Usami, Y., 2011c: How fast Tyrannosaurus could run ?
Submitted to BIOPHYSICS.
Usami, Y., et. al., 1998: Reconstruction of Extinct
Animals in the Computer. Reconstruction of Extinct
Animals in the Computer. In. Adami, C., Belew, R. K.,
Kitano, H. and Taylor C.E. eds., Artificial Life VI, p.
173-177. MIT Press, UCLA.
Wallace, R. L. and Brooks, W. S. 2003. A dinosaur
trackways exerceis, Bioscene, vol. 29, p. 3-7.
Weis-Fogh, T., Alexander, R. Mc. N. and Pedley, T. J.
1977. The sustained power output from striated
muscle. In, Pedley, T. ed., Scale Effects in Animal
Locomotion, p. 511-525. Academic Pres Inc., New
York.
Wilson, R. S., Franklin, C. E. and James, R. S. 2000.
Allometric scaling relationships of jumping
performance in the striped marsh frog Limnodynastes
peronii. Journal of Experimental Biology 203: 1937-
1946.
ERRATUM
"COULD TYRANNOSAURUS RUN FAST?
MECHANICAL POWER CALCULATION FOR 15.7 m/s
TYRANNOSAURUS RUNNING" by Y.Usami.
Numerics of the vertical left hand axis in Fig.8 and Fig.9
are 1~5 instead of 10~50. These are simple notation
mistakes. Fig.6 and Fig.7 yield to these results. And, it
matches Fig.10.
ECTA 2011 - International Conference on Evolutionary Computation Theory and Applications
22
