
PATTERN CLUSTERING USING ANTS COLONY, WARD
METHOD AND KOHONEN MAPS
Rosangela Villwock
University of West of Paraná, Universitária Street, 2069, Cascavel, Brazil
Maria Teresinha Arns Steiner, Paulo Henrique Siqueira
Federal University of Paraná, PO BOX 19081, Curitiba, Brazil
Keywords: Data mining, Metaheuristics, Ant-based clustering.
Abstract: The goal of this paper is to propose improvements to the ACA (Ant-based Clustering Algorithm), and
evaluate its performance relative to the Ward Method; to the One-dimensional Kohonen Maps and to the
ACAM (Ant-based Clustering Algorithm Modified) algorithm. The algorithm containing the improvements
will be referred here by “proposed” algorithm. Its the main changes were: the introduction of a comparison
between the probability of dropping a pattern at the position chosen randomly and the probability of
dropping this pattern at its current position; the introduction of an evaluation of the probability of a
neighboring position when the decision to drop a pattern is positive and the cell in which the pattern should
be dropped is occupied; and the replacement of the pattern carried by an ant, in case this pattern is not
dropped within 100 consecutive iterations. To assess the performance of the proposed algorithm three real
and public databases were used (Iris, Wine and Pima Indians Diabetes). The results showed superiority of
the proposed algorithm when comparing with the ACAM algorithm in two of the three databases.
1 INTRODUCTION
Societies of social insects are distributed systems
that exhibit a highly structured social organization,
despite the simplicity of their individuals. As a result
of this organization, ant colonies can accomplish
complex tasks that in some cases exceed the
individual capacity of a single ant. In research area
of ''ant algorithms'' are studied models inspired by
the observation of the behavior of real ants and these
models are used as inspiration for the development
of new algorithms to solve optimization and
distributed control problems (Dorigo and Stützle,
2004).
Among the behaviors of social insects the most
widely recognized is the ability of ants to work
together in order to develop a task that could not be
performed by a single agent. Also seen in human
society, this ability of ants is a result of cooperative
effects. These cooperative effects have recourse to
the fact that the effect of two or more individuals or
coordinated parts is higher than the total of their
individual effects. Some researchers have achieved
promising results in data mining using a colony of
artificial ants. The high number of individuals in ant
colonies and the decentralized approach for
coordinated tasks (performed simultaneously) mean
that ant colonies show high levels of parallelism,
self-organization and fault tolerance. These
characteristics are desired in modern optimization
techniques (Boriczka, 2009).
The Clustering algorithm based on Ants Colony
was chosen for study, analysis and new proposals
due to several factors. First, it is a relatively new
metaheuristic and has received special attention,
mainly because it still requires much investigation to
improve its performance, stability and other "key"
characteristics that would do such algorithm a
mature tool for data mining (Boryczka, 2009).
Moreover, this algorithm can automatically “find”
the number of clusters within the patterns.
The purpose with this paper is to present changes
and improvements to the Ant-based Clustering
Algorithm (ACA) originally proposed by
(Deneubourg et al., 1991), evaluating its
performance when compared to the Ward Method,
137
Villwock R., Arns Steiner M. and Siqueira P..
PATTERN CLUSTERING USING ANTS COLONY, WARD METHOD AND KOHONEN MAPS.
DOI: 10.5220/0003643301370145
In Proceedings of the International Conference on Evolutionary Computation Theory and Applications (ECTA-2011), pages 137-145
ISBN: 978-989-8425-83-6
Copyright
c
2011 SCITEPRESS (Science and Technology Publications, Lda.)

to the One-dimensional Kohonen maps and to the
Ant-based Clustering Algorithm (ACAM). The
Multivariate Statistics area method (Ward Method)
was used because it is one of the most classical
methods in the literature (Johnson and Wichern,
1998). On their turn, the One-dimensional Kohonen
Maps were used because, like the Ant-based
Clustering, they perform simultaneously the
clustering and topographic mapping tasks (Raug and
Tucci, 2010); (Kohonen, 2001).
This paper is structured as follows: section 2
presents a literature review on Ant-based Clustering,
describing the algorithm, the Clustering recovery
and the measures for evaluating clusters; Section 3
presents the databases that was used for the
comparison, the computational implementation
details of the methods, as well as the major
contributions (modifications and improvements) for
the Ant-based Clustering algorithm; Section 4
presents the results and discussion and, finally,
Section 5 presents the final considerations.
2 LITERATURE REVIEW
In the Ant-based Clustering proposed by
(Deneubourg et al., 1991), ants were represented as
simple agents that move randomly on a square grid.
The patterns were scattered within this grid and the
agents (ants) could pick, transport and drop them.
These operations are based on the similarity and on
the density of the patterns distributed within the
local neighborhood of agents, isolated patterns - or
surrounded by dissimilar ones - are more likely to be
picked and then dropped in a neighborhood of
similar ones.
The decisions to pick and drop patterns are made
by the P
pick
and P
drop
probabilities given by equations
(1) and (2), respectively.
2
p
p
pick
k
P=
k+f(i)
(1)
2
d
drop
f(i)
P=
k+f(i)
(2)
In these equations, f(i) is an estimate of the fraction
of patterns located in the neighborhood that are
similar to the current ant’s pattern and k
p
and k
d
are
real constants. In the work of (Deneubourg et al.,
1991), the authors used k
p
= 0.1 and k
d
= 0.3. The
authors obtained the estimate f, through a short-term
memory of each ant, where the content of the last
cell in the analyzed grid is stored. This choice of the
neighborhood function f(i) was primarily motivated
due to its ease of implementation with simple robots.
Lumer and Faieta (1994, apud Handl et al.,
2006) introduced a number of modifications to the
model that allowed the manipulation of numeric data
and improved the quality of solution and the
algorithm’s convergence time. The idea was to
define a measure of similarity or dissimilarity
between the patterns, since in the algorithm initially
proposed the objects were similar if objects were
identical and dissimilar if objects were not identical.
In that work first appears the topographic mapping.
According to (Vizine et al., 2005), the general
idea with this algorithm is to have similar data in the
original n-dimensional space in neighboring regions
of the grid, this is, data which are neighbors on the
grid indicate similar patterns from the original space.
In the work of Lumer and Faieta (1994, apud
Handl et al., 2006), the decision of picking up
patterns is based on the P
pick
probability given by
equation (1) and the decision to drop patterns is
based on the probability P
drop
given by equation (3),
where f(i) is given by equation (4).
d
drop
2f, if f(i)<k
P=
1, otherwise
(3)
2
jL
d(i, j)
1
f(i) = max 0, 1-
α
σ
(4)
In equation (4), d(i, j) is a function of dissimilarity
between patterns i and j belonging to interval [0,1];
α a scalar parameter that depends on the data
(patterns) and belongs to the interval [0,1]; L is the
local neighborhood of size σ
2
, where σ is the
perception radius (or neighborhood). In their work
the authors used k
p
= 0.1, k
d
= 0.15 and α = 0.5.
Ant-based Clustering algorithms are mainly
based on the versions proposed by Deneubourg et al.
(1991) and Lumer and Faieta (1994, apud Handl et
al., 2006). Several modifications were introduced to
improve the quality of the cluster and, in particular,
the spatial separation between the clusters on the
grid (Boriczka, 2009).
Changes that improve the spatial separation of
the clusters and allow a more robust algorithm were
introduced by (Handl et al., 2006). One of them is
the restriction on the f(i) function given by equation
(5), which serves to penalize high dissimilarities.
2
jL
1d(i,j)
d(i,j)
1- ,
if j 1- > 0
α
σ
α
f*(i)=
otherwise
0,
(5)
According (Vizine et al., 2005), a difficulty in
applying the Ants Clustering algorithm to complex
ECTA 2011 - International Conference on Evolutionary Computation Theory and Applications
138

problems is that in most cases they generate a
number of clusters that is much larger than the real
one. Moreover, usually these algorithms do not
stabilize in a cluster solution, this is, they constantly
construct and deconstruct clusters during the
process. To overcome these difficulties and improve
the quality of results the authors proposed an
Adaptive Ant Clustering Algorithm - A2CA. A
modification included in the present approach is a
cooling program for the parameter that controls the
probability of ants picking up objects from the grid.
2.1 Parameters of the Neighborhood
Function
The clusters’ spatial separation on the grid is crucial
so that individual clusters are well defined, allowing
their automatic recovery. Spatial proximity, when it
occurs, may indicate a premature formation of the
cluster (Handl et al., 2006).
Defining the parameters for the neighborhood
function is a key factor in the cluster quality. In the
case of the σ perception radius it is more attractive to
employ larger neighborhoods to improve the quality
of clusters and their distribution on the grid.
However, this procedure is computationally more
expensive, once the number of cells to be considered
for each action grows quadratically with the radius
and it also inhibits the rapid formation of clusters
during the initial distribution phase. A radius of
perception that gradually increases in time
accelerates the dissolution of preliminary small
clusters (Handl et al., 2006). A progressive radius of
perception was also used by (Vizine et al., 2005).
Moreover, after the initial clustering phase,
(Handl et al., 2006) replaced the scalar parameter
2
1
σ
by
occ
N
1
in equation (5), where N
occ
is the
number of grid cells occupied, observed within the
local neighborhood. Thus, only the similarity, not
the density, was not taken into account. Boryczka
(2009), in her algorithm ACAM, proposed to replace
the scalar
2
1
σ
in equation in (5) by the scalar
2
0
2
σ
σ
, in
which
0
is the initial radius of perception.
According to (Handl et al., ,2006), α determines
the percentage patterns on the grid that rated as
similar. The choice of a very small value for α
prevents the formation of clusters on the grid. On the
other hand, choosing a value too large for α results
in the fusion of clusters.
Determining parameter of α is not simple and its
choice is highly dependent on the structure of the
data set. An inadequate value is reflected by an
excessive or extremely low activity in the grid. The
amount of activity is reflected by the frequency of
successful operations in the ant picking and
dropping. Based on these analyses, (Handl et al.,
2006) proposed an automatic adaptation of α.
Boryczka (2009) proposed a new scheme for
adjusting the value of α.
(Tan et al., 2007) examine the scalar parameter
of dissimilarity in Ant Colonies approaches for data
clustering. The authors show that there is no need to
use an automatic adaptation of α. They propose a
method to calculate a fixed α for each database. The
value of α is calculated regardlessly of the clustering
process.
To measure the similarity between patterns,
different metrics are used. (Handl et al., 2006) use
Euclidean distance for synthetic data and cosine for
real data. Boryczka (2009) tested different
dissimilarity measures: Euclidean, Cosine and
Gower measures.
2.2 The Basic Algorithm Proposed by
(Deneubourg et al., 1991)
At an initial phase, patterns are randomly scattered
throughout the grid. Then, each ant randomly
chooses a pattern to pick and is placed at a random
position on the grid.
In the next phase, called the distribution phase, in
a simple loop each ant is randomly selected. This ant
travels the grid running steps of length L in a
direction randomly determined. According to (Handl
et al., 2006), using a large step size speeds up the
clustering process. The ant then, probabilistically
decides if it drops its pattern at this position.
If the decision to drop the pattern is negative,
another ant is randomly chosen and the process
starts over. If the decision is positive, the ant drops
the pattern at its current position on the grid, if it is
free. If this grid cell is occupied by another pattern it
must be dropped at a free neighboring cell through a
random search.
The ant then seeks for a new pattern to pick.
Among the free patterns on the grid, this is, patterns
that are not being carried by any ant, the ant
randomly selects one, goes to its position on the
grid, evaluates of the neighborhood function and
probabilistically decide if it picks this pattern. This
choosing process of a free pattern on the grid runs
until the ant finds a pattern that should be picked.
Only then this phase is resumed, choosing
another ant until a stop criterion is satisfied.
PATTERN CLUSTERING USING ANTS COLONY, WARD METHOD AND KOHONEN MAPS
139

2.3 Cluster Recovery
The process begins with each pattern forming a
cluster. After calculating the distances between all
clusters, the two clusters with smaller distance
should be connected. The most common types of
connections are: Simple Connection, Connection
Full, Medium Connection and the Ward Method
(Johnson and Wichern, 1998). The distances
between clusters are defined in terms of their
distance on the grid. Each pattern is now composed
of only two attributes that position them on the two-
dimensional grid. The distance between any two
patterns is then the Euclidean distance between two
grid points. This process repeats until a stop criterion
is satisfied.
When patterns around the edges of the clusters
are isolated, (Handl et al., 2006) introduced a weight
that encourages the fusion of these patterns with the
clusters. The Ward Method used in this work
connects two clusters based on "information loss".
2.4 Clustering Evaluation
In the evaluation of clusters, different aspects can be
observed: determine clustering the trend of a set of
data, compare results of an analysis of clusters with
results externally known, assessment of how well
the results of an analysis of clusters fit the data
without reference to external information, compare
the results of two different sets of cluster analysis to
determine which one is better, or even determine the
correct number of clusters (Tan et al., 2005).
According to these authors, the numerical
measures applied to assess different aspects of
cluster evaluation are classified into three types:
external indexes are used to measure the extent to
which cluster labels correspond to labels of classes
provided externally; the internal indices are used to
measure how good the clustering structure is
unrelated to external information and the relative
indices are used to compare two different clusters.
In her work, Boryczka (2009) used two internal
indices (the Intra-Cluster Variance and Dunn's
Index) and two external indices (Measure F and the
Random Index). These measures are described
below and are also used in this work.
Measure F uses the idea of accuracy and memory
of information retrieval. Each class i is a set of n
i
desired patterns; each cluster j (generated by the
algorithm) is a set of n
j
patterns; n
ij
is the number of
patterns in class i belonging to cluster j. For each
class i and cluster j, precision p and memory r are
defined as
(, )
ij
j
n
pi j
n
and
(, )
ij
i
n
ri j
n
, respectively.
The value of measure F is given by equation (6).
i
j
i
n
F= max F(i,j)
n
(6)
where:
2
2
(b + 1).p(i, j).r(i, j)
F(i, j) =
b.p(i,j)+r(i,j)
Value b should be "1" to give equal weight to
precision p and recall r. In equation (6), n is the size
of the dataset. F is limited to the interval [0, 1] and
should be maximized.
Random Index (R) is given by equation (7),
where a, b, c and d are calculated for all possible
pairs of i e j patterns and their respective clusters U
(correct classification - c
U
(i) and c
U
(j)) and V
(solution generated by the clustering algorithm -
c
V
(i) and c
V
(j)). R is limited to the interval [0, 1] and
should be maximized.
a+d
R=
a+b+c+d
(7)
where:
UUV V
UUVV
UU V V
UU V V
a = i, j | c (i) = c (i) ^ c (i) = c (i)
b = i, j | c (i) = c (i) ^ c (i)¹c (i)
c = i, j | c (i)¹c (i) ^ c (i) = c (i)
d = i, j | c (i)¹c (i) ^ c (i)¹c (i)
2.5 Other Clustering Methods used
In this work, as already mentioned, three methods
were selected for comparison with the algorithm
here proposed: Ward Method (classical statistical
method); One-dimensional Kohonen Neural
Networks (performs topographic mapping and
clustering simultaneously) and the ACAM
(analogous to the method proposed here). All three
methods are briefly described below.
2.5.1 Ward Method
According to Johnson and Wichern (1998), the
Ward Method used in this work connects two
clusters based on "information loss". The sum of the
square error (SSE) is considered the criterion for
"information loss". For each cluster i, the cluster’s
mean (or centroid) is calculated, as well as the sum
of the square error of cluster i (SSE
i
), which is the
sum of the square error of each pattern in the cluster
in relation to the mean value. For k clusters there are
SSE
1
, SSE
2
, ..., SSE
k
, where SSE is defined by
equation (8).
ECTA 2011 - International Conference on Evolutionary Computation Theory and Applications
140

SSE = SSE
1
+ SSE
2
+ ... + SSE
k
(8)
For each pair of clusters m and n, the mean (or
centroid) is first calculated for the cluster formed
(cluster mn). Next, the sum of square error for
cluster mn (SSE
mn
) is calculated according to
equation (9). The m and n clusters that show the
smallest increase in the sum of square error (SSE)
(smallest “loss of information”) will be merged.
SSE = SSE
1
+ SSE
2
+ ... + SSE
k
– SSE
m
– SSE
n
+ SSE
mn
(9)
2.5.2 One-dimensional Kohonen Neural
Networks
According to Fausett (1994), in 1982, Teuva
Kohonen developed the method of self-organizing
maps that makes use of a topological structure to
cluster units (patterns). Self Organizing Maps
(SOM), also known as Kohonen Neural Networks,
form a class of neural networks in which learning is
unsupervised.
According to Haykin (2001) the main purpose
with the Kohonen Neural Networks is transform
input patterns of arbitrary dimension into a discrete
map. The neurons are placed at the nodes of a grid,
which can have any number of dimensions. Usually
two-dimensional grids are used (called 2D-SOMs).
There are also the 1D-SOMs (used here) and 3D-
SOMs, which use grids (or maps) of one and three
dimensions, respectively.
The learning process of a Kohonen Neural
Network is based on competitive learning in which
the grid’s output neurons compete to be activated.
The output neuron that wins the competition is
called the winning neuron. All neurons on the grid
should be exposed to a sufficient number of input
patterns to ensure proper ripening of the self-
organization process (Haykin, 2001).
According to Haykin (2001), besides the
competition process to form the map, the
cooperation and adaptation processes are also
essential. In the cooperation process, the winning
neuron locates the center of a topological
neighborhood of cooperative neurons. For the self-
organization process to occur the excited neurons
have their synaptic weights set in the adaptation
process. The adjustment made is such that the
winning neuron's response to the application of a
similar input pattern is enhanced.
According to Siqueira (2005), several error
measures can be used to determine the quality of a
map. In his work, the author uses the quantization
error, which represents the average error that
corresponds to the difference between the patterns
and the weights of the winning neurons, the
topological error, which represents the percentage of
winning neurons that lack the second winner in a
neighborhood of unitary radius centered on the
winning neuron and the square mean error.
There are several approaches to variants of
Kohonen Neural Networks. The algorithms, inspired
by the original, modify some aspects as, for instance,
neighborhood criterion, how to choose the winning
neuron, the use of hierarchical maps and accelerated
learning, among others (Kohonen, 1995).
2.5.3 ACAM Method
Boryczka (2009) presented a modification of the
clustering algorithm proposed by Lumer and Faieta.
To increase the robustness of the clustering based on
ants, the author has incorporated two major changes
compared to the classical approach: 1. an adaptive
perception scheme occurred in the density function
and 2. a cooling scheme of α-adaptation, this is, a
cooling scheme for the adaptation of parameter ,
modifications already mentioned in section 2.1.
3 RESEARCH MATERIALS AND
METHODS
The databases used in this study were: Iris, Wine
and Pima Indians Diabetes, available at
http://mlearn.ics.uci.edu/databases. Table 1 shows
the number of patterns, the number of attributes and
the number of clusters for each one of these
databases. The data were standardized before the
clustering methods were applied. The
standardization was done by dimension.
Table 1: Databases used for algorithm evaluation.
Database Patterns Attributes Clusters
Íris
150 4 3
Wine
178 13 3
Pima Indians Diabetes
768 8 2
The Ward Method was applied to the three
databases with the aid of computer software
MatLab2008. In these databases the correct number
of clusters is known, which were provided so the
clusters could be assessed. The dissimilarity
measurement used was the Euclidean distance
because it is the best known of the dissimilarity
measures and because it has been employed in
previous works for all methods used here.
Clustering by SOM, applied to the databases,
was implemented in computer software MatLab2008
PATTERN CLUSTERING USING ANTS COLONY, WARD METHOD AND KOHONEN MAPS
141

and ran 10 times for each database (Villwock, 2009).
The proposed algorithm, based on the basic
algorithm developed by (Deneubourg et al., 1991)
and presented in section 2.1, was implemented with
computer software MatLab2008.
In this algorithm, several proposals for
implementation are presented in Villwock (2009) in
order to clarify it and improve its performance.
Some procedures, although they are the same, are
equally emphasized. There are three main changes,
which are detailed in section 3.1.
For the cluster recovery, the Ward Method was
used and a maximum number of clusters was
defined. It is noteworthy that in Villwock and
Steiner (2008) other methods have been tested, and
the Ward Method showed better results.
As for the evaluation of results, two external
indices were used (Measure F and Random Index)
and percentage of misclassification.
3.1 Proposed Changes to the Ant-based
Clustering
During the study of the Ant-based Clustering, it was
observed that many of the changes in position of
patterns occur unnecessarily. It is considered an
unnecessary change when a pattern is among similar
ones on the grid and, in this case, there is no need to
change this pattern to another position. Aiming to
avoid these unnecessary changes, it was introduced a
comparison of the probability of dropping a pattern
in the position chosen randomly with the probability
of dropping this pattern at its current position. The
pattern is only dropped at the position chosen
randomly if this probability is greater than the
probability of dropping this pattern at its current
position.
The occurrence of fusion of close clusters on the
grid was also observed. When a decision to drop a
pattern is positive and the cell where that pattern
should be dropped is occupied, a free random
position close to this one is searched for. However,
this new position may also be close to another
pattern cluster on the grid. This may be one reason
for the merger of close clusters. As an alternative to
prevent the merger of close clusters on the grid, in
this paper was proposed an assessment of the
probability for the new position. The pattern is only
dropped at the position chosen randomly if this
probability is greater than the probability of
dropping this pattern at its current position. All free
neighboring positions are evaluated. If at no free
neighboring position, the probability of dropping the
pattern is higher than the probability of dropping the
pattern at its current location, the pattern is not
dropped and the process starts again by choosing
another ant.
Another issue observed in the Ant-based
Clustering is that an ant can carry a pattern that is
among similar ones on the grid. An ant only carries a
pattern when it is not among similar ones on the
grid. However, since the ant carries a pattern until it
is drawn to attempt to drop the pattern, changes
occur in this neighborhood and then can it leave it
among the similar ones. Therefore, this ant is
inactive because the operation of dropping the
pattern is not performed. In this case, it was
proposed to replace the pattern picked by an ant, if
this pattern is not dropped in 100 consecutive
iterations. The new pattern was chosen by lot, but it
was only picked by the ant if the probability of
carrying this pattern is greater than 0.13397. This
value was defined by making the pick probability
(P
pick
) equal to the drop probability (P
drop
). If there is
no pattern with a picking probability higher than
0.13397, the ant picks the last pattern drawn. This
could also be a stopping criterion.
3.2 Pseudo-code
I - Initial phase
a)Patterns are randomly scattered on
the grid.
b)Each ant randomly chooses a pattern
to pick and is placed at a random
position on the grid.
II - Distribution phase
a)Each ant is selected randomly. This
ant moves randomly on the grid.
b)The ant probabilistically decides if
it drops its pattern at this position.
The pattern is only dropped at the
position chosen randomly if this
probability is greater than the
probability of dropping this pattern at
its current position.
b1)If the decision is negative, another
ant is selected at random and the
distribution phase starts over again.
b1.1)The pattern carried out by the ant
will be replaced if this pattern is not
dropped after 100 consecutive
iterations. Another pattern is randomly
chosen, but the ant only picks it if
the probability of picking this pattern
is higher than 0.13397, a figure
previously discussed in section 3.1. If
there is no pattern with a picking
probability higher than 0.13397, the
ant picks the last pattern drawn.
ECTA 2011 - International Conference on Evolutionary Computation Theory and Applications
142
b2)If the decision is positive, the ant
drops the pattern at its current
position on the grid, if it is free.
b2.1)If this grid cell is occupied, the
pattern must be dropped at a free
neighboring cell through a random
search.
b2.2)The evaluation of probability of
dropping the pattern at the new
position is made and the pattern is
only dropped at that neighboring cell
if the probability of dropping the
pattern at this position is still
higher than the probability of dropping
this pattern at its current position.
If at no free neighboring position the
probability of dropping the pattern is
higher than the probability of dropping
the pattern at its current location,
the pattern is not dropped and the
process starts again by choosing
another ant.
c)If the ant drops the pattern, so the
ant randomly searches for a new pattern
to pick (among the free patterns), goes
to its position on the grid, evaluates
the neighborhood function and decides
probabilistically whether it picks this
pattern or not.
c1)This choosing process of a free
pattern on the grid runs until the ant
finds a pattern that should be picked.
III - Cluster recovery phase
a)The process begins with each pattern
forming a cluster.
b)After calculating the distances
between all clusters the two clusters
with the shortest distance (these
distances between clusters are defined
in terms of their distance on the grid)
should be merged (connected).
4 DATA ANALYSIS AND
RESULTS
The proposed Clustering algorithm was applied to
three real and public databases listed in Table 1.
Because it is a metaheuristic, this method was
applied to each database 10 times.
To evaluate the results it was used the evaluating
measurements Random Index (R), Measure F and
misclassification percentage. Preliminary results for
the Iris and Wine databases have been published in
(Villwock and Steiner, 2009a, 2009b).
4.1 Results of the Application
of the Proposed Algorithm
to the Databases
Table 2 presents the mean () and the standard
deviation () of the evaluation measurements for the
databases, in addition to measurements to evaluate
the Clustering for the best result.
As can be seen, the results were quite
satisfactory for databases IRIS and WINE (11.9%
and 12.7%, on average, of wrong ratings). As for the
PIMA database, the results were not as good; below
it is shown that the other methods also showed no
satisfactory results for this database.
Table 2: Results of proposed algorithm, averages of
running it 10 times, for real datasets (Iris, Wine and Pima).
Results R F Wrong class. (%)
Iris
0,871 0,877 11,9
0,039 0,050 4,6
best
0,927 0,940 6,0
Wine
0,843 0,871 12,7
0,019 0,021 1,9
best
0,871 0,899 10,1
Pima
0,510 0,583 43,6
0,010 0,022 4,0
best
0,531 0,623 37,5
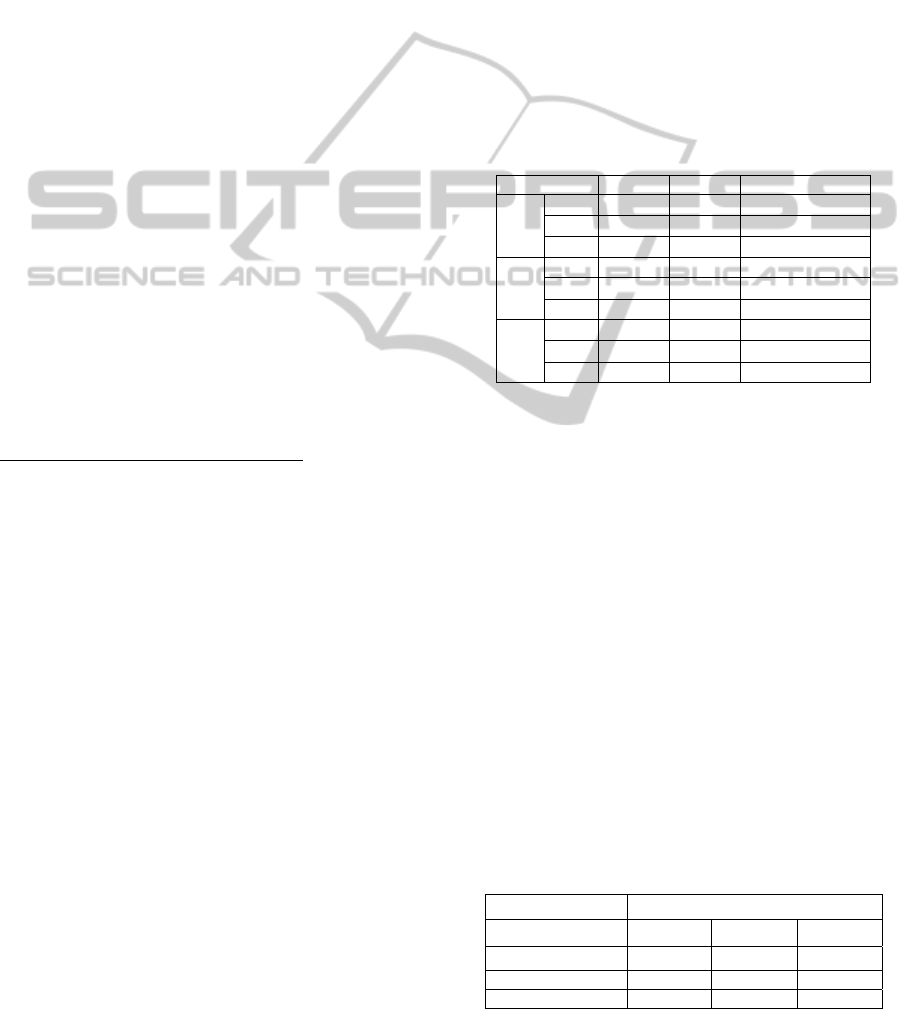
Figures 1 and 2 show the grid for the best result
(whose evaluation measurements are presented in
Table 2) for databases Iris and Wine, respectively.
In these figures, the patterns in red belong to
cluster 1, patterns in black belong to cluster 2 and
patterns in blue belong to cluster 3. It is worthy to
point out that cluster 1 contains all the patterns
assigned to it.
Table 3 (confusion matrix) shows the cluster
distribution for the Iris database, where one can
observe the patterns correctly assigned to clusters
and patterns erroneously assigned to clusters. In this
database there are only nine patterns in wrong
clusters from a total of 150 patterns. Cluster 1
contains all the patterns assigned to it. Similarly,
Table 4 shows the pattern distribution for the Wine
database. In this database there are only 18 patterns
in wrong clusters from a total of 178 patterns.
Table 3: Confusion matrix showing the Pattern
distribution for the IRIS database – best result.
Iris Generated Solution
Correct Clustering Cluster 1 Cluster 2 Cluster 3
Class 1
50 0 0
Class 2
0 48 2
Class 3
0 7 43
PATTERN CLUSTERING USING ANTS COLONY, WARD METHOD AND KOHONEN MAPS
143
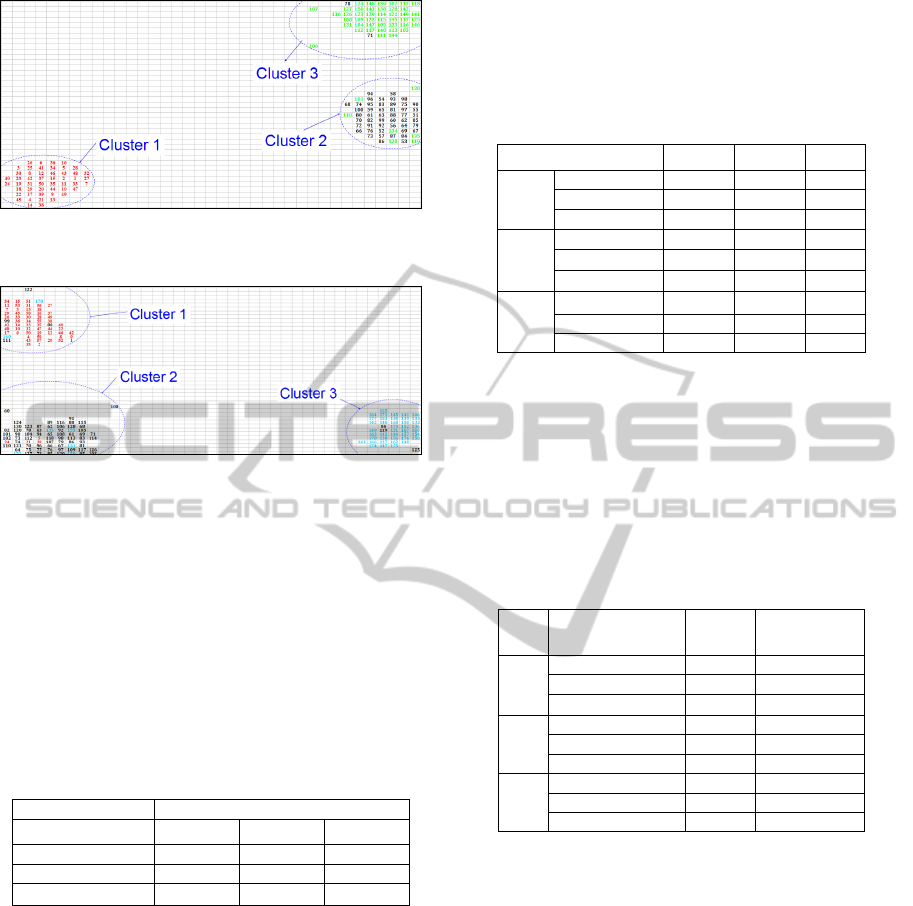
Figure 1: Result of the proposed algorithm for the Iris
database – best result.
Figure 2: Result of the proposed algorithm for the Iris
database – best result.
4.2 Comparison of the Proposed
Algorithm with the other Methods
Table 5 shows the comparisons of average
measurements of assessment for the three methods
(proposed algorithm, Ward and Kohonen) for the
Iris, Wine and Pima databases. The best results are
in bold.
Table 4: Confusion matrix showing the Pattern
distribution for the IRIS database – best result.
Wine Generated Solution
Correct Clustering Cluster 1 Cluster 2 Cluster 3
Class 1
55 4 0
Class 2
4 64 3
Class 3
2 5 41
As can be seen, the results show no superiority of
one method. In the Iris database, the Ward Method
was better (about 3% of errors). In the Wine
database, the proposed algorithm was better (about
12% errors) and in the Pima database, the One-
dimensional Kohonen Networks technique was
better (about 34% errors).
(Handl et al., 2006) also claim that no algorithm
dominates the others forever. According to Ho and
Pepune (2002), according to the “No-Free-Lunch”
theorem, if there is no prior assumption about the
optimization problem one is trying to solve, it is
expected that no strategy has better performance
than others when tested on a large set of databases
with different characteristics.
Table 5: Comparison of average results from the
application of the Ward, SOM and Proposed Algorithm
clustering methods for the Iris, Wine and Pima databases.
Database Ward SOM Ants
Iris
R 0,957
0,863 0,871
F 0,967
0,865 0,877
Wrong Class. 3,333
12,8 11,9
Wine
R
0,819 0,764
0,843
F
0,845 0,761
0,871
Wrong Class.
15,169 22,416
12,7
Pima
R
0,531
0,549
0,510
F
0,624
0,655
0,583
Wrong Class.
37,370
34,570
43,6
Table 6 shows the comparison between the
statistical measures for clustering evaluation for the
proposed algorithm and the ACAM algorithm
proposed by Boryczka (2009). The best results are in
bold and show that the proposed algorithm is better
than the ACAM for two of the three databases.
Table 6: Comparison of average results for the
implementation of the proposed algorithm with results
available in Boryczka (2009) for real databases.
Bases
Assessment
Measurements
ACAM
Proposed
Algorithm
Iris
R
0,819
0,871
F
0,810
0,877
Wrong class.
18,7
11,9
Wine
R 0,849
0,843
F
0,868
0,871
Wrong class.
13,9
12,7
Pima
R 0,522
0,510
F
0,574
0,583
Wrong class. 33,7
43,6
When comparing the mean evaluation
measurements (Table 5), in applying these three
Clustering methods the results showed no
superiority of any of them. (Handl et al., 2006) also
claim that no algorithm dominates the others
forever.
In the comparison of the mean clustering
evaluation measurements (Table 6) through the
proposed algorithm and the ACAM algorithm, the
results show that the first one showed a better
performance for two of the three databases.
For future works it is suggested to use additional
databases for testing, as well as the use of additional
indices for Clustering evaluation.
ECTA 2011 - International Conference on Evolutionary Computation Theory and Applications
144

ACKNOWLEDGEMENTS
To FINEP for the financial support to the research
project CT – INFRA / UFPR / Modeling and
Scientific Computing and to CAPES for the
scholarship awarded to first author.
REFERENCES
Boryczka, U. Finding groups in data: Cluster analysis with
ants. Applied Soft Computing, v. 9, p. 61-70, 2009.
Deneubourg, J.-L., Goss, S., Franks, N., Sendova-Franks,
A., Detrain, C., & Chrétien, L. The dynamics of
collective sorting: Robot-like ants and ant-like robots.
In Proceedings of the First International Conference
on Simulation of Adaptive Behaviour: From Animals
to Animats 1 (pp. 356–365). Cambridge, MA: MIT
Press, 1991.
Dorigo, M., Stützle, T. Ant colony optimization.
Cambridge: MIT Press, 2004.
Handl, J.; Knowles, J.; Dorigo, M. Ant-Based Clustering
and Topographic Mapping. Artificial Life, v. 12, n. 1,
p. 35-61, 2006.
Ho, Y. C., Pepune, D. L. Simple Explanation of the No-
Free-Lunch Theorem and Its Implications. Journal of
Optimization Theory and Applications, v. 115, n. 3, p.
549-570, 2002.
Johnson, R. A., Wichern, D. W. Applied Multivariate
Statistical Analysis. Fourth Edition. New Jersey:
Prentice Hall, 1998.
Kohonen, T. Self-organizing maps. Berlin: Springer
Verlag, 2001.
MATLAB R2008b – The MatWorks, MATLAB
(R2008b), The MathWorks Inc., Natick, 2008.
Tan, P. N., Steinbach, M., Kumar, V. Introduction to Data
Mining. Inc. Boston, MA, USA: Addison-Wesley
Longman Publishing Co., 2005.
Tan, S. C., Ting, K. M., Teng, S. W. Examining
Dissimilarity Scaling in Ant Colony Approaches to
Data Clustering. In: ACAL, 2007. ACAL 2007.
Springer-Verlag, 2007.
Tucci, M., Raugi, M. A Sequential Algorithm for Training
the SOMPrototypes Based on Higher-Order Recursive
Equations. Advances in Artificial Neural Systems, v.
2010, p. 1-10, 2010.
Villwock, R. Técnicas de Agrupamento e de
Hierarquização no Contexto de Kdd – Aplicação a
Dados Temporais de Instrumentação Geotécnica-
Estrutural da Usina Hidrelétrica de Itaipu. 125 f. Tese
(Doutorado em Métodos Numéricos em Engenharia) –
Setor de Ciências Exatas, Universidade Federal do
Paraná, Curitiba, 2009.
Villwock, R.; Steiner, M. T. A. Agrupamento baseado em
Colônia de Formigas: Estudo Comparativo de
Algoritmos para Recuperação dos Grupos. In: XII
Encontro Regional de Matemática Aplicada e
Computacional, Foz do Iguaçú, 2008. XII Encontro
Regional de Matemática Aplicada e Computacional.
Foz do Iguaçú: 2008. CD-ROM.
Villwock, R., Steiner, M. T. A. Análise do Desempenho
do Algoritmo de Agrupamento Baseado em Colônia
de Formigas Modificado. In: XXXII Congresso
Nacional de Matemática Aplicada e Computacional,
Cuiabá, 2009. XXXII Congresso Nacional de
Matemática Aplicada e Computacional. Cuiabá:
SBMAC, 2009a. CD-ROM.
Villwock, R., Steiner, M. T. A. Análise do Desempenho
de um Algoritmo de Agrupamento Modificado
Baseado em Colônia de Formigas. In: XLI Simpósio
Brasileiro de Pesquisa Operacional, Porto Seguro,
2009. XLI Simpósio Brasileiro de Pesquisa
Operacional. Porto Seguro: SOBRAPO, 2009b. CD-
ROM.
Vizine, A. L., de Castro, L. N., Hruschka, E. R., Gudwin,
R. R. Towards improving clustering ants: an adaptive
ant clustering algorithm. Informatica, v. 29, p. 143–
154, 2005.
PATTERN CLUSTERING USING ANTS COLONY, WARD METHOD AND KOHONEN MAPS
145
