
METHODS FOR DISCOVERING AND ANALYSIS
OF REGULARITIES SYSTEMS
Approach based on Optimal Partitioning of Explanatory Variables Space
Senko Oleg
Dorodnicyn Computer Center of Russian Academy of Sciences, Vavilova 40, Moscow, Russia
Kuznetsova Anna
Emanuel Institute of Biochemical Physics of Russian Academy of Sciences, Kosygina 4, Moscow, Russia
Keywords: Empirical regularities, Optimal partitioning, Permutation tests.
Abstract: The goal of discussed Optimal valid partitioning (OVP) method is discovering of regularities describing
effect of explanatory variables on outcome value. OVP method is based on searching partitions of
explanatory variables space with best possible separation of objects with different levels of outcome
variable. Optimal partitions are searched inside several previously defined families by empirical (training)
datasets. Random permutation tests are used for assessment of statistical validity and optimization of used
models complexity. Additional mathematical tools that are aimed at improving performance of OVP
approach are discussed. They include methods for evaluating structure of found regularities systems and
estimating importance of explanatory variables. Paper also represents variant of OVP technique that allows
to compare effects of explanatory variables on outcome in different groups of objects.
1 INTRODUCTION
Assessment of explanatory variables effects on
outcome is one of the most important tasks in many
researches. Various pattern recognition or regression
methods may be used for this purpose. Let note that
the main goal of recognition and regression
techniques is best prediction of
Y
by explanatory
variables. Best forecasting ability may be achieved
for some set of selected informative regressors but
other variables are ignored in corresponding solving
rule. But for many purposes it is interesting to
describe possibly all statistically valid effects of
explanatory variables on
Y
that exist in dataset.
Such task may be partly solved with the help of
statistical tests or ANOVA. However goal of
statistical tests is evaluation of validity of existing
correlations or differences between groups of
observations. So additional tools are needed that
would allow to recover and describe efficiently
statistically valid dependencies.
One of possible approaches is searching such
subregions of explanatory variables space where
levels of dependent variable
Y decline significantly
from
Y
mean in whole dataset or at least in
neighbor subregions. Tasks of this type may be
solved with the help of classification or regression
trees (Breiman et al., 1984) including classification
trees that implement bivariate partitioning
(Lubinsky, 1994; Kim and Loh, 2004) or with the
help of logical regularities techniques (Ryazanov,
2007; Kovshov et al., 2008). Let note that trees
methods usually implement splits that in the best
way improve capability of recognition or
forecasting. At that some alternative splits are
omitted. So search of regularities is not exhaustive.
In present paper Optimal valid partitioning
(OVP) approach is discussed that is aimed at
revealing regularities in datasets that are associated
with effect of variables
1
,,
n
X
X… on outcome
variable
Y
. This approach is based on searching
partitions of explanatory variables space
X
R
with
best possible separation of objects with different
levels of outcome variable
Y (Senko and
Kuznetsova, 1998, 2006, 2009).
423
Oleg S. and Anna K..
METHODS FOR DISCOVERING AND ANALYSIS OF REGULARITIES SYSTEMS - Approach based on Optimal Partitioning of Explanatory Variables
Space.
DOI: 10.5220/0003639104150418
In Proceedings of the International Conference on Knowledge Discovery and Information Retrieval (KDIR-2011), pages 415-418
ISBN: 978-989-8425-79-9
Copyright
c
2011 SCITEPRESS (Science and Technology Publications, Lda.)

2 OPTIMAL VALID
PARTITIONING
Optimal partitions are searched in several previously
defined families by empirical (training) dataset
11
{( , ), ,( , )}
t
mm
Sy y= xx
… , where
i
y is part of
description related to
Y
and x
i
is vector of
explanatory variables for dataset object with number
i. At that optimization is reduced to searching
partition of
X
R
corresponding to maximal value of
quality functional. Two type of partitions models
were considered.
First Type. Families of first type include partitions
that are formed with the help of boundary points or
straight boundary lines. The simplest one-
dimensional family includes all partitions of single
variable range with the help of one boundary point.
Besides there are considered one-dimensional family
with two boundary points, two-dimensional family
with two straight boundary lines that are parallel to
coordinate axes and two-dimensional family with
one straight boundary line that is arbitrarily oriented
relatively coordinate axes.
Second Type. The families of second type include
partitions of that are constructed by previously found
partitions of
t
S
. Partition
1
{, , }
L
qq… of
X
R
is
calculated by partition
1
{, , }
L
ss
… of
t
S
with the
help of following simple rule: point
′
∈
X
xR
is put to
element
i
q if minimal distance between
′
x
and
−x descriptions of objects from
i
s
is less than
corresponding distances for subsets from
1
{, , }\
ri
sss
… ,
1, ,iL= …
. A method for
optimal partitioning searching inside second type
families was discussed in (Dedovets and Senko,
2010).
Quality Functional. Several types of quality
functional may be used. One of them is
2
0
1, ,
)
ˆˆ
({[]}
max
tiLoc
l
iL
F
Syym
=
−=
…
,
where
ˆ
i
y
,
i
m
are mean value of
Y
and number of
objects from
t
S
in partition element
i
q ,
0
ˆ
y
is mean
value of
Y
at
t
S
.
Assessment of statistical validity is based on
resampling procedures that are known as random
permutation test (Ernst, 2004; Abdolell et al., 2002).
Maximal value of quality functional
Q
F
at initial
true dataset is compared with maximal
Q
F
values at
artificial datasets that are generated from initial
dataset by random permutations of
Y
-
values
relatively fixed position of
−x descriptions.
Statistical validity of regularity (p-value) is
estimated as fraction of random permutations for
which maximum of
Q
F
at artificial datasets exceeds
maximum of
Q
F
at initial dataset. Besides functional
Q
F
and p-value additional validity index
Q
P
is used
that is defined as ratio of maximum of
Q
F
that was
achieved at random dataset to maximum of
Q
F
at
initial dataset. In case when deviations between
mean values of
Y
in different elements of optimal
partition are statistically significant such partition is
considered regularity.
For more complicated two-dimensional partitions
families modified version of permutation test is used
that allows to evaluate contribution of each
explanatory variable and to reject regularities with
superfluous complexity. Instead of testing null
hypothesis that
Y
is completely independent on
−
X
variables second variant implement testing of null
hypotheses that
Y
is independent on variables
1
X
and
2
X
inside subregions of
−
X
space related to
simplest one-dimensional regularities that were
previously revealed for these variables.
Contributions of variables
1
X
and
2
X
are described
by p-values
1
p
,
2
p
and indices
1
Q
P
,
2
Q
P
that
correspond to variables
1
X
and
2
X
and are
calculated with the help of same procedure that is
used to calculate p-value and index
Q
P
in case of
initial null hypothesis. At that partition is considered
valid regularity only if both p-values
1
p
and
2
p
are
less than chosen threshold.
3 ANALYSIS OF REGULARITIES
SYSTEMS
Important problems associated with regularities
searching is too large numbers of regularities that
exist in high-dimensional tasks. So some additional
mathematical tools that would allow to simplify
analysis are necessary.
Useful characteristic of regularity system is
importance of each single explanatory variable.
Importance of single variable
X
may be evaluated
KDIR 2011 - International Conference on Knowledge Discovery and Information Retrieval
424

by uni-dimensional regularity corresponding
X
with the help of
Q
P
index. However uni-
dimensional indices often do not give full
description of explanatory variable effect on
Y .
Sometimes explanatory variable contributes
significantly to complicated regularities but there is
no uni-dimensional regularity for it. Importance of
variable
i
X
by complicated regularities system
2
R
may be evaluated as sum of indices describing
contributions of
i
X
to regularities from
2
R
. Let
2
2
=
{}
ij
Rr
is system of two-dimensional regularities
from family III. Index
γ
()
i
X
characterizing
importance of
i
X
may be calculated as sum
22
22
12
γ
∈∈
=+
∑∑
**
(,)()()
ij ji
ij ji
i
QQ
rR rR
X
RPr Pr
.
Experiments with real data demonstrated high
information value of
γ
-indices.
Another approach that allow to asses structure of
found regularities systems is based on evaluating
mutual distances between regularities. At that
distance
12
(, )
f
rrρ between regularities
1
r and
2
r
may be reduced to mean squared deviation between
associated predictors
)
1
(,
Z
rx and )
2
(,
Z
rx :
(
2
))
12
11
(, ) [ , (, ]
f
rr E Z r Z r
Ω
=−ρ xx
.
At that
1
ˆ
(,) ()
i
L
i
i
Zr yI
=
=
∑
xx
, where
{, , }
1
L
qq…
are
subregions of partition associated with regularity
r ,
()
i
I x is indicator function of subregion
i
q ,
ˆ
i
y is
mean value of
Y
in subregion
i
q . Various cluster
analysis methods may be used for revealing clusters
of similar regularities in case distance function
f
ρ
is defined. Main drawback of clusterization
technique is low stability. An alternative method
was suggested that allows to select from system
subset of regularities
B
R
with possibly great mutual
distances. At that predictors from associated set of
B
Z
has possibly best forecasting ability. It was
shown (Kostomarova, I. et al., 2010) that searching
of optimal
B
Z
may be reduced to selecting set of
regularities with minimal squared error of collective
predictor
1
1
ˆ
L
L
i
i
av
Z
Z=
=
∑
.
4 DIFFERENCE BETWEEN
EFFECTS IN GROUPS
In some applications it is important to estimate
difference between explanatory variables effects on
Y
in two different groups of objects. For example
influence of gene on disease severity may be
evaluated by comparing of regularities that tie
severity and corresponding levels of clinical,
biochemical or genetic indicators in two groups of
patients with different variants of gene. Let
difference between effects of explanatory variables
on
Y
in groups
A
S
and
B
S
is evaluated. A method
was developed that includes searching of optimal
partition
1
{,,}
AA
L
qq…
by group
A
S
. Then difference
between
A
S
and
B
S
is evaluated with the help of
functional
2
1
Δ
=
=−
∑
ˆˆ
(, , ) {[ ( ) ( )] ( ), ( )}
AB
L
ii ii
AB A B
Q
i
F qS S yS yS mS mS
,
where
*
()
i
mS
is number of objects from
A
i
q
in
*
S
,
*
ˆ
()
l
y
S
is mean of
Y
by objects from
A
i
q in
*
S
. The
same variants of permutation tests that were used in
previous main version of OVP technique may be
also used for comparing of two sets of regularities.
Pairs of artificial datasets
(,)
rr
A
B
SS
are generated
from
A
S
and
B
S
by random permutations
of
Y
values relatively fixed position of
−
x descriptions. Then again optimal partitions are
found by
r
A
S
and functional
Δ
Q
F is calculated by
(,)
rr
A
B
SS
. Values of functional
Δ
Q
F calculated by
(,)
rr
A
B
SS
are compared with
Δ
Q
F value for initial
pair
(,)
A
B
SS
and p-values are evaluated as fractions
of
(,)
rr
A
B
SS
pairs, for which
Δ
Q
F value exceeds
Δ
Q
F
value that was calculated for pair
(,)
A
B
SS
.
The described method was used in task of
evaluating influence of genetic factors on
discirculatory encephalopathy (DEP) severity
(Kostomarova et al., 2011). Deviations between
effects of explanatory variables on DEP severity in
groups of patients with different variants of gene
coding angiotensin-converting enzyme (ACE) were
analyzed. In this study
Y
was binary variable
indicating to what stage of severity was attributed
each case of DEP by method of computer
diagnostics.
METHODS FOR DISCOVERING AND ANALYSIS OF REGULARITIES SYSTEMS - Approach based on Optimal
Partitioning of Explanatory Variables Space
425
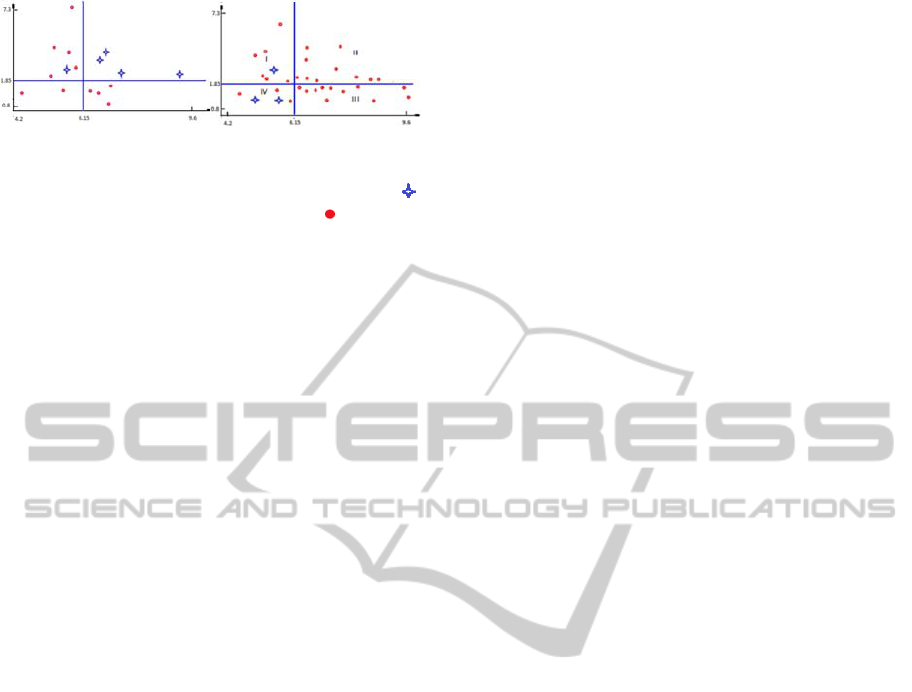
Figure 1: At the left part of figure regularity for Axis X
corresponds containment of cholesterol in blood
(mmmol/l), Y- containment of thyrocsyn (mmol/l) -
case with calculated third stage of severity,
- case with
calculated first stage of severity.
At the left side of figure regularity is represented
that ties calculated DE severity and two
abovementioned explanatory variables in group
dd
S
and at the right side
id
S
group empirical distribution
is represented for the same pair of explanatory
variables. It is seen that quadrant II at left part of
figure contains 4 cases with calculated third severity
stage and the same quadrant II at right part of figure
contains 10 cases with calculated first severity stage.
Statistical validity of difference between
distributions represented al left and right parts of
figure was evaluated at p<0.01 with the help of
permutation test using functional
Q
F
Δ
.
5 CONCLUSIONS
Thus new techniques were represented that are
aimed at improving performance of OVP method.
The represented methods allow to asses structure of
regularities systems in high-dimensional tasks and to
estimate contribution of each single variable. Also
variant of OVP method was discussed that allows to
compare effects of explanatory variables on outcome
in different groups of objects. An example
concerning using of this technique in clinical and
genetic researches was considered. The represented
methods may be used in various data analysis tasks.
ACKNOWLEDGEMENTS
The research was supported by Russian Fond of
Basic Researches grant 11-07-0715. We thanks Irina
Kostomarova and Natalia Malygina for biomedical
problems statement and useful discussions.
REFERENCES
Abdolell, M., LeBlanc, M., Stephens, D., Harrison, R. V.,
2002. Binary partitioning for continuous longitudinal
data: categorizing a prognostic variable. In Statistics in
Medicine, 21:3395-3409.
Breiman, L., Friedman, J. H., Olshen, R. A. and Stone, C.
J., 1984. Classification and Regression Trees,
Chapman & Hall, New York
Dedovets M, Senko O., 2010. The Algorithm Based on
Metric Regularities. In International Journal
“Information Theories and Applications”, Vol. 17,
Number 1, 27-29.
Ernst, M. J., 2004. Permutation methods: A basis for exact
inference. In Statistical Science, 19: 676-685.
Kim, H., Loh, W. Y., 2003. Classification Trees with
Bivariate Linear Discriminant Node Models, In
Journal of Computational and Graphical Statistics,
12: 512–530.
Kostomarova, I., Kuznetsova, A., Malygina, N., Senko,
O., 2010. Methods for evaluating of regularities
systems structure. In New Trends in Classification and
Data Mining, ITHEA, Sofia, Bulgaria, 40-46.
Kostomarova, I., Kuznetsova, A., Malygina, N., Senko,
O., 2011. Method for evaluating discrepancy between
regularities systems in different groups. In
International Journal "Information Technologies &
Knowledge" Vol.5, Number 1, 46-53
Kovshov, V. V., Moiseev, V. L., Ryazanov, V. V., 2008.
Algorithms for finding Logical Regularities in Pattern
Recognition. In Computational mathematics and
Mathematical Physics, 48: 314-328.
Ryazanov, V. V., 2007. Logical Regularities in Pattern
Recognition (parametric approach). In Computational
mathematics and Mathematical Physics, 47: 1793-
1808.
Sen’ko, O. V., Kuznetsova, A. V., 1998. The use of
partitions constructions for stochastic dependencies
approximation. In Proceedings of the International
conference on systems and signals in intelligent
technologies. Minsk (Belarus), 291-297.
Sen’ko, O. V., Kuznetsova, A. V., 2006. The Optimal
Valid Partitioning Procedures. In Statistics on the
Internet http://statjournals.net/
Senko, O. V., Kuznetsova A. V. 2009. Methods of
Regularities Searching Based on Optimal Partitioning.
In International Book Series “Information Science and
Computing”, N 8, Classification, Forecasting, Data
Mining, ITHEA, Sofia, 136-141
KDIR 2011 - International Conference on Knowledge Discovery and Information Retrieval
426
