
A NEW DEVELOPMENT DESIGN CAE EMPLOYMENT MODEL
Applying Numerical Simulation to Automobile Bottleneck Technology
Kakuro Amasaka
College of Science and Engineering, Aoyama Gakuin University, Kanagawa-ken, Japan
Keywords: New Development Design CAE Employment Model, Numerical simulation, Automobile bottleneck
technology, Transaxle oil seal leakage simulation.
Abstract: With the rapid move towards global production, it has become increasingly critical for manufacturers to
drastically cut back on the time it takes to move a product from design to production while ensuring quality.
This research addresses the necessity reforming the business processes associated with development design
in particular, proposing a “New Development Design CAE Employment Model” using four core models:
the “Highly Reliable CAE Analysis Technology Component Model”, the “Highly Precise CAE Analysis
Model”, the “Total QA High Cyclization Business Process Model”, and the “Intellectual Customer Data
Collection/Analysis Integrated Model” that takes manufacturers away from conventional preproduction and
prototype testing methods and towards a better predictive evaluation method. The effectiveness of the model
is verified by successfully applying it to the technological problem “automotive transaxle oil seal leakage”
of development design bottlenecks at auto manufacturers.
1 INTRODUCTION
This research focuses on reforming the business
processes associated with development design, one
of the critical components of manufacturing with the
rapid move towards global production. In recent
years, the author has been looking to move away
from the repeated trial-and-error–based
preproduction and prototype testing traditionally
practiced in the development design process
(conventional prototype testing methods) and
towards more predictive evaluation methods. To
achieve this aim, the author created a “New
Development Design CAE Employment Model” that
will shorten development times and help
manufacturers simultaneously achieve optimum
quality, cost, and delivery (QCD).
The author has created four core models that
make up the new CAE model: the “Highly Reliable
CAE Analysis Technology Component Model”, the
“Highly Precise CAE Analysis Model”, the “Total
QA High Cyclization Business Process Model”, and
the “Intellectual Customer Data Collection/Analysis
Integrated Model”. Statistical science was used to
organically and intelligently put these models to
work, and they were successfully employed in
resolving the technological problem “automotive
transaxle oil seal leakage” of development design
bottlenecks at auto manufacturers by utilizing the
“Highly Assurance CAE Analysis Model”, the “Oil
Seal Simulator”, the “CAE Qualitative Model”,
CAE analysis (2D and 3D), and quality
improvement. The “New Development Design
CAE Employment Model” was then applied to
similar technical problems, where its effectiveness
was verified.
2 CAE IN DEVELOPMENT
DESIGN – APPLICATION AND
ISSUES
The time between product design and production has
been drastically shortened in recent years with the
rapid spread of global production. Quality assurance,
or QA, has become increasingly critical, making it
essential that the development design process—a
critical component of QA—be reformed to ensure
quality (Kume, 1999: Amasaka, 2010a). Figure 1
shows the typical product development design
process currently used by many companies
(Amasaka, Ed., 2007a). The figure shows that
companies first create product development design
114
Amasaka K..
A NEW DEVELOPMENT DESIGN CAE EMPLOYMENT MODEL - Applying Numerical Simulation to Automobile Bottleneck Technology.
DOI: 10.5220/0003637201140124
In Proceedings of the International Conference on Evolutionary Computation Theory and Applications (ECTA-2011), pages 114-124
ISBN: 978-989-8425-83-6
Copyright
c
2011 SCITEPRESS (Science and Technology Publications, Lda.)
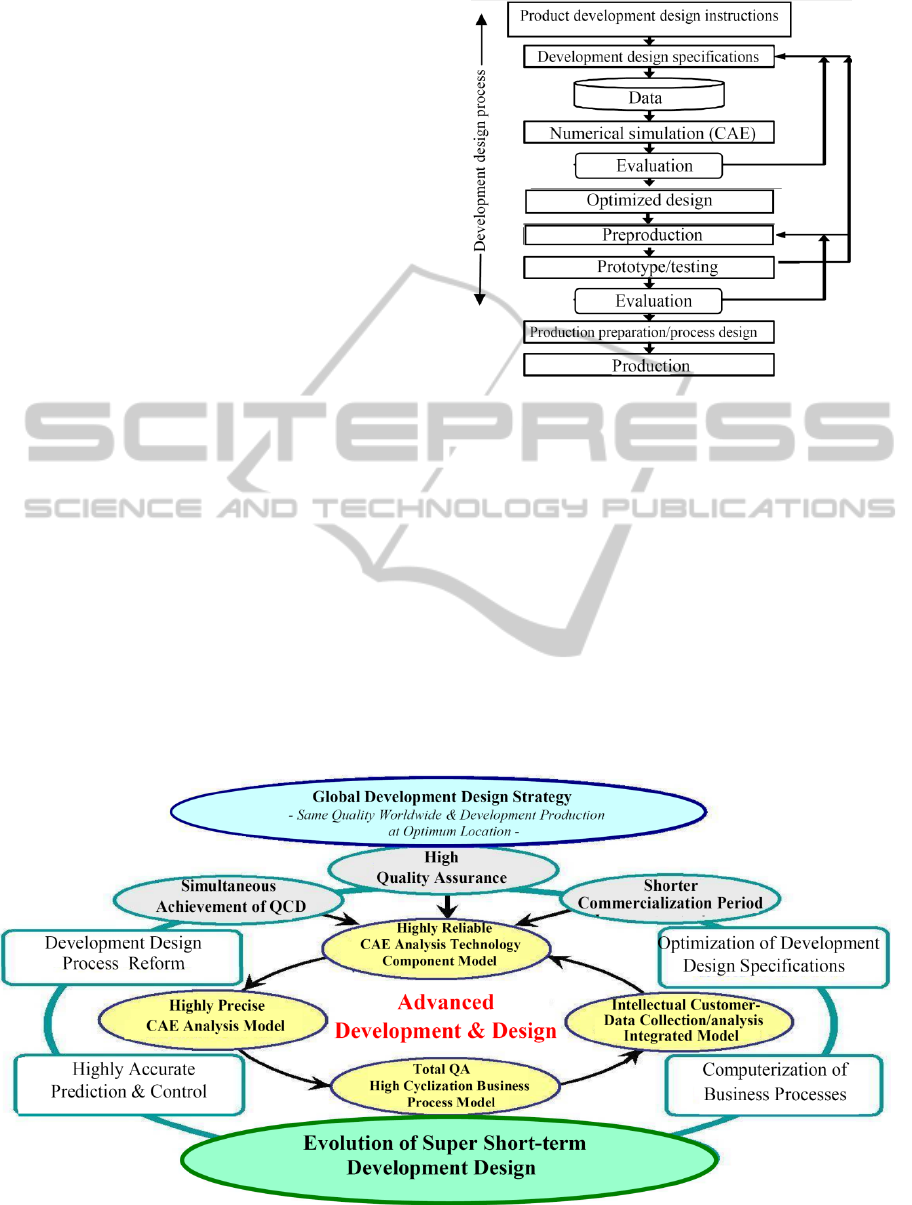
instructions based on market research and planning.
They then use these instructions to make specific
development design specifications (drawings) and to
promptly convert them to digital format so that they
can be suitably processed and applied. The data is
primarily used in numerical simulations known as
computer-aided engineering, or CAE.
CAE and other numerical simulations have been
applied to a wide variety of business processes in
recent years, including research and development,
design, preproduction and testing/evaluations,
production technology, production preparation, and
manufacturing. These and other applications are
expected to have effective results (Magoshi, et al.,
2003:Leo, et al., 2004: Amasaka, 2010a). In this age
of global quality competition, using CAE for
predictive evaluation method in design work is
expected to contribute a great deal to shortening
development design time and improving quality
(Amasaka, 2007, 2008, 2010b). However, in the
case of automotive production, much of the
development design process is guided by unspoken
experiential knowledge and rules of thumb, leading
to prototype testing guided by repeated trial-and-
error efforts; in other words, a series of
improvements based on conventional prototype
testing methods. This not only draws out the
development design process, but also results in
enormous testing costs.
Previous forms of CAE analysis were not
sufficiently precise, yielding figures that deviated as
much as 10–30% from prototype testing evaluations
(absolute values). This meant that CAE was hardly
Figure 1: CAE in the development design process.
reliable enough to be an adequate substitute for
prototype testing (Amasaka, 2007, 2008). As a
result, manufacturers were not able to cut out
preproduction and prototype testing (a necessity for
shortening development design time) despite the
enormous amount of funds they invested in CAE
development. This means that many companies are
now stuck with applying CAE only to the
monitoring task of comparative evaluations of old
and new products.
The only way get CAE analysis to function at a
sufficient level and firmly establish it as part of (1)
preventing recurrence of the pressing technical
problem of bottlenecking and (2) the development
Figure 2: New Development Design CAE Employment Model.
A NEW DEVELOPMENT DESIGN CAE EMPLOYMENT MODEL - Applying Numerical Simulation to Automobile
Bottleneck Technology
115
design process for new products, is to make it more
precise. Specifically, this means setting up highly
reliable CAE analysis that reduce the deviation, or
gap, with prototype testing evaluations (absolute
values) to 5% or less (Amasaka, 2008, 2010b).
3 CONSTRUCTING A NEW
DEVELOPMENT DESIGN CAE
EMPLOYING MODEL
The author has created the “New Development
Design CAE Employment Model” for the advanced
development and design shown in Figure 2 as a way
of overcoming these pressing problems in
development design. As the figure shows, technical
issues that must be resolved by development design
departments include development design process
reform, design process reform, high accuracy of the
prediction and control, computerization of business
process, and optimization of development design
specifications.
In terms of a methodology for resolving these
issues, the author has created four core models: the
“High Reliable CAE Analysis Technology
Component Model”, the “Highly Precise CAE
Analysis Model”, the “Total QA High Cyclization
Business Process Model”, and the “Intellectual
Customer Data Collection/Analysis Integrated
System”. The organically integrated and intelligent
application of these four models is essential. An
overview of each is given below.
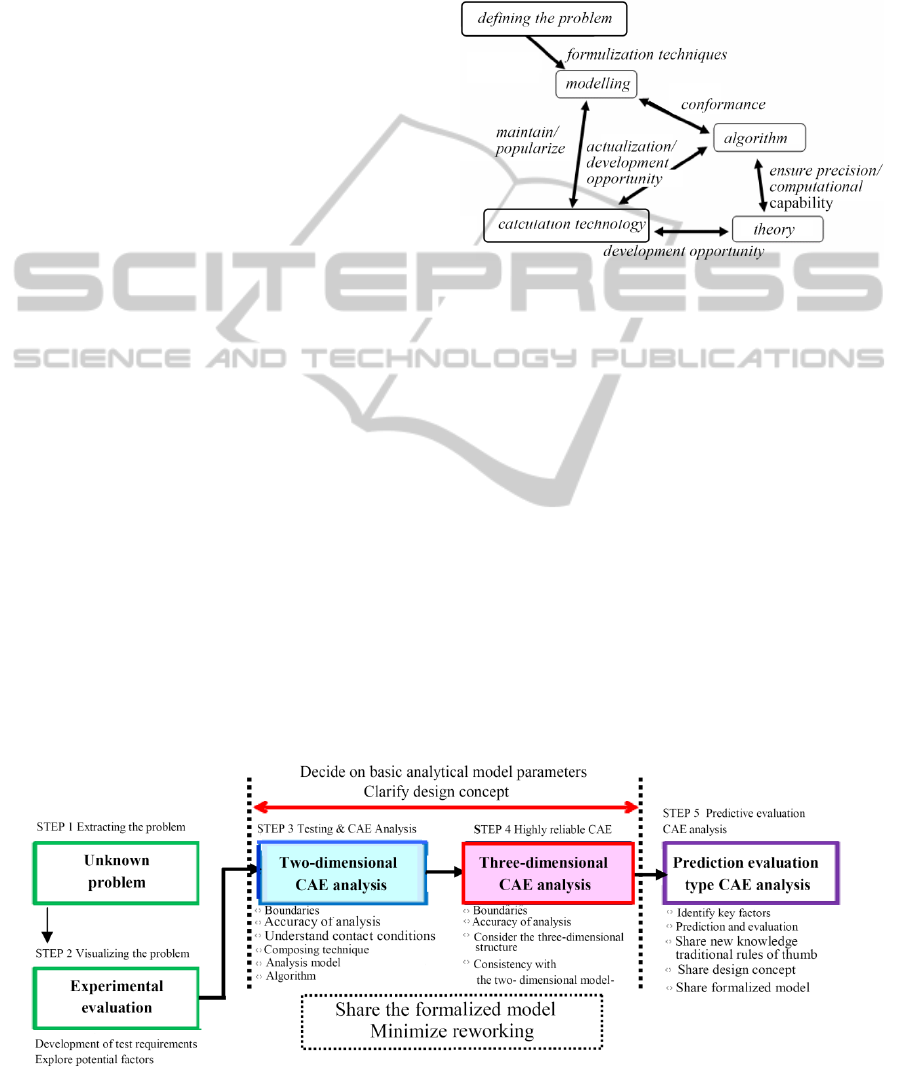
3.1 The Highly Reliable CAE Analysis
Technology Component Model
The Highly Reliable CAE Analysis Technology
Component Model (problem-model-algorithm-
theory-computer) shown in Figure 3 was designed to
make the shift from conventional prototype testing
methods to effectively applying CAE in predictive
evaluation methods. The comprehensive issuance of
this model is essential to achieving the desired shift.
(Amasaka, Ed., 2007b: Amasaka, 2008, 2010b).
Figure 3: Highly Reliable CAE Analysis Technology
Component Model.
More specifically, the critical aspects of this
model include (i) Defining the problem (physically
checking the actual item) in order to clarify the
mechanism of the defect, using visualization
technology to identify the dynamic behavior of the
technical issue; (ii) full use of formulization
techniques to generate logical modeling (statistical
calculations, model application); (iii) constructing
compatible algorithms (calculation methods); (iv)
developing theories (establishing theories required to
clarify problems) that ensure the precision of
numerical calculations and sufficient computational
capability; and (v) comprehensively putting the
above processes in action using computer (selection
of calculation technology).
Figure 4: Highly Reliable CAE Analysis Model.
ECTA 2011 - International Conference on Evolutionary Computation Theory and Applications
116
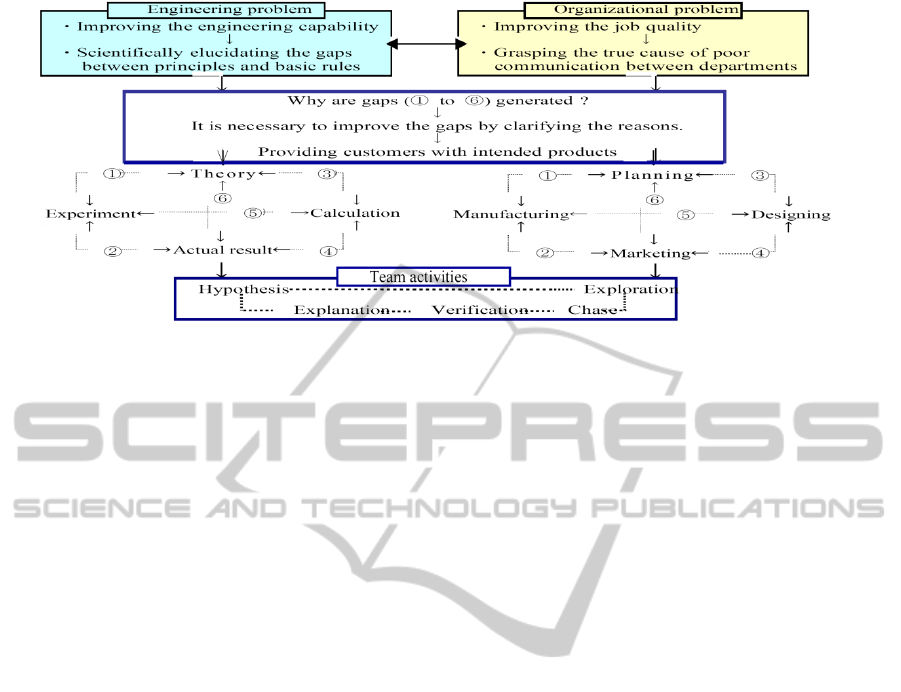
Figure 5: Total QA hight Cyclization Business Process System.
3.2 The Highly Precise CAE Analysis
Model
In order to minimize discrepancies in results
obtained from testing of actual products and CAE, it
is necessary to properly formalize the expertise of
the many technical analysts required for CAE
analysis.
To achieve this, the author (Amasaka, 2008:
Takahashi, et al., 2010) proposes the use of the
Highly Precise CAE Analysis Model shown in
Figure 4 to enable highly precise absolute analysis.
Functional failures are a recurring cause of
market claims in automotive development design,
making it necessary to clarify relevant technical
issues such as the reasons and mechanisms by which
such failures occur. This should be done according
to the following steps.
STEP 1 Extracting the problem: Investigate and
analyze the causal relationships that become
apparent and infer the mechanisms through which
failures occur, employing the latest “statistical
science methods” backed up by expertise
accumulated through the cooperative efforts of
internal and external specialists (Amasaka, 2003).
STEP 2 Visualizing the problem: Test actual
products demonstrating the failure mechanisms to
visualize the dynamic behavior of the problem. In
order to accurately analyze the failure and its causes,
it is necessary to uncover any underlying factors that
were not evident from previous findings and may
have been overlooked. A logical reasoning process
must be applied to demonstrate the mechanisms of
the failure, employing tools and principles such as
statistical science methods.
STEP 3 Testing & CAE analysis: Consolidate
the findings and apply statistical simulation to create
a two-dimensional model integrated on a qualitative
level where the visualization produced through
actual testing can be reproduced. When creating this
two-dimensional model, it is necessary to conduct
tests to produce a model (qualitative modeling) of
the causal relationships involved in undefined failure
mechanisms. Precise calculation methods, analysis
models and algorithms must be properly selected in
order to clarify boundary conditions and contact
situations, as well as to enable highly accurate
statistical simulation. It is essential to use such tools
to minimize discrepancies between actual testing
and CAE absolute evaluation. The findings from
such analysis should then be used for more detailed
three-dimensional analysis.
STEP 4 Highly reliable CAE: Conduct accurate
testing of actual products based on the findings from
STEP 3 to gain a more explicit understanding of the
failure mechanisms. Consolidate the findings from
the processes involved and conduct statistical
simulation (quantitative modeling) with a high level
of credibility to enable the prediction and control of
absolute values.
STEP 5 Predictive evaluation CAE analysis: In
this final step, identify the primary factors from the
results of the statistical simulation in STEP 4 to be
used for prediction and evaluation. The new findings
obtained, design concepts, and formulation models
should be shared and disseminated. Utilizing models
with a higher level of analytic accuracy enables
manufacturers to move from relative evaluation to
absolute evaluation of analysis results in the actual
development process. The authors believe that this
will lead to the future establishment of design
frameworks involving predictive evaluation.
A NEW DEVELOPMENT DESIGN CAE EMPLOYMENT MODEL - Applying Numerical Simulation to Automobile
Bottleneck Technology
117
3.3 Total QA High Cyclization
Business Process Model
As the first step, the author proposes the
development design business process model. This
model is created from the standpoint of
Verification/Validation (divergence of CAE from
theory and divergence of CAE from testing) in order
to make highly reliable CAE analysis that is
consistent with the market testing theory profile
possible. The author (Amasaka, 2008) therefore
recommends the introduction and utilization of the
Total QA (Quality Assurance) High Cyclization
Business Process System, which systematically and
strategically realizes high quality assurance by
incorporating analyses made via the core
technologies of Science SQC (Amasaka, 2004) as
shown in Figure 5. For example, in order to solve
the pending issue of a technology problem in the
market, it is necessary to create a universal solution
(general solution) by clarifying the existing six gaps
(1 to 6 in the figure below) in the process consisting
of theory (technological design model), experiment
(prototype to production), calculation (simulation),
and actual result (market) as shown on the lower left
of Figure 5 below.
To accomplish this, the clarification of the six
gaps (1 to 6) in the business processes across the
divisions, shown in the lower right of Figure 5
below, is of primary importance. By taking these
steps, the intelligent technical information owned by
the related divisions inside and outside the
corporation will be fully linked, thus reforming the
business processes involved in development design.
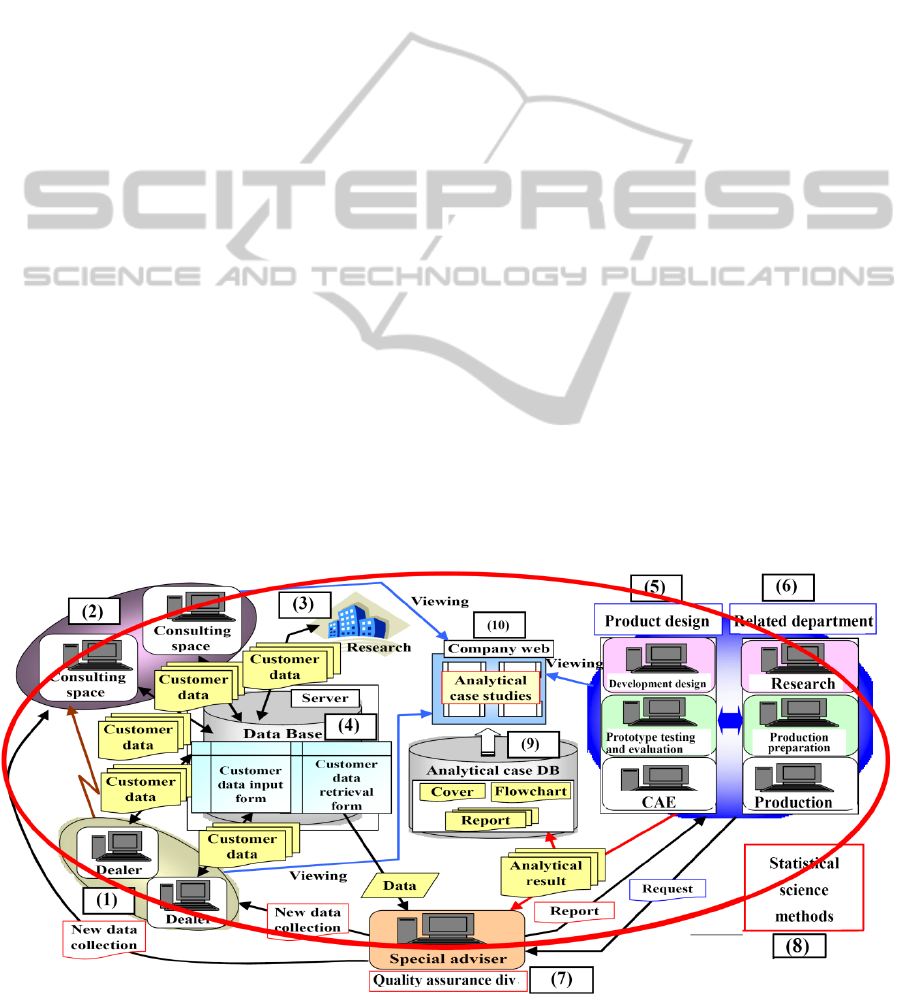
3.4 The Intellectual Customer Data
Collection/Analysis Integrated
Model
Collecting, organizing, and analyzing different types
of technical information is a critical part of the
development design process. For this reason, it is
important that manufacturers set up a comprehensive
networking system that makes full use of digital
engineering and information technology, allowing
them to collect and analyze customer information in
real time. Figure 6 shows the Intellectual Customer
Data Collection/Analysis Integrated Model
developed by the author (Amasaka, 2004, 2005a,
2010a), which uses the Total Technical Intelligence
System (TTIS) and the Customer Science Utilizing
Customer Information Analysis and Navigation
System (CS-CIANS)—two of the core methods of
Science SQC.
As indicated in the figure, the system allows
companies to collect customer data from (1)
domestic and overseas dealers and (2) consulting
spaces as well as (3) customer quality information in
real time from research firms and the like using (4)
customer data input forms and customer data
retrieval forms. This information is then stored in a
searchable database. The system then uses a
company web that allows (5) divisions involved in
product design and (6) other related divisions to
obtain customer data and analyze it from multiple
angles.
This enables the partnering of preproduction,
testing/evaluation, and numerical simulations
(CAE), and further strengthens mutual collaboration
Figure 6: Intellectual Customer Data Collection/Analysis Integrated System.
ECTA 2011 - International Conference on Evolutionary Computation Theory and Applications
118
between related divisions and (7) the special advisor
in the quality assurance division. Customer data is
analyzed making full use of (8) statistical science
methods, which allows optimization of development
design specifications in real time, and then (9)
recorded in a database of analytical cases.
Additional analysis results are recorded as (10)
analytical case studies, where they can be viewed
using the company web and used by related
departments as technical assets. The next chapter
presents some application examples where these
core models were put to work in a comprehensive
way. The case examples verify the effectiveness of
the New Development Design CAE Deployment
Model created by the author.
4 APPLICATION
This chapter presents the case of automotive
transaxle oil seal leakage, a technical reliability
problem that generates bottlenecks for auto
manufacturers around the world. The author applied
his New Development Design CAE Employment
Model to resolve this issue. The model was then
applied to similar technical problems, where its
effectiveness was verified.
4.1 Automotive Transaxle Oil Seal
Leakage
The key to resolving problems where the faulty
mechanism is unclear is to use an empirical
approach and apply technology that allows
visualization of the dynamic behavior at the moment
the problem occurs. The structure of the problem
must then be unraveled so that an accurate model of
cause-and-effect relationships can be built. To
achieve this, the authors (Amasaka, 2004, 2005b,
2008, 2010b: Amasaka, Ed., 2007b: Ito, et al, 2010a,
2010b) applied the following analytical process: (1)
understand the phenomenon, (2) conduct a
visualization experiment, (3) conceptualize the
problem logically, (4) apply CAE analysis, and (5)
optimize the design. The result was a plan to resolve
oil leaks caused by age-related wear to the transaxle
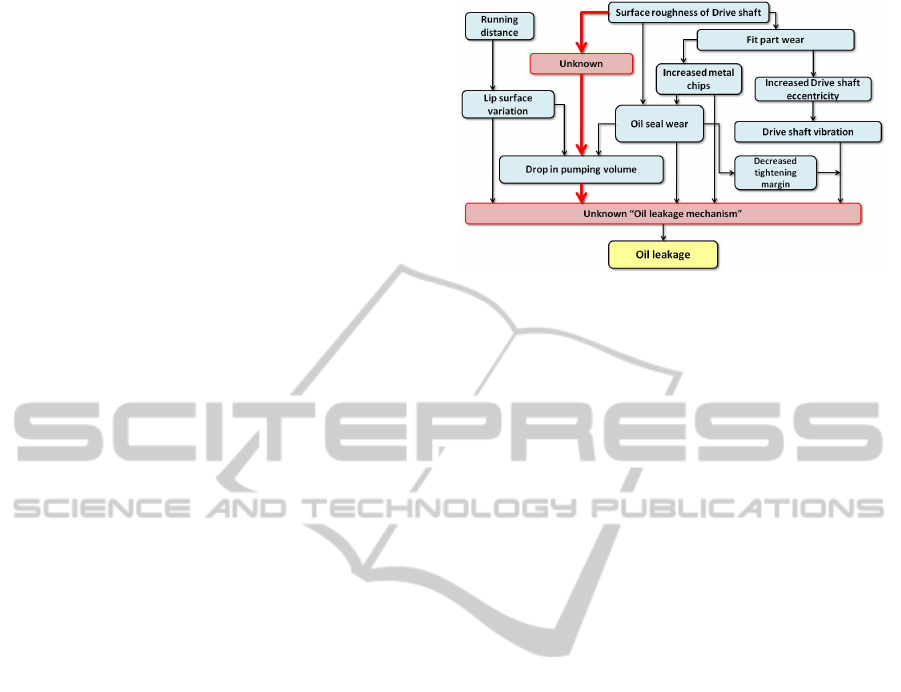
oil seal lip.Figure 7 uses a relational diagram to
organize related causes and knowledge previously
collected on the problem. Because the mechanism
causing the oil leak was unknown, the pathway by
which it was generated is not clearly shown. Areas
of dynamic behavior that needed to be visualized
were specified and tested using a visualization
device.
Figure 7: Estimation of the Oil leakage mechanism.
4.1.1 Highly Accurate CAE Analysis Model
Using Science SQC Approach
The problem is an unknown mechanism causing an
oil seal leakage on the surface of the drive shaft
during high-speed rotation (Lopez, et al., 1997).
Now, the authors will discuss the application of
highly accurate CAE analysis for drive train oil seal
leaks through a partnership between company C
(automotive assembly company) and company D
(parts supply company) as an example of cases
where the mechanism of technical problems is
unknown. As shown in Figure 8, the authors applied
an optimal CAE design approach to prevent
automobile oil seal leaks, incorporating Science
SQC approach methods.
As the figure shows, the authors contributed to
solving the problem of drive train oil seal leaks,
which is a bottleneck technological problem for
automotive manufacturers worldwide. This was
achieved through an analysis process involving
problem clarification, visualization experiments,
theoretical conceptualization, CAE analysis, and
optimal design. First, the authors began by
developing a device for visualizing the ascertained
phenomena in order to estimate the unknown
mechanisms involved in the leaks. This made it
possible to estimate the mechanism of the oil seal
leaks by visualizing the dynamic behavior involved
in the process whereby metal particles (foreign
matter) from gear rotation wear, found around the
rotating and sliding portions of the oil seal lip,
become mechanically fused and accumulate.
Next, the findings obtained were used to
formulate the following design countermeasures.
(i) Strengthen gear surfaces to prevent
occurrence of foreign matter even after 100,000 km
(improve quality of materials and heat treatments)
(ii) Formulate a design plan to scientifically
ensure optimum lubrication of the surface layer of
A NEW DEVELOPMENT DESIGN CAE EMPLOYMENT MODEL - Applying Numerical Simulation to Automobile
Bottleneck Technology
119
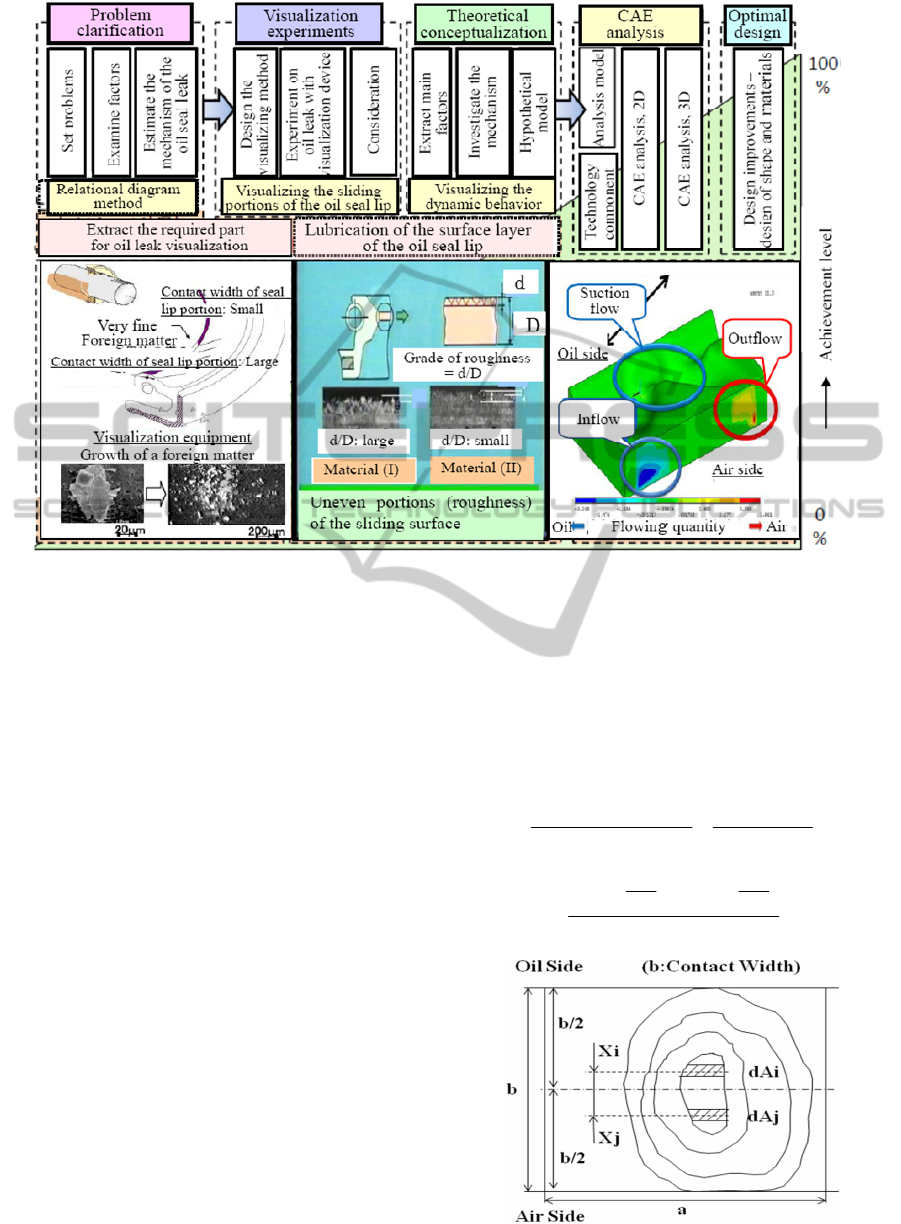
Figure 8: Highly Accurate CAE Analysis Model using Science SQC approach.
the oil seal lip (uneven portions of the sliding
surface) where it rotates in contact with the drive
shaft.
4.1.2 Sliding Surface Visualization
Experiment
The sliding side observation experiment was
conducted using three types of seals made of
different materials and shapes. Here, two seal
characteristic values are defined: (1) XG and (2) AR
as shown in Figure 9. XG is the distance that the true
contact area center of gravity is biased from the
sliding side center to either the oil side (1>XG>0) or
the atmospheric side (-1<XG<0); it is the
characteristic value that shows the extent true
contact area distribution bias axially. XG can be
interpreted as the maximum pressure position of the
contact pressure distribution. AR is a characteristic
value indicating roughness on the seal sliding side
level, and shows the proportion of the visible touch
area that is the real contact area.
Table 1 shows the characteristic seal values and
the outcome of the experiments for the three types.
In addition, leakage stopping can be classified
according to both characteristic values by looking at
the relationship between these two characteristic
values and the observed state of the leakage stopping
shown in Table 1. Sealing is achieved only in Seal 1
in the table, and sliding surfaces show the
characteristic values XG>0 and AR<0.05 (5%). It is
evident that the unique sliding side structure to
ensure sealing has minute surface roughness
(existence of minute projections) and the true
contact area is biased towards the oil side (Sato et
al., 1999: Kameike et al., 2000).
(1)
(2)
Figure 9: Pattern Diagram of the Sliding Side.
()
()
ba
A
R
×
==
area Shaded
area touch visibleThe
areacontact real The
∑∑
∑∑
+
⎟
⎠
⎞
⎜
⎝
⎛
−
⎟
⎠
⎞
⎜
⎝
⎛
=
dAjdAi
b
Xj
dAj
b
Xi
dAi
X
G
2/2/
ECTA 2011 - International Conference on Evolutionary Computation Theory and Applications
120
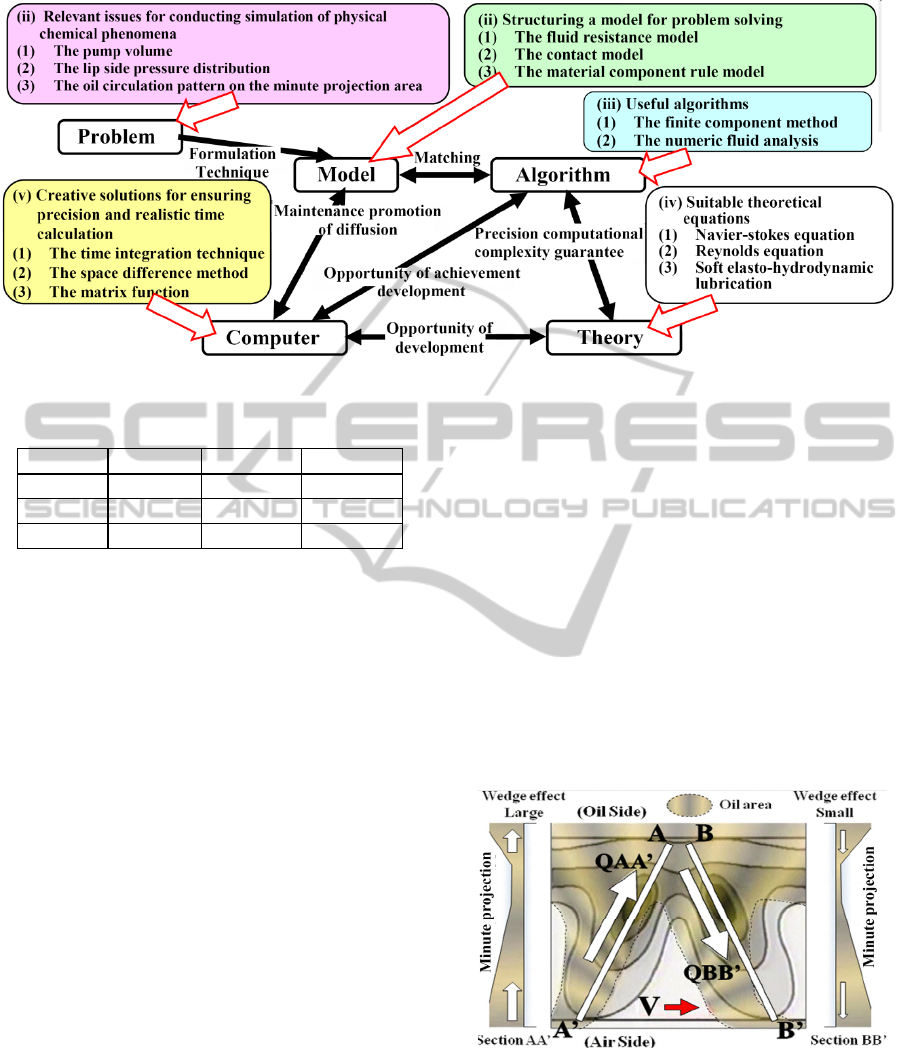
Figure 10. Technology Component Model of the “Oil Seal Simulator”.
Table 1: Outcome of the Experiments.
Type 1 Type 2 Type 3
X
G
0.02 0.47 0.04
A
R
0.14 0.05 -0.21
result Sealing Leakage Leakage
4.1.3 Technological Component Model of
the Oil Seal Simulator
In order to conduct a numerical analysis based on
the knowledge gained from the visualization
experiment, it is necessary to select the kinds of
technological elements involved. Appropriate
selection of technological elements (defining the
problem, modeling, algorithms, theory, and
computer technology) is a critical part of generating
highly reliable CAE analysis results.
Organically linking these technological elements
is what will make the CAE analysis a success.
The authors thus added the needed technological
component to the “Oil Seal Simulator” as shown in
Figure 10. In addressing the oil leakage
phenomenon, the problem is understanding the
pump volume and lip side pressure distribution that
directs the behavior and the oil circulation pattern on
the minute projection area of sliding surfaces. The
fluid resistance model, the contact model, and the
material component rule model were used to solve
these problems. The finite element method and
numeric fluid were analyzed as a convenient
algorithm. The Reynolds equation, Soft Elasto-
Hydrodynamic Lubrication, and Navier-Stokes
equation were appropriate theoretical formulas.
Accuracy is ensured, and the time integration
method, space difference method, and procession
method were the computer technologies used to
perform calculations in a realistic timeframe. Each
of the above elements was used to construct the oil
seal simulator.
4.1.4 CAE Qualitative Model of the Basic
Oil Seal Lip Structure
The visualization experiment yielded the conditions
on the sliding surface of the oil seal lip as a basic
structural element. The authors then used this
element to construct the CAE qualitative model of
the basic oil seal lip structure shown in Figure 11 in
order to demonstrate sealing conditions. The model
uses a statistical approximation of the slight
roughness on the sliding surface to show the wedge
effect created by minute projections.
Figure 11: CAE Qualitative Model of the Basic Oil Seal
Lip Structure.
In looking at seal conditions on the sliding
surfaces as a whole, the authors concluded that the
volume of inflow was greater at QAA’ than the
outflow at QBB’, based on the fact that minute
projections in section AA’ created a larger wedge
A NEW DEVELOPMENT DESIGN CAE EMPLOYMENT MODEL - Applying Numerical Simulation to Automobile
Bottleneck Technology
121
effect than the minute projections in section BB’.
These conditions also generated the oil circulation
pattern on the minute projection area of sliding
surfaces, which meant that wear could be prevented
by separating the two surfaces (Sato, et al., 1999:
Kameike, et al., 2000: Dong, et al., 2011).
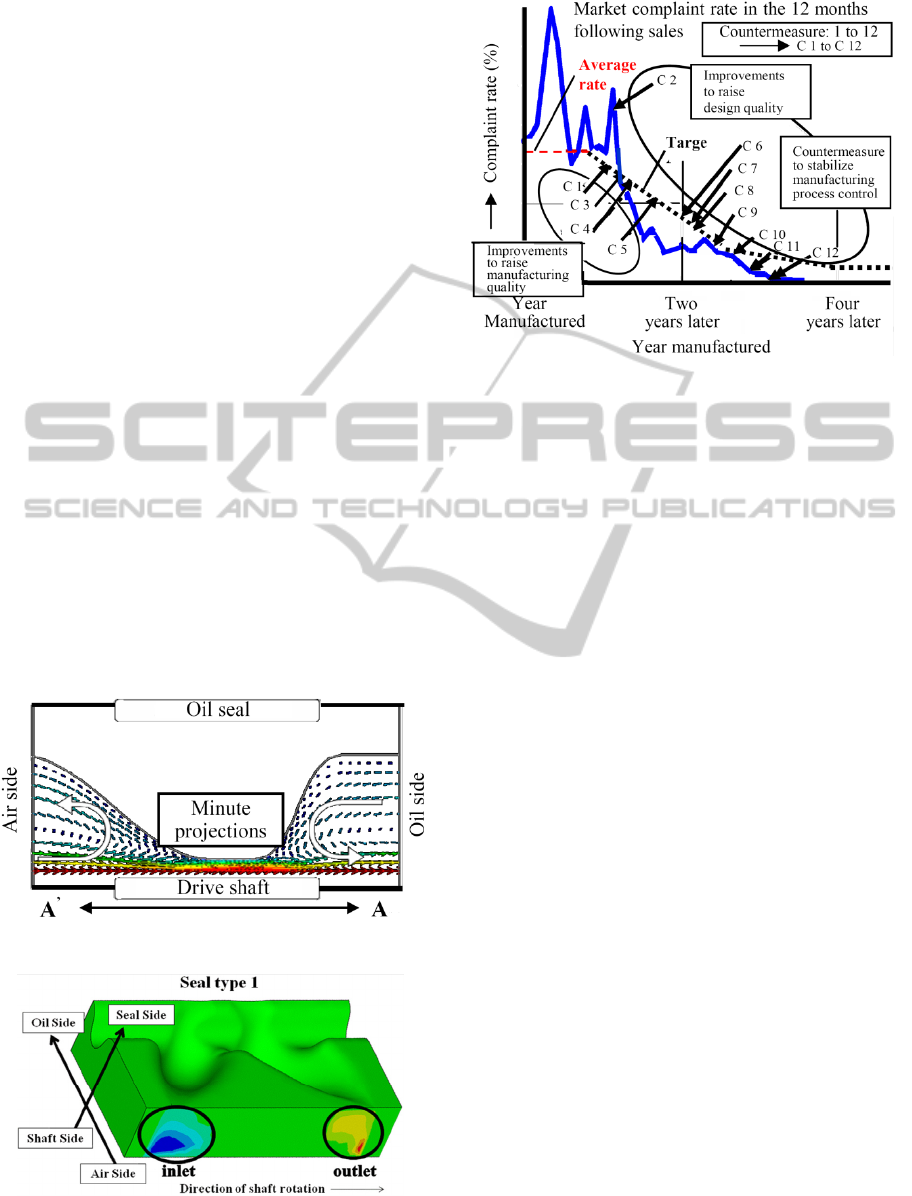
4.1.5 CAE Analysis (2D and 3D)
Using the technological elements mentioned above,
a two-dimensional CAE analysis was used to
conduct a numerical simulation that would
accurately describe the behavior of the oil on the
problematic minute projection areas. Figure 12
shows the results of this analysis. It shows the space
between the shaft near minute projection AA’ and
minute projection BB’ and the seal where oil is
getting trapped. This two-dimensional analysis
shows that shear stress is being generated by the
fluid (oil) due to the rotation of the shaft and that the
seal side flow direction is being reversed as the
minute projections narrow the fluid channel. Next, a
three-dimensional analysis was conducted using a
structural model of the sliding surfaces as a whole.
The model took into account the direction of oil flow
in a third dimension (depth) based on the knowledge
gained from the visualization experiment and the
two-dimensional CAE analysis. The model was used
to do a numerical simulation of the oil film present
on the sliding surfaces.
Figure 12: A two-dimensional analysis.
Figure 13: A three-dimensional analysis.
Figure 14: Reduction in market complaint rate.
The analytical model shown in Figure 13 was
constructed based the CAE qualitative model of the
basic oil seal lip structure shown in Figure 11. By
imposing conditions such as shaft rotation speed, the
amount of oil flow on the oil side and air side could
be calculated. The oil flow to the seal side and to the
air side was compared, producing similar results to
the visualization experiment.
4.1.6 Quality Improvement
The visualization experiment above allowed the
dynamic behavior of the oil leak to be visualized;
more specifically, the dynamic behavior involved in
the process whereby metal particles (foreign matter)
from gear rotation wear, found around the rotating
and sliding portions of the oil seal lip, become
mechanically fused and accumulate. This
phenomenon was then reproduced in a two- and
three-dimensional CAE analysis with high precision
(with a deviation of around 3% versus prototype
testing evaluations). This information made it
possible to gain an approximate understanding of the
oil seal leak mechanism and optimize design
parameters using a numerical simulation.
These results led to two measures to improve
design quality (shape and materials): (1) strengthen
gear surfaces to prevent occurrence of foreign matter
even after the B10 life (L10 Bearing to MTBF
(Mean Time Between Failures)) to over 400,000 km
(improve quality of materials and heat treatments)
and (2) formulate a design plan to scientifically
ensure optimum lubrication of the surface layer of
the oil seal lip (uneven portions of the sliding
surface) where it rotates in contact with the drive
shaft. As shown in Figure 14, the result of these
countermeasures was a reduction in oil seal leaks
ECTA 2011 - International Conference on Evolutionary Computation Theory and Applications
122

(market complaints) to less than 1/20th their original
incidence.
4.2 Application to Similar Problems
With its effectiveness verified, the authors were able
to apply the New Development Design CAE
Employment Model to critical development design
technologies for automotive production, including
predicting and controlling the special characteristics
of automobile lifting power, anti-vibration design of
door mirrors (Amasaka, 2010b), urethane seat foam
molding (Amasaka, 2007), and loosening bolts
(Yamada and Amasaka, 2011:). In each of these
cases as well, discrepancy was 3–5% versus
prototype testing. Based on the achieved results, the
model is now being used as an intelligent support
tool for optimizing product design processes.
5 CONCLUSIONS
This research addresses the necessity reforming the
business processes associated with development
design, a critical component of manufacturing, by
proposing a New Development Design CAE
Employment Model that takes manufacturers away
from conventional preproduction and prototype
testing methods and towards a better predictive
evaluation method. The effectiveness of the model
was verified by successfully applying it to the
technological problem of development design
bottlenecks at auto manufacturers. The author wants
to make it further established as "Optimal CAE
Design Approach Mode" by deployment of this
model from now on.
ACKNOWLEDGEMENTS
The author would like to acknowledge the generous
support received from the following researchers. All
those at Working Group No. 4) studies in JSQC,
study group on the ideal situation for quality
management in the manufacturing industry, and
those connected with the Amasaka laboratory at
Aoyama Gakuin University.
REFERENCES
Amasaka, K., 2004, Science SQC, New Quality Control
Principle – The Quality Control of Toyota, Springer.
Amasaka, K., 2005a, Constructing a Customer Science
Application System “CS-CIANS”, WSEAS
Transactions on Business and Economics, Issue 3,
Vol. 2, pp. 135-142.
Amasaka, K.,, 2005b, Interim Report of WG4’s studies in
JSQC Research on Simulation and SQC(1)-A Study of
the High Quality Assurance CAE Model for Car
Development Design,, 1st Technical Conference
Nagano, Japan, pp. 93-98.
Amasaka, K., 2007, Highly Reliable CAE Model, The
Key to Strategic Development of Advanced TDS,
Journal of Advanced Manufacturing Systems, Vol. 6,
No. 2, pp. 159-176.
Amasaka, K., 2008, An Integrated Intelligence
Development Design CAE Model Utilizing New JIT,
Journal of Advanced Manufacturing Systems, Vol. 7,
No. 2, pp. 221-241.
Amasaka. K., 2010a. Chapter 4.Product Design, Quality
Assurance Guidebook, New ed,. JSOC, pp. 87-101.
Amasaka, K., 2010b, Proposal and Effectiveness of a High
Quality Assurance CAE Analysis Model, Current
Development in Theory and Applications of Computer
Science, Engineering and Technology, Vol. 2, No. 1/2,
August/November Issue, pp. 23-48.
Amasaka, K., (Ed), 2007a, Establishment of a Needed
Design Quality Assurance Framework for Numerical
Simulation in Automobile Production, Working Group
No. 4 Studies in JSQC.
Amasaka, K., (Ed)., 2007b, New Japan Model - Science
TQM, Study Group on the Ideal Situation of Quality
Management in the Manufacturing Industry, Maruzen.
Ito, T., Sato, M., Yamaji, M., and Amasaka, K., 2010a, An
Analysis of Bottleneck Technology by Using
Experiments and CAE, International Business &
Economics Research Journal, Vol. 9, No. 12, pp. 123-
129.
Ito, T., Matsuura, S., and Amasaka, K., 2010b, Optimized
Design using High Quality Assurance CAE, The
Japanese Society for Quality Control, The 40th
Annual Technical Conference, Seijyo University,
Japan, pp.189-192.
Dong, Y, Fan, X,, and Liu, B., 2011, Numerical
Simulation and Technology Optimization of Rear Oil
Seal Bearing Die Casting Based on ProCast,
Advanced Materials Research, Volx, 89-193, pp. 189-
193.
Leo, J. D. V., Annos, N., and Oscarsson, 2004, Simulation
Based Decision Support for Manufacturing System
Life Cycle Management, Journal of Advanced
Manufacturing Systems, Vol. 3, No. 2, pp. 115-128.
Kameike, M., Ono, S., and Nakamura, K., 2000, The
Helical Seal: Sealing Concept and Rib Design Sealing
Technology, International 77 pp. 7-11.
Kume, H., 1999, Quality Management in Design
Development, JUSE.
Lopez, A.M., Nakamura, K., and Seki, K., 1997, A Study
on the Sealing Characteristics of lip Seals with Helical
Ribs, in Proc. 15th Int. Conf. British Hydromechanics
Research Group Ltd Fluid Sealing, pp. 1-11.
A NEW DEVELOPMENT DESIGN CAE EMPLOYMENT MODEL - Applying Numerical Simulation to Automobile
Bottleneck Technology
123

Magoshi, Y, Fujisawa, H., and Sugiura,.T., 2003,
Simulation Technology Applied to Vehicle
Development, Journal of Society of Automotive
Engineers of Japan, Vol. 53, No. 3, pp. 95-100.
Sato, Y., Toda, A., Ono, S., Nakamura, K., 1999, A Study
of the Sealing Mechanism of Radial Lip Seal with
Helical Robs–Measurement of the Lubricant
Fluid Behavior under Sealing Contact, SAE Technical
Paper Series, 1999-01-0878.
Yamada, H., and Amasaka, K., 2011, Highly Reliable
CAE Analysis Approach- Application in Automotive
Bolt Analysis, China-USA Business Review, Vol. 10,
No. 3, pp. 199- 205.
ECTA 2011 - International Conference on Evolutionary Computation Theory and Applications
124
