
DETECTING CORRELATIONS BETWEEN HOT DAYS
IN NEWS FEEDS
Raghvendra Mall, Nahil Jain and Vikram Pudi
Centre of Data Engineering, IIIT Hyderabad, Hyderabad, India
Keywords:
Deriving hot topics, Derived hotness, Correlated hot events.
Abstract:
We use text mining mechanisms to analyze Hot days in news feeds. We build upon the earlier work used
to detect Hot topics and assume that we have already attained the Hot days. In this paper we identify the
most relevant documents of a topic on a Hot day. We construct a similarity based technique for identifying
and ranking these documents. Our aim is to automatically detect chains of hot correlated events over time.
We develop a scheme using similarity measures like cosine similarity and KL-divergence to find correlation
between these Hot days. For the ‘U.S. Presidential Elections’, the presidential debates which spanned over a
week was one such event.
1 INTRODUCTION
News feeds are an important source of information
that provide relevant news through electronic media.
The purpose of this paper is to throw light on textual
analysis of Hot days or days when a particular topic
in the news receives high amount of coverage. Some
work has already been done to obtain Hot days for a
topic in news feeds (Shewart and Wasson, 1999).
Firstly, we identify the most relevant documents
of a topic on a Hot day. Throughout the paper we use
the topic of ‘U.S. Presidential Elections’ as an exam-
ple. We represent each document on a Hot day by
a vector space model comprising of noun and adjec-
tive phrases. We then compare the document’s vec-
tor with the vector corresponding to the combination
of all the documents related to that topic represent-
ing the background information. We use the standard
cosine similarity measure for comparison to estimate
the relevance of each document. The documents are
ranked based on their extent of similarity with the
background which indicates their relevance. Consider
for example, for a given day there are 1000 documents
and out of them around 100 documents are relevant
to the topic ‘Presidential Elections’. We rank these
documents in accordance to their relevance and select
only the top k percent. By selecting just the most rele-
vant documents we restrict to the major events related
to the topic on that Hot day.
Secondly, we make efforts to extend the concept
of Derived Hot days as developed in (Mall et al.,
2009). The purpose of our work is to observe chains
of Hot correlated events based on the concept of De-
rived Hot days as in (Mall et al., 2009). We use the
k percent of the most relevant documents to build a
vector space model for that Hot day. We compare
this with the vector space models of the k most rel-
evant documents of the corresponding Derived Hot
Days using measures of similarity like cosine simi-
larity and KL-divergence. This helps us to estimate
whether contextually there is correlation between the
Hot day and corresponding Derived Hot days. For ex-
ample, the Presidential debates which spanned over a
period of one week and included three debates were
discovered as correlated events using our methodol-
ogy. Our contributions are indicated as the following:
• Use NLP techniques to develop ranking methods
for the documents relevant to the Hot days.
• Compare similarity of ranked relevant documents
between Hot days and Derived Hot days.
• To identify chains of Hot correlated days.
A detailed information about detecting trends and
variations in News Feeds is provided in (Mall et al.,
2009). We use the AG’s Corpus of News Articles
(Gulli, 2005) using the ‘Presidential Elections’ as the
topic under consideration. The corpus contains more
than 1 million news articles from at least 2000 dif-
ferent news sources. There were about 10, 000 docu-
ments relevant to ‘U.S. Presidential Elections’ span-
ning over a period of 120 days. In the next section, we
introduce our proposed technique to identify and rank
375
Mall R., Jain N. and Pudi V..
DETECTING CORRELATIONS BETWEEN HOT DAYS IN NEWS FEEDS.
DOI: 10.5220/0003627203670370
In Proceedings of the International Conference on Knowledge Discovery and Information Retrieval (KDIR-2011), pages 367-370
ISBN: 978-989-8425-79-9
Copyright
c
2011 SCITEPRESS (Science and Technology Publications, Lda.)

the most important documents on the basis of their
relevance. We also discuss measures used to detect
similarity between Hot Days and Derived Hot days.
2 PROPOSED APPROACH
We first explain the use of NLP methodologies to
detect the most important documents and rank these
documents on the basis of their relevance. Then we
compare the similarity of the ranked relevant docu-
ments between Hot days (set of) and between Hot
days and Derived Hot days to determine the corre-
lation between them. This helps us to estimate chains
of Hot correlated days.
2.1 NLP Techniques to Identify and
Rank Important Documents
Once we know the days when the topic of interest is
Hot, we process all the documents that day to identify
the most important ones. A standard parser is used for
the purpose of tagging (TnT parser). The corpus used
as a pre-model for providing tags is the default model
available with the TnT parser. For each Hot day we
select the relevant documents (ones whose score is
greater than 0.5). We parse each document so that
there is only one token in each line and make it suit-
able for the Tnt parser. The tokens of each document
is kept in a single file. This file is used as our test
file which has to be provided with tags and we use the
trigrams model for providing tags to each token.
Once we have provided the tags we select noun
noun (NN) phrases and adjective noun (JN) phrases
for each document. These are the most important
phrases or concepts which can replicate the main
content of the documents efficiently. The same NN
phrase or JN phrase can occur multiple time in a doc-
ument for a given Hot day. So we maintain the fre-
quency of occurrence of each phrase in a document.
We can now estimate the total occurrence of each such
phrase in all the documents for that day.
We have a bag of phrases model for each relevant
document and for all relevant documents (background
information) on a Hot day. Now, we define a mech-
anism to rank the relevant documents. We convert
the bag of phrases to a vector space model assigning
0 for those phrases not present in the document and
assigning frequency of the phrase for those present in
the document. We then compare the cosine similarity
between the vector for a given document and the
vector corresponding to the relevant background
information. Mathematically, its represented as:-
D
i
= Vector o f phrases present in document D
i
N = Vector of phrases present in all documents
Score(D
i
) = CosineSimilarity(D
i
∗ N) (1)
The greater the score for a document D
i
, the more
is the importance or relevance of that document for
that given Hot day. So, greater the similarity with
the background information of that day and higher the
rank.
2.2 Similarity between Hot Days and
Derived Hot Days
We now try to estimate whether Hot days are really
actually correlated or not, based on context. For this
purpose we use the variable parameter k which is used
to limit the selection of the ranked relevant docu-
ments. For example, if we set k = 10 then only the top
ranking 10% of the relevant documents are used. We
then construct a vector from the top ranking k percent
of the documents in a manner similar to that described
in previous subsection. Then we take into account Hot
Days in pairs and as there are 31 Hot Days we have
30 such pairs of days. We then calculate the cosine
similarity between each such pair of days and greater
the similarity more is the actual correlation between
those Hot days. This parameter k plays an important
role in the quality of correlation.
A similar process is followedto determine correla-
tion between Hot days and Derived Hot days. Here it
is important to mention that the existence of a Derived
Hot day corresponding to a given Hot day depends
on the statistical criteria. So once we have identified
the Hot Day and Derived Hot day pair, we again con-
struct the vector using the top ranking k percent of the
relevant documents for those days and calculate the
cosine similarity or the KL divergence.
3 EXPERIMENTAL RESULTS
We performed our experiment on AG’s corpus of
NewsArticles using the ‘Presidential Elections’ as the
topic of our focus. The presidential elections were ac-
tually held during the period when the data was col-
lected and was thus chosen as the topic under consid-
eration. To identify chains of hot correlated days, we
used cosine similarity and KL divergence measures.
3.1 Cosine Similarity Results
From Figure 1, we see the square brackets represent
the Hot Days for which value is 1. The other sym-
KDIR 2011 - International Conference on Knowledge Discovery and Information Retrieval
376
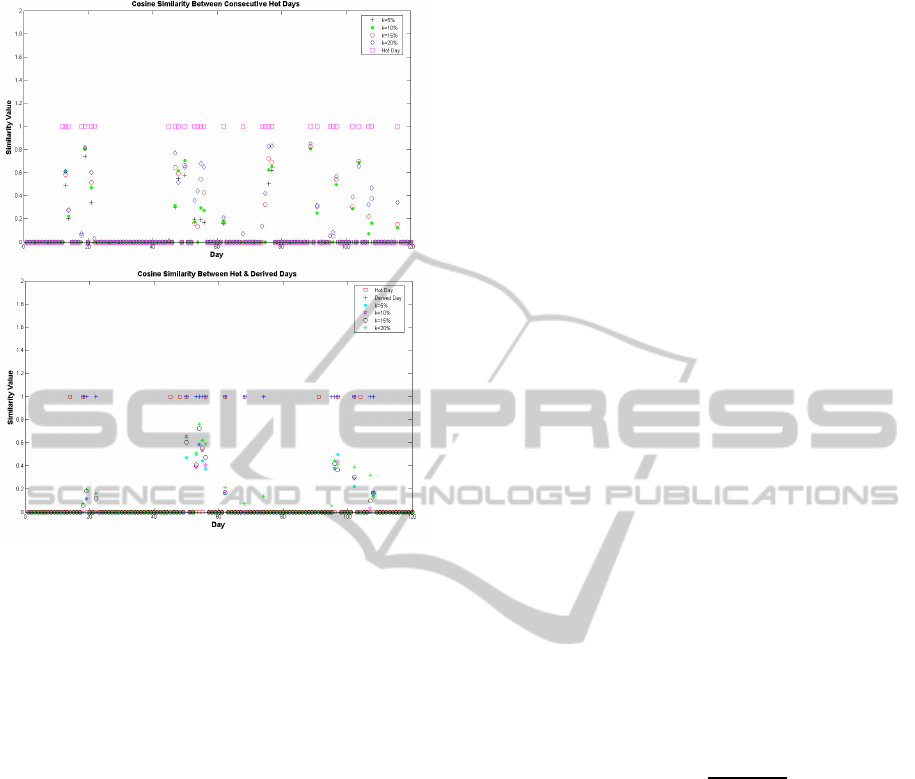
Figure 1: Cosine Similarity Measure.
bols are used to represent percentage of top ranked
relevant documents selected for that Hot day. We can
see that their values represent the cosine similarity be-
tween the previous Hot day and that Hot day. We
observe that cosine similarity value increases as we
increase the value of k from 5 to 20 percent. This
follows logically as more the number of ranked doc-
uments for a given Hot Day, better is representation
of the concepts that day. An important remark would
be that for k >= 10, we have good cosine similar-
ity values between consecutive Hot days and we can
predict whether the Hot days are correlated or not ef-
fectively. For example, there is very high correlation
(nearly 0.8) between 75
th
and 76
th
day for k = 20%.
When we observe the cosine similarity between
Hot days and Derived Hot days, we see that most of
the Derived Hot days which have been estimated by
the criteria (UCL
m
) defined in (Mall et al., 2009) are
actually correlated to their previous Hot days. Any
cosine similarity value greater than 0.25 can be con-
sidered as good correlation between the days. For ex-
ample, there is efficient correlation between 48
th
and
50
th
Hot days or the days of first Presidential debate
and 53
rd
and 54
th
Derived Hot days or the days of
second Presidential debates, even when the threshold
k is set to as low as 5 percent. Similarly, there is high
correlation between the 91
st
day which is the Hot day
where the main events are after election controversies
of tampering with votes, passing new bills etc. and
96
th
and 97
th
day which are Derived Hot days where
the electoral controversiescontinue to evolveand new
bills are passed. Thus we can identify the quality of
similarity between the Hot days which helps to deter-
mine chain of Hot correlated events over time.
3.2 KL Divergence Results
The KL divergence mathematically represents the
average logarithmic difference between the proba-
bilities P and Q. Here P represents the probability
distribution for the phrases of a previous Hot day
and Q represents the probability distribution of the
phrases of a given Hot day when comparing the diver-
gence between two Hot days. While P represents the
probability distribution of the phrases for a Hot day,
Q represents the same for its Derived Hot Day when
estimating correlation between them. The probability
distribution only comprises of those phrases which
are common to both the Hot day and the Derived Hot
day. The probability of each phrase for a given day is
calculated as the ratio of the occurrence of a phrase in
the top k percent of ranked relevant documents to the
total frequency of all the phrases in the top k percent
of ranked relevant documents. We also handle the
special case of zero conditional probability i.e. the
case when the two distributions P and Q have no
phrase in common. In other words, when there is no
matching terms between those days we associate a
divergence of 1.0 (or no correlation) for those pair of
days. Mathematically, it is represented as:-
D
KL
(P||Q) =
∑
i
P(i)
log(P(i))
log(Q(i))
(2)
From Figure 2, we observe that KL divergence results
are relatively better than cosine similarity results. The
Hot days are represented by square boxes, Derived
Hot days by ‘+’ symbols (attaining a value of 0.7)
and the other symbols represent the similarity mea-
sures for different values of k. We see that in case
of consecutive Hot days, k = 15% gives the lowest di-
vergence values when days are actually correlated and
gives divergence as 1.0 when they are not correlated.
The reason is that as we allow more percentage of the
ranked relevant documents to be selected i.e. k > 15,
some phrases with very low probability may be simi-
lar between Hot days but most of them are not. So as a
result they have a higher divergence value. Any value
lesser than 0.2 can be considered as good correlation,
since smaller the divergence more the similarity and
greater the correlation.
In case of Hot days and Derived Hot days, the
method works extremely well and only identifies
DETECTING CORRELATIONS BETWEEN HOT DAYS IN NEWS FEEDS
377

Figure 2: KL Divergence Measure.
those days as Derived Hot days which have actually
very low divergence from their corresponding Hot
day. So a lot of statistically determined Derived Hot
days are actually not correlated to Hot days. How-
ever, our example of the 48
th
and 50
th
Hot day and
53
rd
and 54
th
are among those which satisfy the KL
divergence criteria and are indeed highly correlated.
3.3 Evaluation of Correlations
Figure 1 and Figure 2 depict the correlations between
Hot Days and Derived Hot Days. The cosine similar-
ity and KL divergence models are estimated for dif-
ferent values of k. This k represents the percentage of
the top ranked most relevant documents on that day
which help to build up the models. If we keep high
value for k then we can have over-fitting which indi-
cates terms which are not so relevant may crop up in
the models. On the other hand, if we keep very low
value for k then the we can have under fitting or many
relevant terms might be missing from the models. So,
we select k = 15% for the purpose of our analysis.
Cosine similarity values less than 0.25 denote less
significant correlations. We notice that there are some
pair of days (e.g. 62
th
day and 68
th
day etc.) which
have 0 similarity value or no phrase in common which
denotes that contextually these days have no correla-
tion. So these days have been incorrectly labelled as
Derived Hot Days. However weak correlations, be-
tween the topic, exist for some pair of days (e.g. 14
th
day and 19
th
day - 0.19, etc.). The KL divergence
value of 1.0 means that there is maximum divergence
or no correlation between those pair of days. So these
days are again incorrectly labelled as Derived Hot
days. KL divergence method shows extremely low
divergence value for 91
st
Hot day and corresponding
96
th
and 97
th
Derived Hot days. This indicates that
there is very high correlation between that Hot day
and its Derived Hot days which are following up the
events. According to cosine similarity and KL diver-
gence measures, there are 8 pairs of strongly corre-
lated Hot days and Derived Hot days. However, co-
sine similarity indicates weak correlation between 4
such pair of days and KL divergence has feeble corre-
lation for 1 such pair of days. Thus the KL divergence
metric is more effective in identifying strongly corre-
lated days than cosine similarity measure.
4 CONCLUSIONS
In this paper, we built upon the concept of Hot days
identified by means ofUCL
m
metric. We obtained the
most relevant documents for a particular topic on a
given Hot day. We used NN phrases and JN phrases
to identify concepts from relevant documents for a
Hot day. Using these phrases and cosine similarity we
developed a ranking methodology to order the docu-
ments on basis of their relevance. We then estimated
whether there is actual correlation between Hot days
and between Hot days and Derived Hot days using
these ranked relevant documents. We used measures
of similarity like cosine similarity and KL divergence
and observed that KL divergence provided more qual-
ity results for the estimation of correlation. This helps
to estimate chain of Hot correlated events.
REFERENCES
Gulli, A. (2005). Ag’s corpus of news articles.
http://www.di.unipi.it/∼gulli/AG corpus of news
articles.html.
Mall, R., Bagdia, N., and Pudi, V. (2009). Variations and
trends in hot topics in news feeds. In Fifteenth Inter-
national Conference on Management of Data.
Shewart, M. and Wasson, M. (1999). Monitoring a news-
feed for hot topics. In Fifth International Conference
on Knowledge Discovery in Data Mining.
KDIR 2011 - International Conference on Knowledge Discovery and Information Retrieval
378
