
AN ONTOLOGY FOR A HYDRO-METEOROLOGICAL
OBSERVATION NETWORK
Lúcia Morais Kinceler
1,2
, Angelo Mendes Massignam
2
and José Leomar Todesco
1
1
Programa de Pós-Graduação em Engenharia e Gestão do Conhecimento, Universidade Federal de Santa Catarina
Campus Universitário, Florianópolis/SC, Brazil
2
Empresa de Pesquisa Agropecuária e Extensão Rural - Epagri, Rod. Admar Gonzaga, 1347, Florianópolis/SC, Brazil
Keywords: Ontology, Data access, Web system, Weather data, Meteorological network, OntoKEM.
Abstract: The importance of meteorological and hydrological data observation stations has grown substantially in
recent years to meet the most diverse demands; ranging from environmental studies related to climate
change and hydrological studies for water use, up to traditional monitoring work to prevent disasters
through the use of forecast models of weather and water level control to contain the flow of rivers. The
effort by governmental institutions, with support from the private sector expanded the network of
observation stations in the State of Santa Catarina, Brazil. However, access to such data is still restricted to
few technical people or to a group of users that access a web information system tailored for them. This
paper presents the steps for developing a prototype of an ontology which serves to facilitate data access for
web users not familiar with either specific concepts or the domain terminology. The goal for building the
prototype is to understand the steps and implications using two complementary tools such as OntoKEM and
Protégé for ontology construction.
1 INTRODUCTION
Meteorological and hydrological observation data
have been used for centuries by several areas, some
of which with critical importance such as aviation,
shipping and agriculture. Installation of automatic
weather stations (AWS), with real time data being
transmitted and recorded every hour or in shorter
intervals, started a significant increment in the
volume of data available in the 90´s. In addition, the
easy access to these equipments increased the
number of stations to dense weather networks with a
consequent enlargement of these databases. Besides
the growing interest in the existing data, these
databases still serve primarily domestic needs.
Although the Internet brought new opportunities
and forms for data access and for dissemination of
information for a wider range of users, observation
data could be more widely open to people if a
standard terminology would be available.
The description of concepts and their relations
within a domain provided by ontology, a recent field
in computer and information sciences, foster
knowledge sharing and integration of distributive
data within a context.
Initially used by the Semantic Web to provide
easy access to information on the Internet, Ontology
has outgrown its application areas. Semantic web
aims to exchange “meanings” and this allows people
(and machines) to exchange knowledge (not data)
through a set of interoperable ontologies (El-Diraby;
Lima and Feis, 2005). Since Ontology offers
formalism in defining concepts through a
description, it makes available semantics and
inference mechanisms on data stored in databases
allowing interoperability between knowledge bases
and easy information searching and processing.
This paper aims to present a prototype of an
ontology for the network of meteorological stations
deployed in the State of Santa Catarina, Brazil, to
complement an online data visualization web
system. The goal for building the prototype is to
understand the mechanisms of ontology
implementation process using two complementary
tools such as OntoKEM and Protégé and to explore
the potential ontology presents to speed up access to
desired information in databases.
The data observation network in Santa Catarina
State, Brazil, is described in the second section of
this paper. The third section discusses about data
145
Morais Kinceler L., Mendes Massignam A. and Leomar Todesco J..
AN ONTOLOGY FOR A HYDRO-METEOROLOGICAL OBSERVATION NETWORK.
DOI: 10.5220/0003626701450151
In Proceedings of the International Conference on Knowledge Engineering and Ontology Development (KEOD-2011), pages 145-151
ISBN: 978-989-8425-80-5
Copyright
c
2011 SCITEPRESS (Science and Technology Publications, Lda.)

visualization and the web system that is operational
for online state meteorological and hydrological data
access. The fourth section describes the steps for the
prototype ontology construction and the final section
presents some conclusions.
2 THE DATA OBSERVATION
NETWORK
The agricultural area has made wider and more
intense use since the earliest records of
meteorological data. In the United States, for
instance, the records of weather data started far off
in the year of 1753 about the progression of cyclones
and ocean currents (Oblack, 2011). As stated by
Conner (2004), the first formal network of weather
observers in the United States, established in 1818
by an Army Surgeon General, was motivated by
health purposes; and the network aimed to ascertain
a change in the climate of a given district in a series
of year and how far this was dependent on
cultivation of the soil, density of population, and
other factors. Since then, meteorological observation
data have been applied in planning and development
of agricultural technologies, and systems of climatic
data for agricultural prediction and in many other
areas of study. Although the first weather records in
Brazil started in 1754 with a description of weather
variations (sensory observations) in the Amazonia
region, it was after creating the Astronomic
Observatory of Rio de Janeiro in 1827 that scientific
procedures started in Brazil (Sant´Anna-Neto, 2003).
The pioneer meteorological network in Brazil was
installed in 1886 in São Paulo, reaching 40 points of
observation in a 14 year period.
In Santa Catarina, the first meteorological data
records date of 1874. The Agricultural Research
Institute of the State of Santa Catarina, Brazil
(Epagri) began the ordination of a network of
meteorological stations in the 70´s, whose goal was
the establishment of zoning of agricultural crops
with potential for the territory, according to
bioclimatic criteria. Meteorological observation data
were collected three times daily and recorded on
paper forms since 1911. Transcription to electronic
format began in 1986 with the development and
deployment of a meteorological database. The
installation of AWS in 1997 with real time data
being transmitted and recorded every hour, and also
the increase in the number of stations, were
significant accomplishments. The network was
shortly expanded with hydro-meteorological stations
to cover the gaps left by the meteorological and
hydrological federal agencies. This network has
been monitoring the atmosphere, rivers and sea
level, in cooperation with other national and
international institutions. From the 85 hydrological
stations of the National Water Agency currently
operational in the state, 33 of them are automatic.
Private companies from forestry, ports, agriculture,
fishery to hydro/thermal power stations have
invested in AWS to expand the network in the state
and neighboring states. There are 95 weather
stations, 71 are automatic and 24 are conventional
observation stations. Among the hydrological
rainfall and streamflow stations, 67 of them are
conventional and 129 are automatic.
The National Institute of Meteorology (INMET),
has deployed 14 new AWS in Santa Catarina to
study the changes and climatic fluctuations that
require preventive and mitigation actions to
minimize climate risks. INMET works cooperatively
in South America providing frameworks for
scientific studies, including those events that cause
climate change, with the support of WMO (World
Meteorological Organization/United Nations).
The data observation network is of indubitable
importance since hydrological data have an
extraordinary demand from technical analysis. On
the other hand, it is also evident the great importance
of weather, climate and water data. However, a
major difficulty has always been the dissemination
of information to different users in different formats.
3 DATA VISUALIZATION
Data is considered, in this context, as a signal sensed
by our sensorial system, and each data can be stored
and handled, for instance, in databases (Schreiber et
al., 2000). Information is data with some meaning
within a context and involves relations among data.
Information systems development has proven
efficiency for data and information handling, but
investments made toward leveraging access to good
infrastructure to promote fast and inexpensive access
to data and information, especially after the Internet,
created an overwhelming amount of information,
which in turn can be cumbersome to people. As a
consequence, delays can be further complicated and
costly for an organization when decisions need to be
taken rapidly.
Knowledge derived from information is richer
and more meaningful. Organizational knowledge
flows and it is recognized as patterns, in a much
more complex structure of relations, or it can also be
KEOD 2011 - International Conference on Knowledge Engineering and Ontology Development
146

defined as information in action. Access to
knowledge must be available in ready-to-use
solutions to answer organizational demands in time.
Epagri´s Center of Hydro-meteorological
Information and Environmental Resources (Ciram)
has developed a web-based information system for
knowledge and information consultation which also
sends automatic warning messages to special users
and internal staff.
In house users are weather station maintenance
staff who needs information and control system for
planning purpose with quick, easy and intuitive
access to maintain data quality in the network. The
main system requirements for these users are:
• monitoring the missing data for the entire
network of stations;
• a table of the stations should provide sensors of
varying patterns with main standard variables;
• the system must differentiate the amount of
missing data, and failures – if any, for each station in
a 48 hour period;
• stations must be grouped in: meteorological,
hydrological, oceanographic and support research;
• user should be able to sort the data, choose the
number of hours to be monitored, in graphical form
or on a map, and verify the climatology;
• access through the intranet/internet should be
simple and data timely updated;
• A lightweight web application deployed to
consume little computer resources and should be
faster on the access of information and updates.
System requirements for special users vary from
user to user and it is hardly dependent on data
analysis and simulations for each application. An
application involving data visualization was then
developed to balance analysis, visualization and
interaction, which are the main components of a
decision support system.
3.1 Implementation Results
It was initially studied all system requirements,
database variables and relationships, and the
available technology according to organizational
standards. The system development project plan
considered data visualization of great importance
since its graphic format provides better information
clarity, precision and efficiency to meet all system
requirements. Data stored in the 8i Oracle database
was studied regarding variable, structure and
input/output processes characteristics for the three
class type stations.
Once a web-based system for online data
visualization was to be developed, the technology
requirements should take that into account. The
technology selected was the J2EE (Java 2 Platform,
Enterprise Edition) from Sun Microsystem's using
JDBC to connect to the Oracle database. JavaBeans,
Servlets and Java Server Page - JSP were used to the
presentation layer; and, Tomcat on Linux operating
system used for the application server.
Some other technical requirements for the system
were: flexibilization, decentralization and
mobilization. Flexibilization made possible with
interactive interface, so people with no specific
training could use specialized software for complex
actions. Information technology provided the
possibility of decentralization, that is, specific tasks
can be moved from the back-end to the front end
computers providing better performance and leaving
servers for other tasks. The mobilization allow
anyone access information for decision making from
anywhere and in distributed computers; from mobile
phones, notebooks and mobile communication
(Heijmans, 2002). So, staff can easily do their work
not only at the office, but also at field, at home, on
the road or at the client's office.
Simulations or measurements are frequently
difficult to be interpreted by users in the application.
The main project goals are to transform the data into
something more meaningful and in a useful visual
representation so that the human observer can
quickly have a better understanding. Visualization is
usually represented by graphics, maps, diagrams, or
in the form of tables. Pictorial format system was
developed. Colors were explored to distinguish data
availability or sensor problems, tables to group
stations, maps to show data and geographic
distribution. The user surfs data on a click of the
mouse. This helps staff to plan maintenance trips
according to groups of stations, better sensor
suppliers and plan of sensor acquisitions.
Figure 1: Hydrological forecast model.
AN ONTOLOGY FOR A HYDRO-METEOROLOGICAL OBSERVATION NETWORK
147

Information had also to be delivered to other users
and through a variety of media, as soon as required
and in different situations. It was necessary to be
available the right time, at the right place, for the
right person and in the right format.
Special users are so called since they receive
special information for decision making. Data is
handled specifically to provide such information
although within a monthly cost for software
development and to maintain the service available
online, as shown in Figure 1.
The demand for this service is high as well as
development time and maintenance hours. Data
could be more useful for the public if a more
friendly system were available for data access. Web
user difficulties range from simple questions such as
identification of the existing stations in the area of
interest and to identify the parameters. This is due to
both a lack of knowledge about this specific area and
of a more friendly system. By adding meaning to
data the expectation is that information will be more
accessible and meet a greater number of people with
ease and independence that internet provides.
Besides to data sharing and integration of
distributive data, some database may interoperate
with other databases and systems.
Ontology has been primarily used to build
domain knowledge models in knowledge systems
projects (Chandrasekaran; Josephsons; Benjamins,
1998). Ontology has also been used as an
intermediary layer for mapping different
applications or applications with heterogeneous
sources of information, enabling the interoperability
among systems and also for data integration.
Among the most universally recognized benefits
presented by ontology, the easy way they represent
semantically a domain, their potential for sharing in
different domains, and re-use must be pointed out.
4 THE ONTOLOGY PROTOTYPE
Ontology is often used as a tool for Knowledge
Systems construction. Ontology in Gruber´s
definition is (1993) "a formal and explicit
specification of a shared conceptualization". It
describes in a generic way the knowledge shared
between different specialists in a field to create a
common understanding of a knowledge domain
using concepts, properties and relationships. But it
can also provide standard in domain knowledge.
Since ontology is a formal description of a domain it
can either be processed by computers and be
understood by people. Knowledge engineers use
ontology to capture the semantics of knowledge and
to put it in a format that is easy for maintenance as
well as to efficiently process inference algorithms
(Knublauch, 2002).
4.1 Methodology
The process of ontology construction is usually
supported by specification, conceptualization,
formalization, implementation, evaluation
(verification and validation) and maintenance phases
(Rautenberg et al, 2008). Some well known
methodologies for ontology construction are On-to-
Knowledge (Fensel and Hermelen, 2008) and
Methontology (Gómez-Pérez et al., 2004).
The ontology building process and
methodologies inspired the creation of several
development tools, such as Kaon (Oberle et al.,
2004), Protégé (Gennari et al., 2003), OntoKEM
(Rautenberg et al, 2008) and OntoSTUDIO (Weiten,
2009) among others.
Protégé is an efficient modelling tool that has
been widely embraced by the community of
Knowledge Engineering (Knublauch, 2002) once
promotes interoperability with other tools through
RDF exchanging format files. Protégé is a Java open
source software which offers several features that
can be expanded through plug-ins and provides
support for languages based both on frames and
logic. It works especially well in the ontology
implementation, evaluation and maintenance phases.
However, for the early stages of ontology
construction OntoKEM was proposed.
OntoKEM (Ontologies for Knowledge
Engineering and Management) was created by the
knowledge engineering group at Federal University
of Santa Catarina (Brazil) to support the first stages
of ontology development (Rautenberg et al, 2008). It
is a good help for requirement analysis and makes
good project documentation that covers
specification, conceptualization and formalization
phases. The final product of a project developed
with OntoKEM is an OWL (Web Ontology
Language) format file.
The domain ontology construction for
observation stations network project proposed by
this work was created to facilitate users' access to
data stored in an Oracle relational database called
SAM, administered by Epagri. This database stores
observing data or automatically recorded data of the
network. Stations have a code that identifies them as
belonging to a class type, but users who access data
through the web have no knowledge of the meaning
associated with each code.
KEOD 2011 - International Conference on Knowledge Engineering and Ontology Development
148
The project started with requirement analysis, to
detail the problem and the expectations, and to
contextualize the problem. Lately, it is defined the
terms, relations and constructed a vocabulary. A
hierarchy of classes is then structured and all
relations between classes, their properties and
restrictions are formally listed. OntoKEM
proposition tool was used in project´s first phases.
The following implementation and evaluation phases
were supported by Protégé in a straightforward
procedure since an OWL file from OntoKEM was
created to be imported into Protégé. This project had
five specialists collaborating from specification to
validation phases, described in details as follows.
4.1.1 Specification Phase
The specification phase has the purpose of defining
the ontology scope in terms of limits that will be
considered in developing the project.
During this phase competence questions are
raised, which are typical questions that the ontology
must respond appropriately and efficiently, defining
the ontology domain and scope limits.
Knowledge engineer investigates a domain,
defines the most important concepts, and makes a
formal representation of objects and relationships in
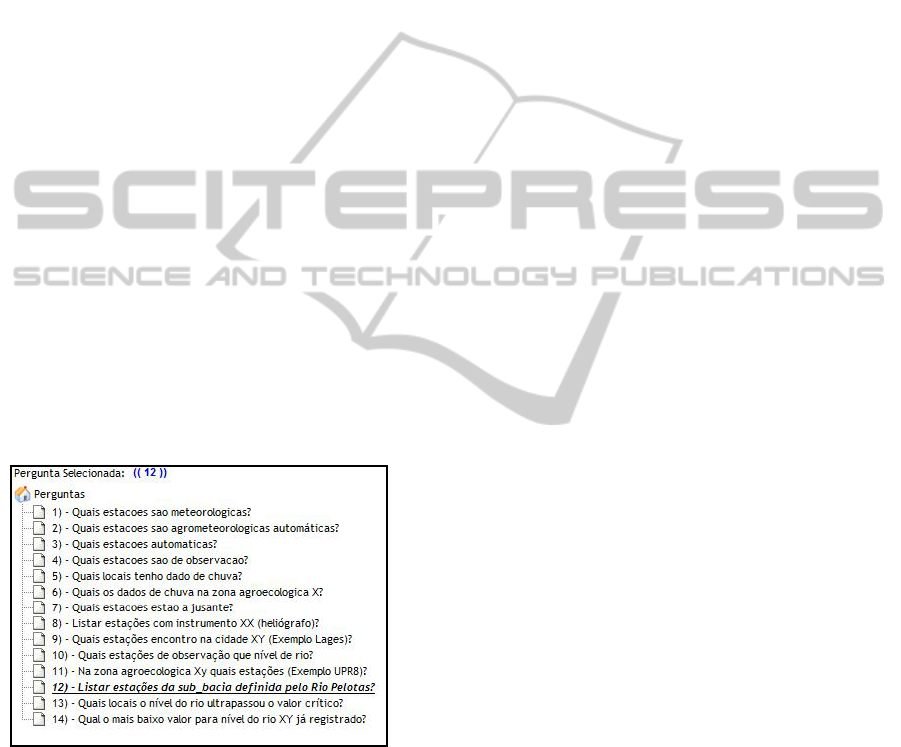
this domain (Russell and Norvig, 1995). Figure 2
shows OntoKEM´s interface for weather stations
ontology competence questions registry.
Figure 2: Competence questions.
At the beginning, the project had two objectives:
1) identification of areas covered by stations for data
collection, 2) easy data access. However, the system
for retrieving data from the database already exists
and it is efficient, and the real problem is the
identification of stations that can meet web users'
interests. The project focused then on this second
problem and competence questions were adjusted.
4.1.2 Conceptualization Phase
Conceptualization is a description of the ontology on
a conceptual model. The model consists of domain
concepts, relations between concepts and properties
of concepts (Rautenberg et al., 2008). Noy and
Mcguinness (2000) suggest that it is useful to write
down a list of all terms we would like either to make
statements about or to explain to a user: “What are
the terms we would like to talk about? What
properties do those terms have? What would we like
to say about those terms?”
From the competence questions, OntoKem
provides a mechanism to identify the terms of the
ontology and the relationships between those terms.
Subsequently terms will be incurred in classes and
subclasses that represent objects and concepts of the
ontology in a hierarchical structure. Relationships
between terms are also identified from the
competence questions and registration occurs
simultaneously. Once the set of relations defines
semantics to the domain the ontology represents,
relationships will provide consistency to classes.
Suggested names for terms from each
competence question were standardized to start with
uppercase letter. Terms with more than one word are
joined by an underscore. Relationship names are
registered in two words. The first word is a verb
followed by a class; the words are connected by
underscore and both in lowercase letters.
Terms and relationships aggregate a conceptual
or functional description which will compose a large
dictionary for project documentation. A vocabulary
for the ontology was created with 85 elements from
suggested terms, of which 36 represent classes, 22
represent relationships between classes, 22 represent
properties, 1 defines a constraint for stream order
and 4 terms were abandoned. Vocabulary registries
all concepts shared by the ontology team members.
It is an excellent documentation of the ontology
since it describes conceptually all the elements.
4.1.3 Formalization Phase
The formalization phase transforms the conceptual
description into a formal model (Rautenberg et al,
2008). Axioms may constrain concept
interpretations by restricting its meanings using "is-
a" or "part-of" relationship types in hierarchically
organized structures.
Classes´ hierarchy was accomplished with a
grouping class process. For each selected class
subsequent associations are made to a parent class or
to a list of sub-classes. During the iterative process,
some terms changed. For example, the relationship
AN ONTOLOGY FOR A HYDRO-METEOROLOGICAL OBSERVATION NETWORK
149
“is_type” created to define a relationship between
the “station” and “type” classes was deleted.
Subclasses named “Automatic_station” and
“Observing_station” were created for the class
“Station”. This demonstrates that two subclasses that
were not raised up from the competence questions at
the beginning of the project were created later on.
When the hierarchy of classes is completed, the
combination of relationships between classes is set.
The relationships were created from the competence
questions and are now used to associate the
appropriate classes. It is worth to note that
subclasses inherit the relationships of a parent class.
Relationships are defined by a domain class and a
range class. OntoKEM defines constraints between
classes only as comments, to indicate that these
restrictions need to be implemented when the OWL
file created by OntoKEM is imported by Protégé.
4.1.4 Implementation Phase
The implementation phase is the actual development
of the ontology on a formal knowledge
representation language (Rautenberg et al., 2008).
The documented conceptual model created in
OntoKEM in the first three phases can be exported
to an OWL format file. The ontology is implemented
by importing the OWL file into Protégé.
Protégé is a free open source platform which
uses OWL editor for building applications based on
knowledge and domain models structured on
ontology. The Protégé platform is a foundation for
rapid development of applications and prototypes.
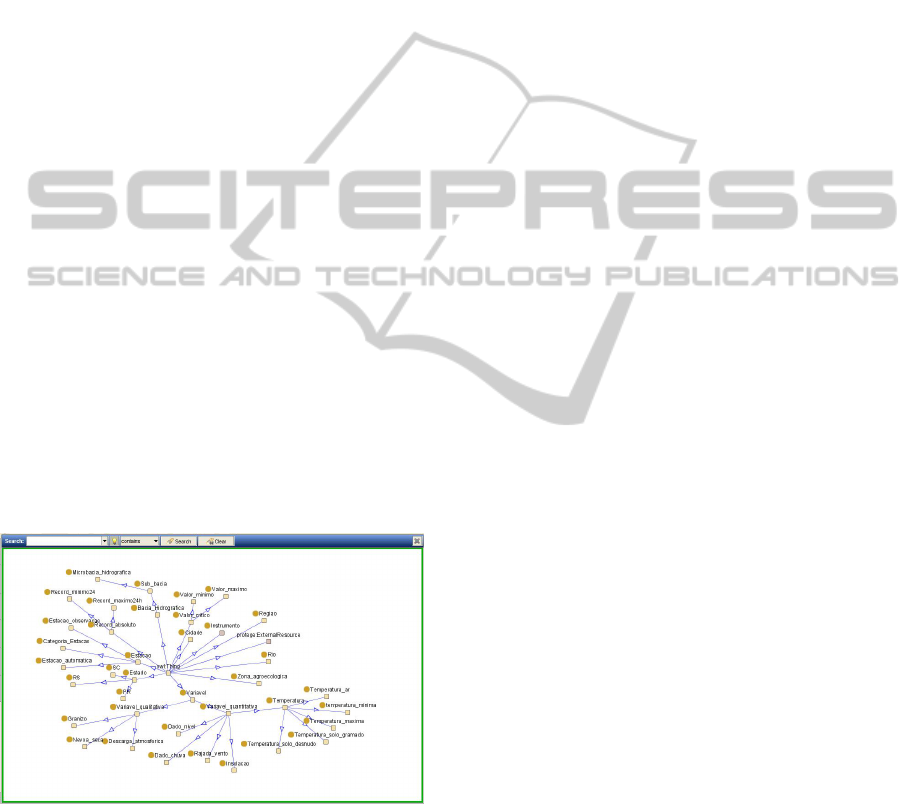
Figure 3: Protegé_Jambalaia´s hierarchy of classes.
When the OWL file generated by OntoKEM is
imported into Protégé, a hierarchical structure is
obtained by the Protegé_Jambalaia plug-in as shown
in Figure 3, similar to the one created by OntoKEM.
OntoKEM relationships between classes are
properties in Protégé, which means that properties
are relationships between two objects. Instances of
classes are called individuals and must be unique.
4.1.5 Evaluation Phase
Individuals, or instances of classes, must be unique
and were inserted to validate the structure of the
ontology imported into Protégé. At least 20
instances for each class were created. Many
relationships between classes were discarded or
adjusted to give semantic support to the ontology.
Thus, the iterative building process provided more
adjustments in the ontology.
Instances of classes must be inserted from the
more generic and independent to the more specific
and dependent classes, in that order. Since
relationships between classes are established when
instances of dependent classes are created,
independent classes must exist prior to the creation
of dependent classes for the relationships to be
established at this moment. Instances must be the
most representative of the ontology universe.
After inserting all instances, the ontology is
checked for its appropriateness to the purpose for
which it was created through queries or questions. It
is made a rescue of the competence questions during
this process to generate the queries that check
whether the ontology is responding appropriately to
its purpose. Queries are structured to search for
instances of classes through their relationships with
other classes or by criteria of their properties.
During the validation process it is important to
observe if the result of a query sets aside instances
that should be selected or if it really represents the
conditions established for that ontology. This
process allows adjustment of relationships between
classes or relationships to be more restrictive for
better ontology expression. Although all declarations
must be explicit, sometimes some statements go
unnoticed during the construction process. The
validation phase, therefore, is set to find those gaps.
5 CONCLUSIONS
This paper has presented a network of
meteorological and hydrological stations deployed in
the State of Santa Catarina, Brazil, and an online
data visualization web-based system. Detailed
description of an ontology prototype construction
has followed to provide a formal definition of
concepts and to make semantics and inference
mechanisms available on data stored in the database
for a wider group of people to benefit of. The
prototype constructed cleared the understanding of
KEOD 2011 - International Conference on Knowledge Engineering and Ontology Development
150

the mechanisms for ontology implementation.
Finding common concepts on the domain
knowledge was a good exercise during the project,
although agreement on concepts was hardly reached
among hydrologists when data scale changes.
The creation of the ontology added semantics to
data which in turn made data more easily accessible.
The ontology provided independence to internet
users who are not familiar with technical terms.
People find the information they need from the
database in straightforward manner with no use of
meaningless numbers or codes. The ontology had
also brought benefits to interoperate geographic
information system and database applications. By
adding meaning to data with the creation of ontology
for a real time meteorological and hydrological
observation network, the expectation is that a greater
number of people and applications will benefit with
ease and independence that the internet provides.
The integration of the ontology to automatically
capture the instances from the Oracle database is
still a research project to be carried out.
REFERENCES
Síntese Anual da Agricultura de Santa Catarina 2007-
2008. (2008). Florianópolis, SC: Epagri/Cepa.
Chandrasekaran, et al., 1998. Ontology of Tasks and
Methods. In: Proceedings of the Workshop on
Applications of Ontologies and Problem-Solving
Methods, held in conjunction with ECAI'98, Brighton,
UK, p. 31-43.
Conner, G., 2004. History of Weather Observations
College Hill, Ohio. Weather, (October).
El-Diraby, T. A. & Lima, C., 2005. Domain taxonomy for
construction concepts: toward a formal ontology for
construction knowledge. Journal of computing in civil
engineering, 19 (October), p.394.
Fensel, D.; Hermelen, F. van. On-To-Knowledge: Content-
Driven Knowledge Management Tools through
Evolving Ontologies. Retrieved from: http://www.
ontoknowledge.org/downl/del33.pdf, 2008
Gennari, J. H., et al., 2003. The Evolution of Protégé: An
Environment for Knowledge-Based Systems
Development. International Journal of Human-
Computer Studies, 58, pp. 89-123.
Gómez-Pérez, A, et al., 2004. Ontologic Engineering: with
examples from the areas of knowledge management, e-
commerce and the semantic web. Springer-Verlag.
Heijmans, J., 2002. An introduction to distributed
visualization. Delft University of Technology, p.74.
Knublauch, H., 2002. An Agile Development Methodology
for Knowledge-based Systems. Ulm: University of
Ulm, 2002. 216 p. Doctoral Thesis: University of Ulm,
Berlin.
Noy, N. F. and Mcguinness, D. L., 2000. Ontology
Development 101: A Guide to Creating Your First
Ontology. Stanford Knowledge Systems Laboratory
Technical Report KSL-01-05, pp.1-25.
Oberle, D. et al., 2004. An extensible ontology software
environment. In Handbook on Ontologies,
International Handbooks on Information Systems. p.
311–333.
Oblack, R. A History of the Development of the National
Weather Service 1753-1891. Weather History:
Meteorological Agencies in the United States.
Retrieved from: http://weather.about.com/od/
weatherhistory/tp/Signal_Service.htm , 2011.
Rautenberg, S. et al., 2008. Uma Metodologia para o
Desenvolvimento de Ontologias Revista Ciências
Exatas e Naturais, 10(2), pp.237-262.
Russell, S. and Norvig, P. Artficial Intelligence: A Modern
Approach. Prentice-Hall, Saddle River, NJ, 1995, 946 p.
Sant´Anna-Neto, J. L., 2003. A Gênese Da Climatologia
No Brasil: O Despertar de Uma Ciência. Geografia,
28(1), pp.5-27.
Schreiber, G., et al., 2000. Knowledge Engineering and
Management. The CommonKADS Methodology.
London: MIT Press, 455p.
Weiten, M., 2009. OntoSTUDIO
®
as a Ontology
Engineering Ontology Engineering Tools: State of the
Art. In Journal of Web Semantics, pp. 51-60.
AN ONTOLOGY FOR A HYDRO-METEOROLOGICAL OBSERVATION NETWORK
151
