
SOLVENCY ASSESSMENT IN AN UNBALANCED SAMPLE
Javier De Andrés, Pedro Lorca
University of Oviedo, Faculty of Economy and Business, Department of Accounting
Avda. del Cristo s/n, Oviedo 33006, Spain
Fernando Sánchez-Lasheras
University of Oviedo, Department of Construction and Manufacturing Engineering
Campus de Gijón, Edificio 5, 33204 Gijón, Spain
Francisco Javier de Cos-Juez
University of Oviedo, Department of Exploitation and Exploration of Mines, C/ Independencia, 13, Oviedo 33004, Spain
Keywords: Solvency, Unbalanced sample, Self organized maps (SOM), Multivariate adaptive regression splines
(MARS).
Abstract: This paper proposes an improved approach to the assessment of firms’ solvency. First, sound companies are
classified into clusters according to their financial similarities by using Kohonen’s Self Organizing Maps
(SOM). Then, each cluster is replaced by a director vector which summarizes all the companies that the
cluster includes. The next step is the estimation of a classification model through Multivariate Adaptive
Regression Splines (MARS). For the test of the model we considered a real setting of Spanish enterprises
from the construction sector. In this dataset the proportion of distressed firms is very close to that which is
derived from Economic statistics. Our results indicate that our system performs better than two
benchmarking models, namely a back-propagation neural network and a simple MARS model.
1 INTRODUCTION
During the last years the importance of bankruptcy
forecasting models is very high due to the current
financial crisis, which demands an even more
careful management of financial resources.
Furthermore, under Basel II Accord
recommendations (Bank for International
Settlements, 2006), banks which choose to develop
their own empirical model to quantify required
capital for credit risk (Internal Rating-Based
Approach) are required to maintain less capital than
those using the Standardized Approach.
The model applied in the present research is
considered as an hybrid system (HS). HS combine
two or more intelligent techniques in several forms
to derive the advantages of all of them. Most HS
require a considerable amount of data to reach to
accurate estimations. This is not a problem
nowadays, as there exists publicly available
databases containing financial information of listed
and unlisted firms.
However, studies using HS for bankruptcy
prediction suffer from a drawback which is that the
majority of them estimate the model upon the basis
of a sample in which non-failed companies are
underrepresented. In most cases a matched-pairs
design is used. The selection of non-failed firms is
arbitrary, which makes the model to achieve a high
in-sample percentage of correct classifications but it
is likely to be inaccurate for failure prediction in
new cases drawn from a real population.
Another strategy is to consider a “real”
population as the sample. That is, to consider all the
companies for which we have financial information
available. However, as only a very small percentage
of firms enter into financial distress in a normal
economic situation, such samples are very
unbalanced. This causes coefficient instability and
leads to poor performance ability of the models
(Foglia et al., 2001).
283
De Andrés J., Lorca P., Sánchez-Lasheras F. and De Cos-Juez F..
SOLVENCY ASSESSMENT IN AN UNBALANCED SAMPLE.
DOI: 10.5220/0003620202830286
In Proceedings of the International Conference on Knowledge Management and Information Sharing (KMIS-2011), pages 283-286
ISBN: 978-989-8425-81-2
Copyright
c
2011 SCITEPRESS (Science and Technology Publications, Lda.)

As an alternative to both strategies we propose a
HS model where, upon the basis of a real population
of firms, data are preprocessed to summarize the
information of healthy firms. So, the initial
unbalanced sample is transformed into a balanced
one which retains the main features of the healthy
firms. Self Organized Maps (SOM) is used in this
stage. Then a classification device is developed upon
the transformed sample, for which we use the
Multivariate Adaptive Regression Splines (MARS)
approach. The results are compared with
benchmarks which are popular in bankruptcy
prediction literature. As an important application of
the combined approach, this paper applies it to the
solvency assessment of Spanish construction firms.
2 THE DATABASE AND THE
FINANCIAL RATIOS FOR
PREDICTING BANKRUPTCY
In the present research a database with Spanish
construction firms was drawn up. As bankrupt
companies we considered those whose judicial
declaration took place in 2008. In accordance with
Spanish legislation, limited liability companies are
required to deposit their annual accounts in the
Registro Mercantil. We deleted from the sample
companies that did not provide full information
about all the variables from the year prior to
bankruptcy. To avoid the distortions small
enterprises whose annual accounts are were also
deleted from the database (firms whose total assets
were below 100K €) We obtained a final data set
that was made up of 63.107 firms. Of these, a total
of 256 companies went bankrupt in 2008.
In this paper we used the five variables proposed
by E.I. Altman in his seminal paper on the
usefulness of linear discriminant analysis (Altman,
1968). Therefore, the five variables used in this
paper are the following: working capital/total assets
(X1), retained earnings/total assets (X2), earnings
before interest and taxes (EBIT)/total assets
(Altman, 1993) (X3), book value of equity/book
value of total debt (X4), and sales/total assets (X5).
3 ALGORITHM AND
ANALYTICAL PROCEDURE
3.1 The proposed Hybrid Model
The model proposed in the present research combi-
combines the use of MARS models with a clustering
technique which is SOM mapping in order to obtain
a MARS model which uses as training information
only those companies considered as representative
of each cluster. A more detailed explanation of the
steps of the algorithm is presented below.
Step 1: Study of the similarities of the bankrupt
companies by means of Mahalanobis distances. The
Mahalanobis distance is a non-euclidean distance
measure (Mahalanobis, 1936) based on correlations
between variables.
Step 2: Those bankrupted companies that were more
dissimilar to the rest of the sample were signalled as
outliers and removed from the data set to be
employed for step 3 although they were taken into
account for the training and validation of the model.
The determination of the bankrupted companies
considered as outliers was done by means of the
robust estimation of the parameters in the
Mahalanobis distance (Rousseeuw and Van
Zomeren, 1990) and the comparison with a critical
value of the Chi-square distribution (in our case the
95% quantile).
Step 3: The Mahalanobis distance of each one of the
non-bankrupt companies versus the set of all the
bankrupted companies not considered as outliers
was calculated.
Step 4: A new category of companies was created,
which was called “borderline”. The companies that
were not considered as outliers when compared with
the sample of bankrupt companies are supposed to
be more likely to go bankrupt than the rest of non-
bankrupted companies. Therefore they were
included in this new category.
Step 5: Companies belonging to non-bankrupted and
borderline populations were classified in clusters
using the SOM algorithm (Kohonen, 1995). Several
clusters of different dimensions were defined and
trained with the non-bankrupted and borderline sets.
This step is performed in order to obtain a more
balanced set of data for the training of the models in
the next steps.
Step 6: An algorithm based on MARS (Friedman,
1991) was then used to implement a different model
for each set of clusters. These models are estimated
in order to determine the number of clusters that best
represents the initial set of data. Every MARS model
was then applied to the initial set of bankrupt and
non-bankrupt companies and the performance of
each one was evaluated by means of their specificity
and sensibility (more details on this point are
provided below).
KMIS 2011 - International Conference on Knowledge Management and Information Sharing
284
Step 7: The last step of the algorithm consisted in
the training and validation of a MARS model using
the number of clusters with the best performance in
step 6.
4 RESULTS
In this section we detail the results of the algorithm,
as well as those of the benchmark techniques.
4.1 The Algorithm
First, table 3 details the number of clusters for each
model. All companies belonging to non-bankrupt
and borderline populations were classified in
clusters using SOM. The clusters were obtained as
the output of step 5 of the algorithm. As can be
observed, the minimum number of clusters used for
the models is 144. This means that the original SOM
was of
)1212(
neurons. Please note that each
cluster is represented by a director vector. A director
vector (Perner, 2008) can be described as the
expected value for each one of the independent
variables for all the companies that belong to a
certain cluster. As it was already mentioned before,
this step was performed in order to obtain a more
balanced set of data for the training of the models in
the following steps in which each cluster was
represented by a director vector that aims to
summarize the information of all the individuals
contained in each subset. Table 1 shows the number
of clusters that were used and in which model they
were employed. Please note that all the models were
trained using the 204 bankrupted companies.
Table 1: Number of clusters used for each model.
Model name
Number of director vectors (clusters)
Non-bankrupt companies Borderline companies
M1 144 144
M2 169 169
M3 196 196
M4 225 225
M5 256 256
M6 289 289
M7 324 324
M8 361 361
M9 400 400
An algorithm based on MARS models (step 6)
was afterwards used in order to implement a
different model for each set of clusters. The
intention of these models is to determine the number
of clusters that best represents the initial set of data.
In order to reach this aim, all the models were
trained using a set which comprises (a) all the
bankrupted companies, (b) the director vectors
corresponding to non-bankrupt non-borderline
companies and (c) the director vectors
corresponding to borderline companies. The
validation was made by calculating the confusion
matrix using the information of the original
database. Table 2 shows the average percentage of
correctly classified companies in the five runs of
each model. The last column of the mentioned table
represents the total percentage of companies of the
database that were correctly classified by the model.
This is the most important parameter as it gives us
an outlook of the global performance of the model.
It is noticeable that although no maximum degree
value was imposed to the MARS models all the
models from M1 to M9 were of degree 3.
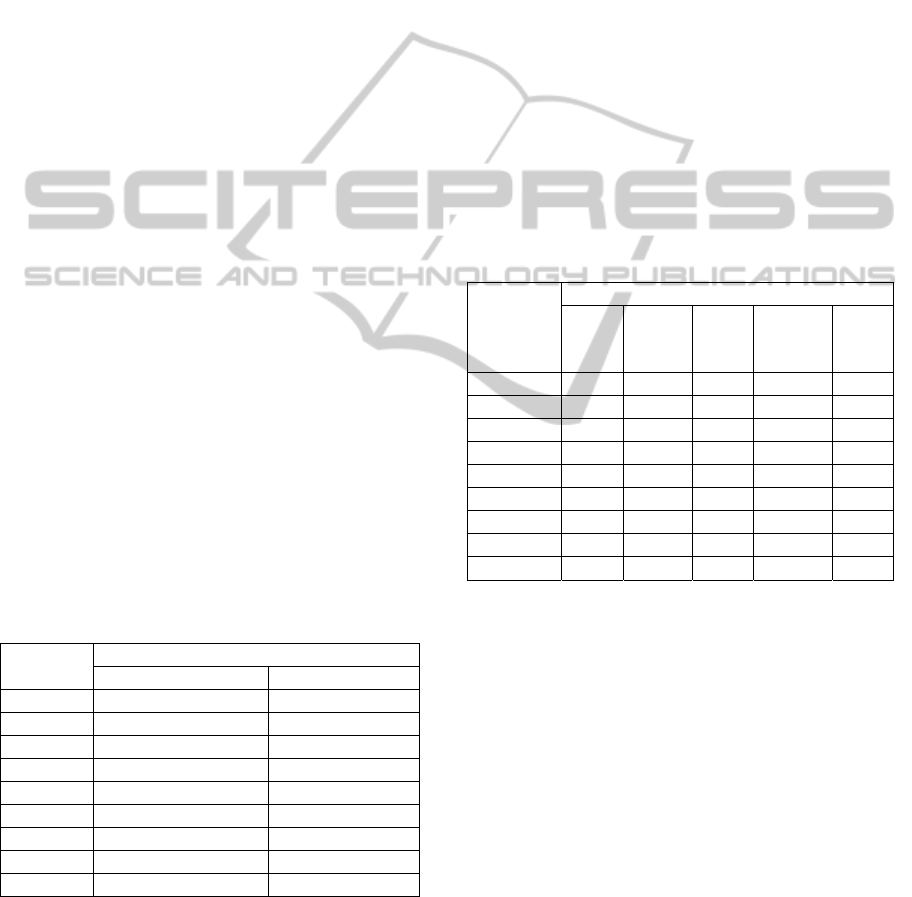
Table 2: Average percentage of companies that are
correctly classified in their corresponding category.
Model
name
% of companies correctly classified
Bankr.
Non-
Bankr.
Bord.
Non-
bankr.
+Bord.
Total
M1
88.10
57.50 89.70 82.51 79.16
M2
88.30
58.30 90.70 83.46 79.94
M3
88.90
59.80 91.20 84.19 81.18
M4
88.90
60.30 91.30 84.38 81.96
M5
88.70
60.40 91.60 84.63 84.29
M6
88.50
60.60 92.30 85.22 85.22
M7
87.90
62.80 91.50 85.09 85.09
M8
87.30
61.30 87.20 81.42 81.43
M9
85.40
58.80 83.20 77.75 77.78
According to the results of Table 2, the model
with the highest performance was M6 although their
results were very close to M7 and that was the
reason why in the last step of the algorithm two
MARS models were validated and trained using as
input information the numbers of clusters defined by
both M6 and M7. Finally, step 7 consisted in the
training and validation of M6 and M7. We used as
input information the whole database and performed
five runs in which 80% of the information was used
for training and the other 20% for validation.
Table 3 contains a confusion matrix in which the
mean values obtained in the validation of the results
of the five different M6 MARS models are shown.
Please note that the results of model M7 are not
presented as they were slightly worst than those
obtained for M6.
SOLVENCY ASSESSMENT IN AN UNBALANCED SAMPLE
285
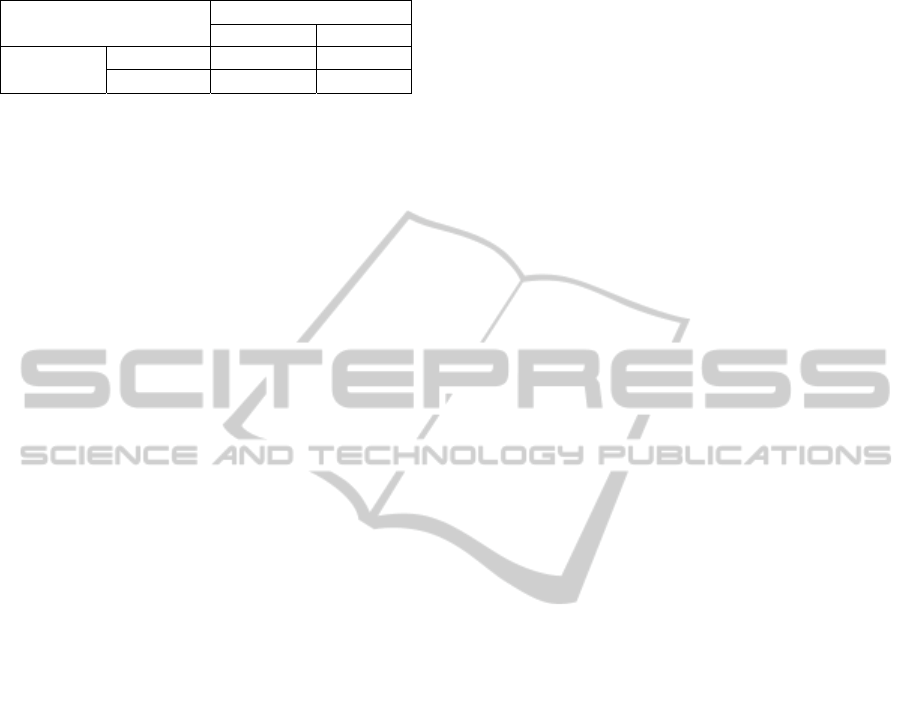
Table 3: Confusion matrix: average values of the
validation results of 5 different M6 MARS models trained.
Real category
Non-bankr. Bankr.
Predicted
category
Non-bankr. 11,513 6
Bankr. 1,339 46
In addition, according to the information
contained in Table 3 it must be remarked that the
specificity of the model is 89.58%, that is, it is able
to detect 89.58% of the companies that did not go
bankrupt. It also detects 88.46% of all those
companies that went bankrupt (sensitivity). Finally,
we must also underline that the global accuracy of
the model is 89.58%.
4.2 Benchmark Techniques
As indicated above, the benchmark techniques used
to compare with the results obtained by the
algorithm proposed in the present paper were two:
back propagation NN and MARS. The model has 5
neurons in the input layer and 7 in the intermediate.
The MARS model obtained was of degree 2
although no maximum degree condition was
imposed.
For the estimation of the accuracy of NN and
MARS, we followed a procedure similar to that
proposed to test the accuracy of the proposed
algorithm. NN and the MARS model were applied to
five random selected training data bases (80% of the
data chosen at random) and tested over their
corresponding validation subsets (the remaining
20% of the database).
For the case of the NN model, the results
obtained in the five runs yielded an average
specificity of 99.95%, an average sensitivity of
21.00% and an average global accuracy of
99.01%.Although the specificity the NN-based
device is higher than that of our proposal, it is
inefficient for the detection of bankrupt companies,
due to its low sensitivity. This makes this model
useless for decision-aid purposes because the costs
of the error consisting in considering a bankrupt
company as non-bankrupt are very much higher than
that of the opposite error.
The results obtained for the simple MARS model
were as follows: average specificity of 99.79%,
average sensitivity of 3.85% and average global
accuracy of 99.78%. These results are even worse
than those of NN, so it can be concluded that the
simple MARS model is also useless for practical
purposes.
5 SUMMARY, CONCLUDING
REMARKS AND FURTHER
RESEARCH
This paper proposes a new approach to the
forecasting of firms’ bankruptcy. Our proposal is a
hybrid method in which sound companies are
divided in clusters according to their financial
similarities and then each cluster is replaced by a
director vector which summarizes all of them. In
order to do this, we use SOM mapping. Once the
companies in clusters have been replaced by director
vectors, we estimate a classification model through
MARS.
We used two benchmark techniques to compare
with the results obtained by the algorithm proposed
in the present paper: a back propagation neural
network and a MARS model.
Our results show that the proposed hybrid
approach is much more accurate than the benchmark
techniques for the identification of the companies
that go bankrupt. As future research efforts we can
mention the application of the procedure proposed in
the present research to other related tasks in the field
of financial statements analysis (i.e. prediction of
takeovers, analysis of bond ratings, etc.).
REFERENCES
Altman, E. I., 1968. Financial ratios, discriminant analysis
and the prediction of the corporate bankruptcy, Journal
of Finance, 23, 589-609.
Altman, E. I., 1993. Corporate Financial Distress and
Bankruptcy, New York: John Wiley and Sons.
Bank for International Settlements (BIS), 2006.
International Convergence of Capital Measurement
and Capital Standards. A Revised Framework, Basel:
BIS.
Foglia A., Iannotti S., Marullo-Reedtz, P., 2001. The
Definition of the Grading Scales in Banks’ Internal
Rating Systems. Economic Notes, 30, 421-456.
Friedman, J. H., 1991. Multivariate adaptive regression
splines. Annals of Statistics, vol. 19: 1-141.
Kohonen T., 1995. Self-Organizing Maps, Berlin:
Springer-Verlag, 1
st
edition.
Mahalanobis, P. C., 1936). On the generalised distance in
statistics. Proceedings of the National Institute of
Science of India, 12: 49–55.
Perner P., 2008. Advances in Data Mining - Medical
Applications, E-commerce, Marketing, and Theoretical
Aspects. Berlin: Springer-Verlag, 1
st
edition.
Rousseeuw P. J., Van Zomeren B. C., 1990. Unmasking
multivariate outliers and leverage points. Journal of
the American Statistical Association, 85, 633-651.
KMIS 2011 - International Conference on Knowledge Management and Information Sharing
286
