
DEPIVOT – A SOFTWARE PACKAGE TO DESIGN
AND EVALUATE CENTER-PIVOT SYSTEMS
M. I. Valín
1,2
, M. R. Cameira
1
, C. Pedras
1,3
, P. R. Teodoro
1
, J. M. Gonçalves
1,4
and L. S. Pereira
1
1
Biossystems Engineering Research Center, Institute of Agronomy, Technical University of Lisbon
Tapada da Ajuda, 1349-017, Lisbon, Portugal
2
Agricultural College, Viana do Castelo Polytechnic Institute
Refóios do Lima, 4990-706, Ponte de Lima, Portugal
3
University of Algarve, Campus de Gambelas, 8005-139, Faro, Portugal
4
Agricultural College, Coimbra Polytechnic Institute, 3040-316, Coimbra, Portugal
Keywords: Hydraulics design, Sprinkler chart, Database, Performance indicators.
Abstract: This paper presents a simulation model aimed at center-pivot design and support assessing the performance
of systems under operation: DEPIVOT (Design and Evaluation of center PIVOT). The software code was
developed in Visual Basic and includes an Access database. DEPIVOT allows considering performance
criteria for design and to iteratively search better system solutions. The model has two main components: A.
the design of new systems and B. the evaluation of operating systems. The first component starts with the
agronomic design aiming the calculation of the system flow rate; this is followed by the hydraulic design:
(a) computes friction head losses along the lateral; (b) the creation of the sprinkler chart; and (c) the
validation of the sprinkler chart. The second component requires field data to calculate performance
indicators, such as distribution uniformity (DU) and the coefficient of uniformity (CU).
1 INTRODUCTION
Irrigation modelling allows the simulation of the
water distribution by an irrigation system under real
working conditions. Models have been developed in
order to avoid laborious field tests and to design and
improve irrigation systems. Montero et al. (2001)
consider that using a simulation model enables to
reduce water and energy consumption and increases
the efficiency of utilization of these resources.
Center-pivot systems have experienced a wide
diffusion because of its advantages relative to other
irrigation systems such as: 1) high potential for
uniform and efficient water applications, (Qassim et
al., 2008); 2) high degree of automation, (Al-
Kufaishi et al., 2006); and 3) ability to economically
and environmentally apply water and nutrients over
a wide range of soil, crop and topographic
conditions. Center pivot design models have been
reported in the literature for the last fifty years.
Heermann and Heid (1968) developed a model
based on Bittinger and Longenbaugh (1962), which
computed depth, rate, and uniformity of application
along the lateral, when the discharge and wetted
diameter at each sprinkler are specified. James
(1982) investigated the effects of topography on
water distribution and Allen (1989) developed a
program, USUPIVOT, where the user can input
infiltration rate parameters (surface storage,
infiltration pattern, and seal factor), crop parameters
(Etc), irrigation system parameters (working hours
and lateral radius), and the sprinkler pattern
(triangular and elliptic). Heermman et al., (1990)
simulated water distribution along the system
introducing new profiles with a donut design for low
pressure sprinklers. Bremod and Molle (1995) have
considered the pivot discontinuous motion,
determined sprinkler distribution pattern in
laboratory and calculated the water depth received in
each point. Other models have introduced the
calculus of runoff and soil loss in different soils
watered by the same system (Silva, 2006).
This paper presents a software package
(DEPIVOT) to use for the design of center-pivot
systems and for the assessment of the performance
of systems under operation or being designed.
DEPIVOT simulates different sprinkler charts for
the same system configuration and estimates runoff
298
Valín M., Cameira M., Pedras C., Teodoro P., Gonçalves J. and Pereira L..
DEPIVOT – A SOFTWARE PACKAGE TO DESIGN AND EVALUATE CENTER-PIVOT SYSTEMS.
DOI: 10.5220/0003610402980301
In Proceedings of the 6th International Conference on Software and Database Technologies (ICSOFT-2011), pages 298-301
ISBN: 978-989-8425-77-5
Copyright
c
2011 SCITEPRESS (Science and Technology Publications, Lda.)
for each of them. This option allows to compare the
different sprinkler charts based on water
conservation criteria.
2 MODELING APPROACH
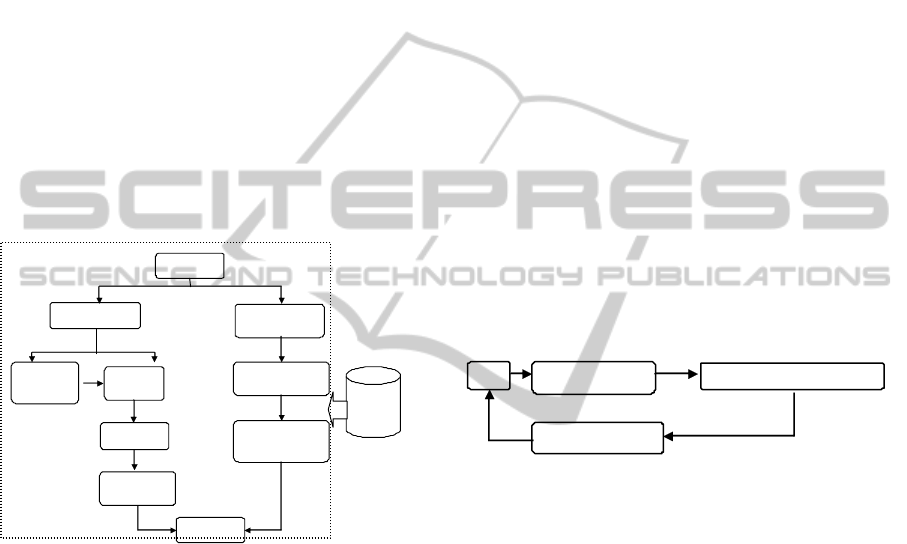
Fig. 1 shows the conceptual structure of the
DEPIVOT software. The software code was
developed in Visual Basic 6.0 and includes a
database in Access. The model has two main
components: A. design of new systems and B.
evaluation of operating systems. The first
component starts with the agronomic design aiming
the calculation of the system flow rate; being
followed by the hydraulic design; and the validation
of the sprinklers chart. The second component uses
field data to calculate the performance indicators,
Distribution Uniformity (DU) and Uniformity
Coefficient (UC) (Pereira and Trout, 1999).
Figure 1: Conceptual structure of the DEPIVOT software.
In the hydraulic design the user makes a first
selection of the span diameter, length and outlet
spacing. Considering the span with a continuous
flow rate (Keller and Bliesner, 1990; Scaloppi and
Allen, 1993) the friction head losses along the lateral
are determined in order to select the adequate
diameter, length and outlet spacing for all the spans.
The most important step of a center pivot design
is the creation of the sprinkler chart. To choose the
most suitable sprinkler for each outlet is necessary to
calculate the type, working pressure and the flow
rate at that point (sprinkler chart). To achieve this
the friction head loss is computed by the stepwise
method, which calculates friction losses in each pipe
length between two consecutive outlets.
The input data required for the calculation of the
required discharge (qi) and pressure (pi) for each
output are the same as those used for span selection,
plus the distance between outlets. The q
i
is the one
that produces the best uniformity along the lateral
and also the ideal pressure (p
i
).
Starting form q
i
, the sprinklers charts can be
obtained directly by the user, manual chart, or by the
model through an optimized automatic approach.
With the first option, the model runs a query to the
database and shows all sprinklers. The user chooses
the sprinkler and the model calculates and shows the
actual discharge as a function of the pressure in that
point. If the optimized sprinkler chart option is
selected, the model, starting at the first outlet,
chooses the sprinkler whose discharge is the nearest
to the required discharge (q
i
, L s
-1
). Afterwards, it
calculates the friction head losses section-by-section
(h
f i,i+1
), thus obtaining the actual pressure (p
ai+1
) at
each outlet as the result of the pressure in the
previous output minus the friction head losses and
the difference in elevation between consecutive
outlets (Figure 2). The flow rate is then calculated
(q
ai+1
) by the discharge-pressure function. The model
runs a new query to the database, being the cycle
repeated for every outlet. The model allows the
storage of several possible sprinkler charts for the
lateral.
Figure 2: Iterative computation of pressure (P
ai
, kPa) and
discharge (q
ai
, ls
-1
) for each outlet i.
Each sprinklers chart can be validated using two
criteria: i) performance indicators; and ii) runoff
calculations. At the sprinkler level, two performance
indicators, the Distribution Uniformity (DU) and the
Uniformity Coefficient (UC) are calculated. For the
second validation the model calculates the potential
runoff (P
R
, mm) for each sprinkler chart selected
previously by comparing the application (P) and
infiltration rate curves (i) as function of time (t).
The DEPIVOT database was developed with
Microsoft Access and can be updated whenever
required. It stores the equipment (sprinklers and
spans) available in the market and the results
(information relating to projects created or
evaluated). For each nozzle inserted in the database,
it is necessary to enter the pairs of maximum and
minimum values of pressure and flow recommended
by the manufacturer. This allows: i) limiting the
operating range of the sprinkler; and ii) calculating
the coefficients k
d
and x to be stored and used to
Start
Desi gn new
syste
m
s
Hydraulic
simulation
Va lid at ion of
emitter chart
End
Evaluation of
operating systems
Input data field
Computation of
perfor mance
indicators
Emitter Chart
Gross
irrigation
requirements
Sp a ns
Em it ters
Systems
q
a
i
h
f i,i+1
(Q
s
-
Σ
q
ai
) P
ai + 1
=P
ai
- h
f i,i+1
- (z
i+1
- z
i
)
q
ai+1
=k
d
(H
ai+1
)
x
DEPIVOT - A SOFTWARE PACKAGE TO DESIGN AND EVALUATE CENTER-PIVOT SYSTEMS
299
calculate the flow rate associated to the pressure
supplied.
3 RESULTS
The model initiates with two options: design of a
new system or evaluation of an operating system.
After choosing the option Design a new system
DEPIVOT allows the user to introduce the system
flow rate as an input or to request the model to use
an algorithm to calculate it by the soil water balance.
This algorithm is feed manually or by importing
WinISAREG model output file to calculate the crop
irrigation requirements.
Once the system flow rate is defined, the user
begins the hydraulic simulation. The user introduces
the system characteristics and selects diameter (D,
mm) and length (L, m) of the span from the
database, including the spacing between outlets (Se,
mm). Selection of all spans is made trough database
consulting, where the equipment characteristics were
previously introduce. The model allows the
installation of a gun in the distal end. If the total
friction losses, is higher than 15% of the working
pressure, a message is displayed indicating the need
to select a different span. The program simulates a
static position for the system, therefore the user must
decide previously which is the most representative
position in terms of the field slope.
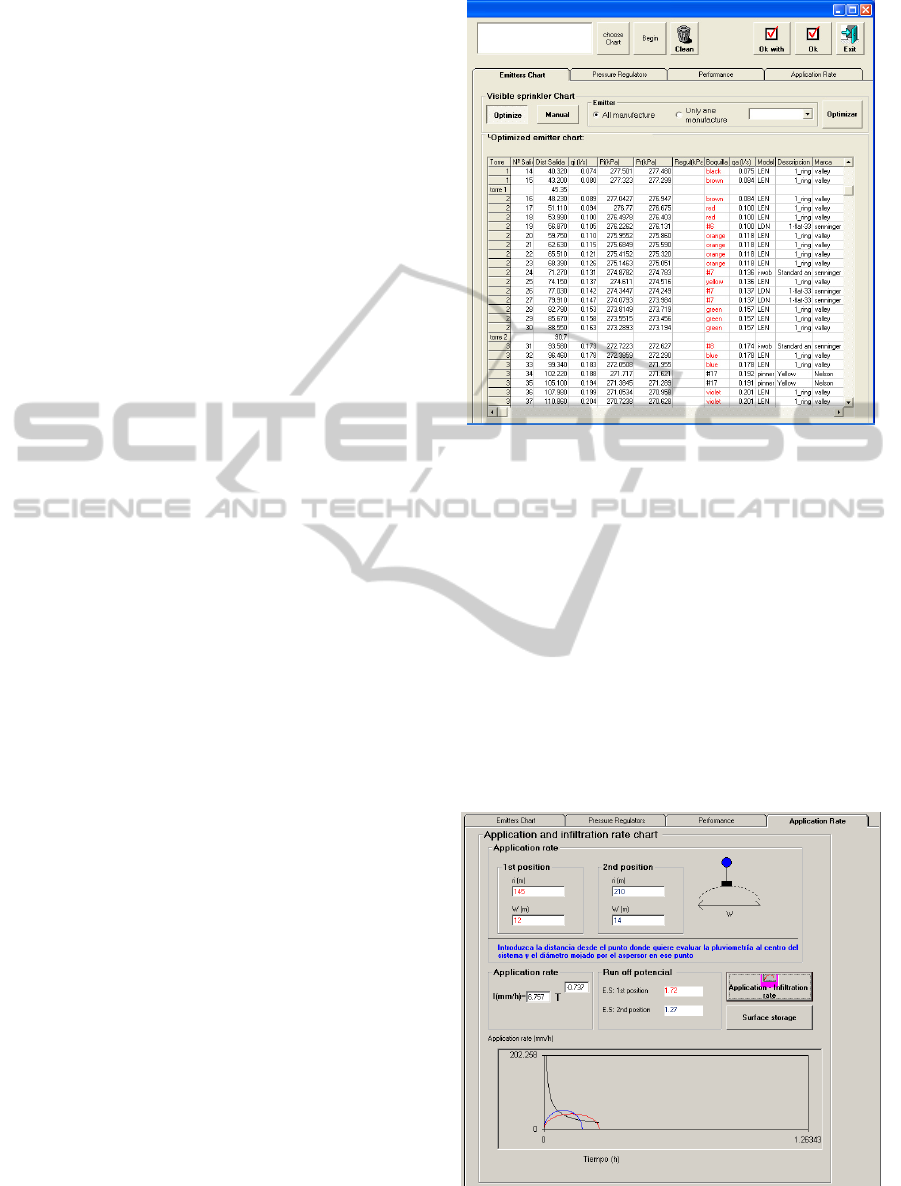
Once the spans are sized, the sprinklers chart is
defined. The sprinklers’ characteristics are acceded
in a specific database. The sprinklers chart (Figure
3) includes for each outlet: the radial distance (ri);
the required discharges (qi) and actual discharges
(qa); the required pressure (Pi) and actual pressure
(Pa); and the identification of sprinklers
(manufacture, model, description and nozzle).
Sprinkler’s selection can be carried out for a given
manufacturer or within the entire database. The
selection may be optimized by the model by
searching, for each outlet i, located at the radial
distance ri from the pivot, the sprinklers that produce
a discharge qai that is the closest to the required one
qi if the available outlet pressure is Pi. In alternative,
the selection may be done by the user, option
Manual. This option allows i) to choose one of the
charts created and individually change each
sprinkler (within a range of 10% of the discharge)
and ii) create a new sprinkler chart that allows to
choose any sprinkler existing in the database. Once
this selection is completed, the sprinkler pressure
and discharge are computed by the iterative process
(Fig. 3).
Figure 3: Window for design the sprinklers chart at each
lateral.
The model allows the association of several
sprinkler charts to each system, to modify them and
store it with different names. Figure 3 shows in red
ink the nozzles that work above the pressure defined
by the manufacturer in the database. If the user
chooses to install pressure regulators its selection is
supported by an additional window where the user
decides in which span should the regulators be
installed and which is the regulating pressure
(PRmax). The model updates the pressure values
and allocates them in column Regul (kPa) in the
sprinklers chart as the pressure used for calculating
the flow rate.
Figure 4: Window for estimating potential runoff and
surface storage.
ICSOFT 2011 - 6th International Conference on Software and Data Technologies
300

The potential runoff computation is supported by
the window shown in Figure 4. Results for potential
runoff are shown graphically and numerically for
two positions. By pressing the button Aplication –
infiltration rate the model presents a dialog box to
insert the number of hours needed for a complete
revolution.
When the model is used to evaluate a system
under operation, first the common data to all
evaluations are introduced (equipment´s
characteristics); second the water depths caught in
catch cans placed along two radius are used to
compute DU and UC. Results are presented in
numerical and graphical formats.
4 CONCLUSIONS
DEPIVOT model is oriented to find solutions for the
critical aspects that limit achieving good
performances in the farmer irrigation practice.
Particular attention has been given to: determining
the irrigation water requirements and the
corresponding system discharge; sizing of the lateral
in order to achieve an adequate variation of pressure;
producing the sprinklers charts; determining the
functioning conditions for every sprinkler;
estimating the runoff potential; and defining the
main information for system management in
practice. The model is presented in WINDOWS
environment, with a structure between windows and
with a set of databases that can be consulted and
altered from the model itself. Once developed, the
model has been tested with results of field
evaluations. These results show that the model is
able to respond to the objectives that led to its
development, which are to assist farmers and
technicians in selecting and designing new centre-
pivot systems and to identify operational
performance problems and respective solutions.
ACKNOWLEDGEMENTS
The support by CEER - Biosystems Engineering
(POCTI/U0245/2003) and the research project
PTDC/AGR-AAM/105432/2008 funded by
Portuguese Foundation for Science and Technology
are acknowledged.
REFERENCES
Allen, R. G., 1989. USUPIVOT: Center pivot nozzle
selection computer software user´s manual.
Department of Agriculture and Irrigation Engineering,
Utah State University, Logan, Utah, 15.
Al-Kufaishi, S. A.,·Blackmore, B. S., H. Sourell 2006.
The feasibility of using variable rate water application
under a central pivot irrigation system. Irrig Drainage
Syst 20:317–327.
Bittenger, M., W., Logenbraugh, R. A., 1962. Theoretical
distribution of water from a moving irrigation
sprinkler", Transactions of the ASAE 5(1): 26-30
Bremond B., Molle, B., 1995. Characterization of rainfall
under centre pivot. Influence of measuring procedure.
Journal of Irrigation and Drainage Engineering ASCE
121 (5): 347 – 353
Heermann, D. F., Hein, P. R., 1968. Performance
characteristics of self-proped center-pivot sprinkler
irrigation system. Transactions of the ASAE 11(1): 11-
15
Heermann, D. F., Wallender, W. W., Bos, G. M, 1990.
Irrigation eficiency and Uniformity. In: Hoffman, G.
J., Howell, T. A., Solomon, K. H. (Eds.), Management
of Farm Irrigation Systems. ASAE, St. Joseph, MI,
125 -149.
James, L. G., 1982. Modeling the performance of center
pivot irrigation systems operating on variable
topography. Transactions of the ASAE 38(1): 143-149.
Keller, J. y Bliesner, R. D., 1990. Sprinkle and Trickle
Irrigation Van Nostrand Reinhold. New York.
Montero, J., Tarjuelo, J. M., Carrión, P. 2001. Nueva
versión del modelo de simulación de riego por
aspersión SIRIAS. In: XIX Congreso Nacional de
Riegos, AERYD, Madrid, CD-ROM paper C-18.
Pereira, L. S., Trout T. J., 1999. Irrigation Methods. In:
HN van Lier, LS Pereira, FR Steiner (Eds.) CIGR
Handbook of Agricultural Engineering, Vol. I: Land
and Water Engineering, ASAE, St. Joseph, MI, pp.
297-379
Qassim, A., Dunin F., Bethume M. (2008). Water balance
of center pivot irrigated pasture in northern Victoria,
Australia. Agric. Water Manag. 95, 566-574
Scaloppi E. J., Allen R., 1993. Hydraulics of Center-Pivot
laterals. Journal of Irrigation and Drainage
Engineering ASCE 119 (3): 554-567
Silva, L. S. (2006) The effect of spray head sprinklers with
different deflector plates on irrigation uniformity,
runoff and sediment yield in a Mediterranean soil.
Agric. Water Manag. 85, 243-252
DEPIVOT - A SOFTWARE PACKAGE TO DESIGN AND EVALUATE CENTER-PIVOT SYSTEMS
301
