
A SIMULATION STUDY FOR OPTIMIZING THE
PERFORMANCE OF SEMI-LAYER DELTA NETWORKS
Eleftherios Stergiou
1
and John Garofalakis
2, 3
1
Department of Informatics and Telecommunications Technology, Technological Educational Institute of Epirus, Arta, Greece
2
Department of Computer Engineering and Informatics, University of Patras, Patras, Greece
3
Research Academic Computer Technology Institute, Rion, Patras, Greece
Keywords: Delta network, Banyan networks, Performance evaluation, Buffer, Multilayer multistage interconnection
networks.
Abstract: In this paper, a semi-layer multistage delta network is presented and exemplified considering various values
of buffer size by using simulation. The proposed network configurations are evaluated and compared with
each other. A performance evaluation was conducted via our simulator assuming uniform conditions and
arrivals of Bernoulli type. Performance statistics were collected for the two most important performance
indicators of the network that is throughput and packet latency. From this study emerges the appropriate
configuration of single and semi-layer delta networks in terms of buffer size. The evaluation methodology
can be applied to several network configurations, providing the basis for a fair comparison, and the
necessary data for network engineering to optimize the performance of semi-layer delta networks.
1 INTRODUCTION
Multistage Interconnection Networks (MINs) are
used for interconnecting processors in parallel
systems and to ensure efficient internetworking
(Suet, 2004). The advantages that they have, include
their ability to route multiple communication tasks
concurrently, as well as their low cost/performance
ratio. Banyan MINs are MINs which have the
property of the existence of one, and only one path
between each source and destination. On the other
hand, the non-banyan interconnection networks are
more expensive and more complex to manage.
This paper is a study of the performance
optimization of semi-layer multistage delta
networks. Delta networks are a subclass of banyan
networks. The Delta networks properties are
explained in the next section.
Performance evaluation methods for delta
networks (or in general banyan networks) mainly
include analytical methods, Petri nets modelling and
simulation.
Analytical methods are considered in general to be
complex. Nevertheless, they have been extensively
used by some researchers. Most of the MIN analysis
focuses on uniform traffic (i.e. packages) coming to
a network with an equal probability of reaching any
output (Hsiao and Chen, 1991), (Bouras et al.,
1987). On the other hand, there are numerous non-
uniform traffic patterns in real applications that
require special treatment. One such non-uniform
approximation can be seen in (Tutsch and Hommel,
2002). Other typical analytical studies of a MIN’s
performance are exemplified by various studies
(Garofalakis and Stergiou, 2008), (Bouras et al.,
1987), (Garofalakis and Spirakis, 1990).
Petri nets serving as MIN modelling methods
have also been employed. The (German, 2000),
(Haas, 2002) and (Linderman, 1998) are examples of
such approaches. Petri nets methods are also
considered complex. When there is an interest in
more realistic results, simulations are used.
Simulations allow flexibility in network parameters,
making it possible to analyze the network with
different communication patterns. Examples of such
approaches are (Vasiliadis at al., 2006), (Vasiliadis
et al., 2007), (Vasiliadis et al., 2008). All the above
cited studies involve single layer multistage
interconnection networks (SiLMINs).
Dietmar Tutsch and his group (Tutsch and
Hommel, 2008) introduced multilayer multistage
interconnection networks (MLMINs). Firstly, they
demonstrated that the single layer MINs show a high
saturation when the packets population is increased
257
Stergiou E. and Garofalakis J..
A SIMULATION STUDY FOR OPTIMIZING THE PERFORMANCE OF SEMI-LAYER DELTA NETWORKS.
DOI: 10.5220/0003598202570265
In Proceedings of 1st International Conference on Simulation and Modeling Methodologies, Technologies and Applications (SIMULTECH-2011), pages
257-265
ISBN: 978-989-8425-78-2
Copyright
c
2011 SCITEPRESS (Science and Technology Publications, Lda.)

dramatically. The MLMINs were developed mainly
to meet the need for efficient handling of multicast
traffic (Tutsch, 2006). MLMINs are more suitable
fabrics for modern traffic as well as on-line
multimedia applications, which are increasing in
importance.
The main weakness of the MLMIN architecture
is attributed to the exponentially growing number of
layers as the stages increase, which leads to higher
costs. If we try to reduce the number of layers then
hardware complexity is reduced and, therefore, so is
the overall cost of the fabric.
Semi-Layer MINs (SeLMINs) are special cases
of the multi-layer MIN. SeLMINs are defined
(Garofalakis and Stergiou, 2009), (Garofalakis and
Stergiou, Oct 2010) as a multilayer MIN which
consists of two segments. The second segment must
keep the levels growth fixed and equal to the Switch
Element (SE) size. The second segment of the MIN
is an unblocked segment. Figure 2 illustrates
examples of two SeLMIN cases in 2D view, which
have two and four layers, respectively.
When the layers of a SeLMIN are Delta type
multistage networks, we have semi-layer multistage
Delta type networks, which are the kind of networks
being studied here.
These multistage fabrics are devices which can
be constructed using a finite buffer size. However,
the main question which arises is: what is the
suitable buffer size in each case of traffic? This work
tries to provide an answer to this question.
Hence, the main goal of this paper is to evaluate
the performance of semi-layer delta type networks
assuming the offered load is of unicast type, for
different buffer size constructions. Ultimately, the
objective is to determine the buffer size which
optimizes throughput and packet latency.
Performance evaluation was conducted through
simulation, considering uniform traffic conditions.
Metrics were collected for the two major important
network performance factors, which is throughput
and packet latency.
The remainder of this paper is organized as
follows: in section II, a brief analysis of a semi-layer
delta network, which is the main research subject, is
presented. Subsequently, in section III, the
performance criteria and parameters that are related
to the above network schemes, are presented.
Section IV reveals the results of our simulation-
based performance analysis, examining the effect
that the buffer size has on overall network
performance. Finally, section V provides concluding
remarks.
2 DEFINITION OF MULTILAYER
DELTA NETWORKS
A typical multistage (
NxN
) MIN is constructed by
NL
c
log
=
parallel stages of (
cxc
) Switch
Elements (SEs), where c is the degree of the SEs.
Each stage contains
)/( cN SEs. Hence, the total
number of SEs of a MIN is equal to
NcN
c
log)/(
⋅
. Thus, there are
)log( NNO
⋅
interconnections between all the
stages, in contrast to the crossbar network that has
)(
2
NO links. Also, a MIN is distinguishable from
the others if we know, except of its topology, the
switching techniques and the routing algorithm used.
The fabrics examined here use the store and forward
switching technique and shuffle perfectly as a
routing algorithm. The routing is performed in a
pipeline manner, which means the routing process
occurs in every stage, in parallel.
The whole network operates “synchronously”,
which means that the time cycles refer to global
clock ticks. The network clock consists of two
phases. In the first phase, the queues are serviced
and then any new packets are received.
Moreover, each MIN operates under the following
assumptions:
The service time of the output queues at each
switch is assumed to be fixed and equal to the
network cycle time.
The traffic feeding the first stage of the MIN
switch follows a Bernoulli type distribution, so
the arrivals are considered independent from
each other. If (
k ) is the random variable
denoting the count of arrivals of packets at the
end of a network cycle on a queue of a
cc
×
SE at the first stage of the MIN, the formula is
(Garofalakis, 2008):
⎪
⎩
⎪
⎨
⎧
≤≤
⎟
⎠
⎞
⎜
⎝
⎛
−
⎟
⎠
⎞
⎜
⎝
⎛
⎟
⎟
⎠
⎞
⎜
⎜
⎝
⎛
=
−
otherwise
kcfor
k
p
k
p
c
k
x
ckc
ck
,,0
0,1
)1(
,
(1)
Where
)1(
,ck
x : depicts the probability of ( c ) packets
accepted in an arbitrary first stage queue with in
general (
k ) inputs at an arbitrary time cycle.
However, usually the under study systems have
2
=
k inputs, hence the c can be 0, 1 or 2 at the
most.
Also
p
depicts the probability of packets arrivals in
SIMULTECH 2011 - 1st International Conference on Simulation and Modeling Methodologies, Technologies and
Applications
258

an arbitrary input of a random first stage queue of
the switch system at an arbitrary time cycle.
All the packets are considered to have identical fixed
sizes.
Any arrived packet at the first stage is lost if the
relevant buffer of the SE is full.
Each queue uses the FIFO policy for all output
ports.
Any packet will be blocked at a stage, if the
destination buffer at the next stage is full.
At the last stage, output links of the MIN
signify that there is no blocking.
All packet conflicts are randomly resolved and the
routing logic at each switch is fair.
2.1 Delta Networks Property
Delta networks were proposed by Patel (Patel.
1981). Delta networks which belong to banyan
property networks, are usually used to connect a
significant number of processors in a multiprocessor
system.
In general, delta networks are constructed by
21
xcc Switch Elements (SE) (Figure 1). Let’s
consider
j
o an output of a random SE,
where
1,...,,1,0
2
−= cj . If an input of a SE in
i
stage is connected to an output of another SE in
stage
)1( −i , then all the other inputs must be
connected to outputs
j
o of the same index
j
of SE
in the previous stage.
21
cc ×
21
cc ×
21
cc ×
21
cc ×
21
cc ×
21
cc ×
…………………….
…………………….
…………………….
….
….
….
….
….
….
….
….
….
….
….
….
Stage 1
Stage 2 Stage nShuffle Shuffle
1
1
−c
0
11
cc
n
−
1
1
−
n
c
1
2
−c
0
22
cc
n
−
1
2
−
n
c
I n p u t P o r t s
O u t p u t P o r t s
Figure 1: The general structure of a delta network.
For a banyan MIN of size N and degree c ,
which is denoted as network (
cN, ), suppose that
the switch’s inputs and outputs are presented by
c
,
in the form of
0
d ,
1
d ,…,
1−c
d . If the inputs and
outputs of the SEs in the networks have the same
indexes, then digits
0
d of all inputs of a switch must
be equal.
The above described mathematical translation is
deemed a delta property. All the interconnection
networks which have this characteristic are said to
possess the delta property.
All the SEs in any delta network contains
digitally controlled crossbars. Digitally controlled
SEs are controlled by a sequence of bits that hold all
the packets which have to traverse through the MIN.
In delta networks this sequence of bits represents the
packet destination.
Our study case considers symmetrical SEs with
ccc
=
=
21
, given that it is very common in MINs
systems.
2.2 Semi-layer MINs
Semi-layer MINs are a subclass of MLMINs which
consist of two distinct segments (Figure 2).
The front segment (first stages) of the MIN contains
only one layer which employs a backpressure
blocking mechanism. Replication at the first
segment is not recommended. It is a key challenge to
keep the overall cost of such fabric at low levels.
The second segment encompasses the rest of the
construction. The second segment is the multilayer
segment of a MIN (a full fan-out), which is free of
blocking. If we consider the SEs of second segment
to be represented by
c
cc ×
, then the SeLMINs of the
second segment keep the level growing at a fixed
rate and equal to
c . According to (Tutsch &
Hommel, 1997), the SE’s outputs in the last stage
are multiplexed. In this case, if either the multiplexer
or the data sink do not have enough capacity to
absorb the packets, then at this point blocking can
occur. However, in this study it is assumed that
multiplexers (data sinks) have adequate capacity.
The main drawback of MLMINs is their high cost,
owing to their complexity. Semi-MLMINs were
introduced as a better trade-off between cost and
performance of the multistage fabric, when the
traffic demands are raised to very high levels.
In a SeLMIN (Figure 2), let
SL
L represent the
number of single layer stages and let
ML
L be the
number of stages that have full layer growth which
can also service multicast traffic without blocking.
Hence,
MLSL
LLL
+
=
.
A SIMULATION STUDY FOR OPTIMIZING THE PERFORMANCE OF SEMI-LAYER DELTA NETWORKS
259

Single Layer interconnection network
Semi-Layer interconnection network (4 Layers)
1 234 56 78
1 234 56 78
Outputs
Inputs
256x256 Delta networks
Semi-Layer interconnection network (2 Layers)
1 234 56 78
Inputs
Inputs
Outputs
Outputs
SL
L
ML
L
SL
L
ML
L
L
Figure 2: Literal views of 8 layer delta networks (SiLMIN,
and SeLMINs).
For a given
ML
L the total number of Layers ( NoL )
in the second segment is
ML
L
cNoL = , where c is
the number of inputs per SE (e.g., in the case of 2x4
switches,
c is equal to two).
Due to their appealing performance/cost ratio, the
SeLMINs are expected to play an important role in
the future regarding the overall performance of
internet interconnections, parallel systems and grid
systems.
2.3 Semi-layer MINs with Delta Type
Property
Semi-layer delta networks are multilayer fabrics
where all the layers are maintained in a delta
multistage network, keeping the same permutation
pattern. Throughout this study, a performance
investigation has been employed, exploring typical
semi-layer delta type networks.
Our case study considers SiLMIN with
8
=
L
stages, and SeLMINs with
8=L
stages and
2=NoL and 4, respectively. In addition, we
assume that the under study semi-layer MINs use
typical
22× SEs in the first segment and 42
×
SEs
in the second segment.
3 METRICS & METHODOLOGY
FOR PERFORMANCE
EVALUATION OF
SEMI-LAYER DELTA
NETWORKS
This study will present results of the performance of
SiLMINs and SeLMINs when they service exclusive
unicast traffic. The basic performance metrics used are:
Average throughput of a single layer delta
network (
SL
Th ): Average throughput of a delta
interconnection network is defined as the number of
packets delivered to their destination per time cycle.
Formally,
SL
Th can be defined as:
n
i
Th
n
i
n
SL
∑
=
∞→
=
1
)(
lim
ω
(2)
where
)(i
ω
denotes the number of packets that
reach their destination during the
th
i
time interval.
Using simulations, the throughput is calculated as
the number of packets that arrived at their
destinations over a certain multitude of trials.
Average throughput of semi-layer delta
network (
)(out
Th ): If we consider the throughput of
the first segment of a SeLMIN as (
SL
Th ), then the
total SeLMIN’s throughput (at the fan-out output)
can easily be calculated as follows: In the case of
unicast traffic the formula is:
)()( SLout
ThTh = .
In the case of unicast and multicast traffic the
expression is:
()
ML
L
SLout
wThTh +⋅= 1
)()(
,
where
w
is the ratio of multicast traffic (see
(Garofalakis and Stergiou, 2009), (Garofalakis and
Stergiou, Oct 2010)) for a definition of
w ).
Normalized throughput of single and semi-
layer delta network (
N
Th ): Normalized throughput
of the delta network (
N
Th ) is the ratio of the
average throughput over the network size
N
.
Formally,
N
Th can be defined as:
NThTh
SLN
/
=
: in the case of a single layer
MIN and
NThTh
outN
/
)(
=
: in the case of SeLMINs
Average packet latency of a single layer delta
network (
SL
D ): The packet latency of a delta
network is defined as the number of time units
needed for all packets of a permutation to arrive at
their destinations. Formally,
SL
D can be defined as:
n
it
D
n
i
SL
∑
=
∞→
Δ
=
)(
1
)(
lim
τ
τ
(3)
where
n depicts the total number of packets
accepted by destinations in
τ
time intervals and
SIMULTECH 2011 - 1st International Conference on Simulation and Modeling Methodologies, Technologies and
Applications
260

)(itΔ represents the total number of network cycles
that an arbitrary
th
i
packet needs in order to arrive
at its destination.
)(itΔ
, includes the total number
of network cycles for a packet waiting at any stage
and the total number of network cycles the same
th
i
packet needs to remain in active transmission mode
until it reaches its destination.
The network latency is directly related to the
maximum multitude of time cycles needed to route a
certain number of packets to their destinations via
permutations.
Average packet latency of a SeLMIN delta
network (
out
D ): Assuming that the packet latency
of the first segment is
SL
D , then the packet delay of
a SeLMIN
out
D can be expressed as:
MLSLout
LDD += .
This occurs because in the second segment the
packets don’t suffer from contentions, so the delay
to traverse the second (
ML
L
) stage of the fan-out is
exactly equal to (
ML
L ) time cycles.
Normalized latency of a single and semi-layer
delta network (
N
D ): Normalized packet latency
N
D of a delta network is the ratio of the average
packet latency
SL
D over the minimum packet delay
which is considered as equal to
L number of time
cycles. Formally,
N
D can be expressed by:
In case of single layer MIN:
LDD
SLN
/=
In case of SeLMIN:
LDD
outN
/=
A unique indicator for performance
evaluation of multilayer networks
From the initial experiments it became apparent that
the values of MIN's throughput and the values of
packet latency are inversely proportional to each
other for various values of buffer size.
Nevertheless, the optimal solution is to have high
throughput rates and low values of packet latency.
Hence, it is interesting to have a general evaluation
using only one factor. The factor must reveal the
better overall performance, that is, the first factor
maximized and the second factor minimized
simultaneously. So, this demanding overall
performance factor is defined based on the
correlation of the two individual performance
factors. Because the individual factors have different
measurement units and ranges, it is necessary to
normalize them to obtain a common reference value
domain. We call this factor the Combined
Performance Factor (CPF) which is expressed by
the following formula (Garofalakis and Stergiou,
March 2010):
2
2
1
⎟
⎟
⎠
⎞
⎜
⎜
⎝
⎛
+=
N
N
D
ThCPF
(4)
In any multi-criteria decision-making problem,
however, the importance of each criterion is a design
problem. Therefore, when it is of interest to assign a
weight (in terms of its importance in the network) to
each separate metric, then the above formula can be
replaced by:
DTh
N
DNTh
DTh
ww
D
wThw
wwCPF
+
⎟
⎟
⎠
⎞
⎜
⎜
⎝
⎛
⋅+
=
2
2
1
.
),(
(5)
where
Th
w ,
D
w are the corresponding weights of
the normalized system’s parameters: normalized
throughput and normalized packet latency.
According to this equation, when the
N
Th metrics
become larger and/or the
N
D
metrics become
smaller, the CPF becomes larger. The reference
value domain of CPF ranges from 0 to 1.
The main condition which must be satisfied when
the CPF factor is applied, is the assumption
that
0
≠
N
D . Besides this, all the measured factors
must be calculated and manipulated as inter-
individual metrics.
Hence, as the CPF becomes higher, the
performance of the MIN is considered to have been
improved.
Here we limit our study to two performance
evaluation factors knowing that the proposed
methodology is general, and that it is available to
add additional factors chosen to evaluate the
performance of a MIN.
Consequently, the following parameters affect
the above performance aspects of multistage delta
networks.
Network size
L , where NL
2
log= , is the
number of stages in a (
NN × ) multistage
delta network. In our study it is assumed
that
256
=
N , thus
8256log
2
==L
.
Offered load (
p
) is the steady-state fixed
probability of packet arrivals at each queue on
inputs. In our study,
p
is assumed to be
p
=0.10, 0.20 … 0.50, 0.60 … 1.
Buffer size (
b ) is the maximum number of
A SIMULATION STUDY FOR OPTIMIZING THE PERFORMANCE OF SEMI-LAYER DELTA NETWORKS
261
packets that an input buffer of a SE has the
ability to hold. In our study,
b is assumed to
be
b =1, 2, 3 and 4. In addition to those values
of buffer size, we chose constructions with
higher values of buffer size that are considered
to be extremely expensive fabrics yet not as
good in performance. This happens because the
cost of multilayer delta type fabrics is an
exponential function of the buffer size.
4 SIMULATION AND
PERFORMANCE RESULTS
4.1 Simulation
Here we estimate the performance of multilayer
delta networks using simulations. We are interested
in
)( NN × multilayer delta networks that consist
of
)22( × and )42( × SEs, using internal queues.
We developed a general simulator for SeLMINs that
was capable of handling several switch types and
load conditions which work at the packet level. The
simulator was programmed in C++ and is capable of
running various configuration schemas. In building
the simulator, every
)22(
×
and )42( × SE was
modelled by two buffered queues. Each buffer
operates according to FCFS principle. All the
packets are forwarded by the store and forward
mechanism and in each time slot, they are forwarded
by at most one stage. Cases of packet contention, are
solved randomly with equal probability.
We use as input parameters, the probability of
packet arrivals, the buffer length, the number of
inputs/outputs ports, the number of stages and the
number of layers.
Metrics such as throughput and packet latency
are gathered at the output of the system. The
simulation needs at least
4
10 iterations (clock
cycles) in order to ensure that the system operates in
steady-state operating condition.
4.2 Results
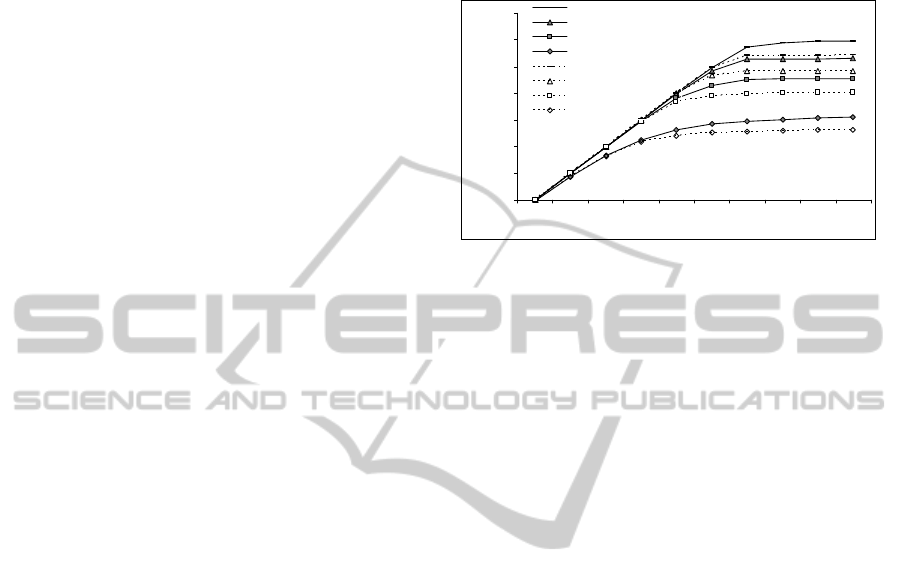
Figure 3 shows the normalized throughput of an 8-
stage SiLMIN and SeLMIN versus the probability of
packet arrivals for MIN’s buffer size
=b 1, 2, 3 and
4 when the offered load is exclusively of unicast
type. The dot-dashed curves depict results for
SiLMINs, while the solid curves illustrate results for
SeLMIN with 4 layers for buffer size
=b
1, 2, 3 and
4, respectively.
From Figure 3 it becomes apparent that the larger
the values of the buffer size in MINs, the greater the
value of the MIN’s throughput.
256x256 delta networks
0.1
0.2
0.3
0.4
0.5
0.6
0.7
0.8
0.1 0.2 0.3 0.4 0.5 0.6 0.7 0.8 0.9 1
(p)~ Probability of packet arrivals
Normalized throughput
BS=4-SeLMIN(NoL=4)
BS=3-SeLMIN(NoL=4)
BS=2-SeLMIN(NoL=4)
BS=1-SeLMIN(NoL=4)
BS=4-Si LMIN
BS=3-Si LMIN
BS=2-Si LMIN
BS=1-Si LMIN
Figure 3: Normalized throughputs vs. probability of packet
arrivals for an 8-stage delta SiLMINs and SeLMINs with
4 layers.
Also, we can notice that the throughput of
SeLMINS – here 4 layer constructions - have higher
values of throughput compared with the
corresponding, in terms of number of stages and
buffer size, single layer MINs. In addition, for
offered load
7.0≥p , throughput stabilization can
be observed in the system due to the high value of
blockings that takes place in the system.
Figure 4 represents the values of normalized
packet latency of 8-stage SiLMINs and SeLMINs
versus the probability of packets arrivals on the
inputs for MINs with buffer size
=b
1, 2, 3 and 4
when the offered load is exclusively of unicast type.
The dot-dashed and solid curves depict results for
SiLMINs and SeLMINs (NoL=4), respectively,
when buffer ranges from 1 to 4.
From Figure 4 it can be seen that the Semi-layer
MINs with 4 delta type layers, and with a single
buffer size, achieve the best values (lower) of packet
latency in comparison to the corresponding
SeLMINs with higher values of buffer size. In
addition, in the single layer MINs, the packets delay
increases sharply, especially for high values of
offered load, as compared to the corresponding
SeLMINs in terms of buffer size. So, it is obvious
that as the buffer size is increased, the packet delay
also deteriorates (values become higher).
The SiLMINs maintain low values (
5.1
≤
N
D )
of packet delay when the offered load is
5.0
≤
p .
On the other hand, the same packet delay values are
achieved when the offered load is
6.0≤p . This
gain which the SeLMINs fabrics have over the
SiLMINs, is owing to the exploitation of the
SIMULTECH 2011 - 1st International Conference on Simulation and Modeling Methodologies, Technologies and
Applications
262

256X256 delta networks
1
1.5
2
2.5
3
3.5
0.1 0.2 0.3 0.4 0.5 0.6 0.7 0.8 0.9 1
(p)~ Probability of packet arrivals
Normalized packet latency
BS=4-Si LMIN
BS=4-SeLMIN(NoL=4)
BS=3-Si LMIN
BS=3-SeLMIN(NoL=4)
BS=2-Si LMIN
BS=2-SeLMIN(NoL=4)
BS=1-Si LMIN
BS=1-SeLMIN(NoL=4)
Figure 4: Normalized packet latency vs. probability of
packet arrivals for 8-stage delta type SiLMINs and
SeLMINs with 4 layers.
additional layers at the last stages, which on one
hand provide routes to packets, and on the other
eliminates the phenomenon of packet collisions, thus
improving the packets’ speed, as they move to the
outputs.
By observing Figures 3 and 4 it is obvious that
the two performance indicators (throughput and
packet delay) are contrary to each other. For a given
MIN’s configuration, when the buffer size is
increased, the throughput follows incrementally
while the packets delay deteriorates. Hence, to
evaluate the system by one general performance
indicator we use the CPF factor which has been
defined above.
4.3 Simulator Validation
To validate our simulator, a single-layer, single
buffer and 6-stage MIN is modelled assuming the
offered load on inputs is of unicast type. The results
that are obtained by our simulations are compared
with the corresponding results reported in other
works of the literature. So, in the case of unicast
traffic, Figure 5 depicts the normalized throughput
versus the offered load on 64x64 MIN inputs for
buffer sizes 1 and 2.
The results of this simulation which include
Figure 5 curves: ‘BS=1 Our Simulation’ and ‘BS=2
Our Simulation’, are almost identical with the results
reported in (Garofalakis and Stergiou, 2008), which
comes from an analytical method.
In addition, results presented by Theimer’s
model in (Theimer et al., 1991) for 64x64 MIN with
b=1, notably showed that the two curves (our
simulation and Theimer’s model) are almost in
complete agreement with each other. On the other
hand, Mun’s model (Mun and Yoon, 1994) (curve:
BS=1 Mun’s and Yoon’s model) deviates
diagrammatically from the other models.
single and double
buffered 64X64 MIN
0.2
0.3
0.4
0.5
0.6
0.7
0.20.40.60.8 1
(p)- probability of arrivals on inputs
Normalized throughput
BS=2 Youn's model
BS=2 Mun's model
BS=2 Our simulation
BS=1 Jenq's model
BS=1 Mun's model
BS=1 Theimer's mode
BS=1 Our simulation
Figure 5: Normalized throughput of a 64x64 MIN vs. the
probability of packets arrivals for b=1 and 2 from various
models.
In the schema herein, it was found that the results
of our simulation for buffer size 2 are in agreement
with the results reported in Mun’s model (Mun and
Yoon, 1994) (curves: BS=1 and BS=2 from Mun’s
model), while the Yoon’s model (Yoon et al., 1990)
(BS=2 from Yoon’s model) deviates significantly.
All the foregoing validates the results from our
simulations.
4.4 Throughput and Latency CPF
Figure 6 shows the Combined Performance Factor
(CPF) for 256x256 Semi-layer MINs with 4 layers
versus the probability of packet arrivals when the
total offered load is of unicast type. Figure 6
illustrated the CPF indicator for fabrics with buffer
sizes equal to 1, 2, 3 and 4, respectively.
For buffer size
4
=
b
, the value of CPF is low
owing to the high packet delay values. It shows
better behaviour but very near the fabrics
with
3,2
=
b . By looking at Figure 6 it is obvious
that the best performance is achieved when the 4
layer SeLMIN has a buffer size equal to 1. This
happens because the delay of packets is significantly
reduced.
Moreover, the performance of a MIN can be
applied and tailored to the needs that a specific type
of load demands.
0.75
0.8
0.85
0.9
0.95
1
0.1 0.2 0.3 0.4 0.5 0.6 0.7 0.8 0.9 1
(p)~Probability of packet arrivals
CPF(1,1)
BS=1
BS=2
BS=3
BS=4
Figure 6: CPF of an 8 stage semi-layer delta MIN vs.
probability of packets arrivals.
A SIMULATION STUDY FOR OPTIMIZING THE PERFORMANCE OF SEMI-LAYER DELTA NETWORKS
263

Figure 7 illustrates the Combined Performance
Factor (CPF) in 8-stage and 4 layer MINs for cases
of applications traffic in which it is necessary to
have extra low prices of packet delay. Therefore, the
calculation of a general CPF indicator considers the
packets delay factor with a weight of 2.
Figure 7 shows that the 4 layer Delta network
with buffer size equal to 1 provides the best
performance. On the other hand, the general
performance indicator (CPF) deteriorates as buffer
sizes increases.
0.5
0.55
0.6
0.65
0.7
0.75
0.8
0.85
0.9
0.95
1
0.1 0.2 0.3 0.4 0.5 0.6 0.7 0.8 0.9 1
(p)~Probability of packet arrivals
CPF(1,2)
BS=1
BS=2
BS=3
BS=4
Figure 7: CPF of an 8 stage semi-layer delta MIN vs.
probability of packets arrivals.
Figures 6 and 7 reveal that the single buffered
SeLMINs are more suitable devices for applications
which demand low values of packets latency and
jitter when considering jitter as a variation of
packets latency. Hence, e.g. applications like
streaming media of voice tracking devices present
better attributes when they are constructed by single
buffers. Contrary to this, cases which require high
throughput rates and are indifferent to the
information’s time transmission, are rather rare.
Finally, the main finding of this study remains that
the single buffered SeLMINs constructions present
optimum performance behavior in terms of
throughput and latency, compared to the
corresponding SeLMINs with higher values of
buffer size. This performance behavior of SeLMINs
is strengthened when it comes to service applications
that require small values of latency or jitter.
Also, the single buffered SeLMINs present as
better performance as many number of layers they
have for a given network size
Ν
. Also, they have an
earlier point in starting the layer replication and thus
eliminating the backpressure phenomenon.
This indication remains interesting as it is known
that the SiLMINs give their optimum performance -
according to the existing literature - when the buffer
size is equal to 2.
In addition, this SeLMINs’ finding leads to the
following observation: In their construction it is not
necessary to use large values of buffer size which
would ultimately increase the cost of their
manufacturing.
5 CONCLUSIONS
In this paper we studied Delta networks of
SeLMINs, which is a possible performance
improving strategy for Delta MINs. We present also,
an evaluation and comparison methodology of
MINs. This approach was applied on Delta type
SeLMINs and Delta type SiLMINs.
It is obvious that the delta type SeLMINs seem
to be more powerful but this is due to a higher
complexity, relatively speaking, than delta type
SiLMINs. However, in the literature there is a lack
of studies relevant to multi or semi layer MINs.
It is noteworthy that the predictions of the
simulations are validated in marginal cases by
existing related works in the literature.
The findings of this study can be utilized by
MINs designers to optimally configure their
networks.
The methodology presented herein is to be used
in future work in order to estimate the improvement
in performance of Delta networks when servicing
unicast and multicast traffic. Future work will also
focus on studying other load patterns where there is
hotspot and burst type of traffic. Additional work
will also examine the MIN’s performance under
different selection algorithms.
REFERENCES
Bouras C., Garofalakis J., Spirakis P., Triantafillou V.,
1987. Queuing delays in differed multistage
interconnection networks. In Proc. 1987 ACM
SIGMETRICS Conf., May 11-14, 1987, Banff,
Alberta, Canada, pp. 111-121.
Garofalakis J., Spirakis P., 1990. The performance of
multistage interconnections networks with finite
buffers, in: Proc. ACM SIGMETRICS Conf., short
paper.
Garofalakis John, Stergiou El, 2008. An analytical
performance model for multistage interconnection
networks with blocking. IEEE Sixth Annual
Conference on Communication Networks and Services
Research (CNSR2008) Halifax, Nova Scotia, Canada.
May 5 - 8.
Garofalakis John, Stergiou El., 2009. Performance
evaluation for multistage interconnection networks
servicing multicast traffic. The First International
Conference on Advances in Future Internet. AFIN
SIMULTECH 2011 - 1st International Conference on Simulation and Modeling Methodologies, Technologies and
Applications
264

2009 June 18-23, IEEE Press, Athens/Vouliagmeni,
Greece.
Garofalakis John, Stergiou Eleftherios, Oct 2010.
Analytical Model for Performance Evaluation of
Multilayer Multistage Interconnection Networks
servicing Unicast and Multicast Traffic by Partial
multicast operation, Elsevier Performance Evaluation,
Volume 67, Issue 10, October 2010, Pages 959-976.
Garofalakis John, Stergiou Eleftherios, March 2010. An
approximate analytical performance model for
multistage interconnection networks with backpressure
blocking mechanism, Journal of Communications
(JCM), Academy, Vol. 5, No 3, March, pp. 247-261.
German R., 2000. Performance Analysis of
Communication Systems, John Wiley and Sons.
Haas P. J., Stohastic Petri Nets, 2002. Springer Verlag.
Hsiao S. H. and Chen R. Y., 1991. Performance Analysis
of Single-Buffered Multistage Interconnection
Networks, 3rd IEEE Symposium on Parallel and
Distributed Processing, pp. 864-867, December 1-5.
Lindermann C., 1998. Performance Modelling with
Deterministic and Stohastic Petri Nets, John Wiley
and Sons.
Mun H. and Youn H.Y., 1994. Performance analysis of
finite buffered multistage interconnection networks,
IEEE Trans. Comput. 43(2), 153-161.
Patel J. H., 1981. Performance of processor-memory
interconnection for multiprocessors. IEEE Trans.
Comput., C-30(10): 771-780, Oct.
Suet Elizabeth Hing Tse, 2004. Switch fabrics architecture
analysis for scalable bi-directional reconfigurable IP
router, Journal of Systems Architecture: the
EUROMICRO Journal, 50(1), pp. 35-60.
Theimer T. H., Rathgeb E. P., and Huber M. N., 1991.
Performance Analysis of Buffered Banyan Networks,
IEEE Transactions on Communications, vol. 39, no. 2,
pp. 269-277, February.
Tutsch D. and Hommel G., 1997. Performance of buffered
multistage interconnection networks in case of packet
multicasting, Proceeding of Advances in Parallel and
Distributed Computing, 19-21, pp. 50-57, Mar.
Tutsch D., Hommel G., 2002. Generating Interconnection
Network Simulator. Generating Systems of Equations
for Performance Evaluation of Buffered Multistage
Interconnection Networks. Journal of Parallel and
Distributed Computing, 62, no. 2: pp. 228-240.
Tutsch D., Hommel G., 2008. MLMIN: A Multicore
Processor and Parallel Computer Network Topology
for Multicast. Computers and Operations Research
(C&OR) Journal Elsevier, Vol. 35, No. 12, December
2008, pp. 3807-3821.
Tutsch Dietmar, 2006. Performance Analysis of Networks
Architectures, Springer, ISBN-10 3-540-34308-3. 2006.
Vasiliadis D. C., Rizos G. E., Vassilakis C., 2006.
Performance Analysis of blocking Banyan Switches,
Proceeding of IEEE sponsored International Joint
Conference on Telecommunications and Networking
CISSE 06, December.
Vasiliadis D. C., Rizos G. E., Vassilakis C., Glavas E.,
2007. Performance evaluation of two-priority network
schema for single-buffered Delta Network, Procs of
the IEEE PIMRC’ 07.
Vasiliadis D. C., Rizos G. E., Vassilakis C., Glavas E.,
2008. Routing and Performance Analysis of Double-
Buffered Omega Networks Supporting Multi-Class
Priority Traffic, Procs of the Third International
Conference on Systems and Networks Com-
munications (ICSNC 2008), Malta, October.
Yoon H. S., Lee K. Y. and Liu M. T., 1990. Performance
analysis of multibuffered packet-switching networks
in multiprocessor systems, IEEE Trans. Comput. Vol.
c-39, pp. 319-327, Mar.
A SIMULATION STUDY FOR OPTIMIZING THE PERFORMANCE OF SEMI-LAYER DELTA NETWORKS
265
