
IS INTERNAL CAPITAL MARKET OF CHINA LISTED
COMPANIES EFFICIENT?
Empirical Evidences from Listed Companies which Have
Multiple Divisions in H-stock
Fengjuan Wang and Zhihua Xie
Business School, Beijing Technological and Business University, Fucheng Road, Beijing, P.R. China
Keywords: Internal capital market efficiency, Cash flow-sensitivity based on ROA, Evaluation method.
Abstract: In theory, when external capital market is not efficiency, groups can allocate resource efficiently through
internal capital market. In this paper, we studied of listed companies which have multiple divisions in H-
stock, used Cash Flow-Sensitivity Based on ROA to validate internal capital market efficiency of large
samples. Results display that, on the whole, internal capital market of listed companies is efficiency, and the
greater part of listed companies can continually allocate resource efficiently through internal capital market,
part of listed companies have excellent capacity to “pick winner”. This paper is the first literature which
employs listed companies as large samples to evaluate internal capital market efficiency directly, which
would make research results more reliable and more representative. It would provide evidences for
developing groups in our country and lay the foundation of further research in theory and method.
1 INTRODUCTION
Due to the serious friction in the external capital
market, the rapid development of enterprise groups
and the wide presence of internal capital market
practice, in recent years the concern on the theory of
internal capital market in emerging market countries
gradually exceeds the origin of this theory——the
United States and other developed countries.
Theoretically speaking, when the external capital
market is inefficient or ineffective, the resources can
be effectively allocated through internal capital
market. Enterprises can build the internal capital
market through diversified or group-based operation.
Enterprise groups in China are rather common with a
relatively high degree of diversification, internal
capital market practice is prevalent and developing
enterprise groups has always been seen as an
important economic policy by the Government.
However, the existing cases or empirical research
literature about internal capital market efficiency (Lu
Jianxin, 2008; Xu Qiting, 2008; Shao Jun and Liu
Zhiyuan, 2007) all choose “the Family Enterprise” as
the research object, which draws a conclusion that
the internal capital market is inefficient. Wang
Fengjuan and Zou Cunliang(2009) raised questions
about their samples and concludes.
In summary, the internal capital market theory,
practice and empirical evidence suffer contradiction.
Does this mean that the economic policy of
developing enterprise groups is wrong? Does it mean
that the market behavior of the enterprise groups is
irrational? To answer the questions is the aim of this
article.
2 LITERATURE REVIEW AND
THEORETICAL ANALYSIS
2.1 The Theoretical Basis for the
Effective Internal Capital Market
The effectiveness of internal capital markets is due to
the headquarters remaining control and information
superiority, which can reduce the information
asymmetry, increase motivation and effective
supervision, producing “more-money effect” and
“smarter -money effect”.
The internal capital market results from the
imperfection of the external capital market:
asymmetric information. Due to the internal
600
Wang F. and Xie Z..
IS INTERNAL CAPITAL MARKET OF CHINA LISTED COMPANIES EFFICIENT? - Empirical Evidences from Listed Companies which Have Multiple
Divisions in H-stock .
DOI: 10.5220/0003597206000605
In Proceedings of the 13th International Conference on Enterprise Information Systems (PMSS-2011), pages 600-605
ISBN: 978-989-8425-56-0
Copyright
c
2011 SCITEPRESS (Science and Technology Publications, Lda.)

information barriers or high costs existing in
obtaining the internal information of an enterprise,
the external capital market can not conduct
continuous fine-tuning to the company based on the
market conditions, while the internal capital market
is superior in the authenticity, timeliness and
accuracy of the information, and has an advantage on
the adaptability to the market environment
(Williamson, 1975). Myers and Majluf (1984), Stein
(1997) also provides the same evidences.
Gertner, Scharfstein and Stein (1994) built a
model on the basis of Grossman and Hart ownership
theory. They said that in the internal capital market,
corporate headquarters (the investor) is the direct
owner of the assets of divisions that utilize funds, and
has residual control rights, while the investors of the
external capital markets are not the direct owner of
those assets. Due to this essential difference, the
enterprise messaging, monitoring and incentives
produce different results between internal capital
markets and external capital markets. In the internal
capital markets, the corporate headquarters with the
residual control rights can better supervise and
motivate departmental managers.
When there is information asymmetry between
external investors and company management about
the company assets value and expected return on
investment projects, the securities issued by high-
quality companies to finance investment projects
may be undervalued, because companies may not
obtain sufficient funds at a reasonable cost, they have
to give up some projects with a positive net present
value (Myers and Majluf, 1984) . Stulz (1990)
pointed out that since the creation of a strong internal
capital markets in diversified companies, it will
effectively solve the problem of insufficient
investment, so diversified business operations than
single enterprises can make greater use of the
investment opportunities that present value is
positive, which will enhance corporate value.
2.2 The Theoretical Basis for the
Ineffective Internal Capital Market
Due to the agency problem, influence costs and
abuse of free cash flow, the internal capital market is
inefficient or even ineffective in capital allocation.
Scharfstein and Stein (2000)believed a good
investment project suffers relative under-investment
and a poor investment project enjoys over-
investment. With regard to the causes of "Company
socialism", Scharfstein and Stein (2000) continued to
analyze and found that this was due to the department
manager's rent-seeking behavior. Rajan, etc. (2000)
study have also reached the similar conclusion.
Managers have the tendency of over-investment
with the remaining cash flows (Jensen, 1986, 1993),
and the organizational structure of large enterprise
provides more cash flow for managers, which thus
easily leads to over-investment. Free cash flow
theory
suggests that due to the temptation of a
number of factors, entrepreneurs prefer to invest in
the project that would not increase shareholder
wealth as opposed to paying the dividend, such as
the money for its own on-the-job
consumption
(purchase of commercial aircraft), or the
consumption for honor(for social contributions, etc.).
2.3 China's External Capital Market
Efficiency and the Empirical
Evidences
In China, the external capital market is inefficient,
which has been proved by a large number of research
literature. The first is the low efficiency of the
banking system. Lu Jianxin(2008) argued that the
bank-led financing model prevails in China, but for
quite a long time, China's banking resource allocation
is based upon the administrative relations. As the
backbone of the banking system, state-owned
commercial banks inject their credit facilities into the
state economy whose economic contribution rate is
not high. As a result, input and output are
significantly mismatched, funding does not flow into
sectors of high efficiency, and the allocation of
resources is markedly ineffective. Second, the
efficiency of China's stock market is rather low. Yu
Qiao (1994) , Wu Shinong(1996), Chen Xiaoyue, et
al (1997), Han Liyan and Cai Hongyan (2002),
Zhang Bing and Li Xiaoming (2003), and Zeng
Yamin (2004) have used different methods to study
the stock market efficiency and reached the
conclusions that China's stock market is ineffective
or inefficient.
3 EVALUATION MODEL
SELECTION OF INTERNAL
CAPITAL MARKET
EFFICIENCY AND
EVALUATION METHODS
3.1 Internal Capital Market Efficiency
Evaluation Model Selection
Measurement methods of internal capital market
IS INTERNAL CAPITAL MARKET OF CHINA LISTED COMPANIES EFFICIENT? - Empirical Evidences from Listed
Companies which Have Multiple Divisions in H-stock
601

efficiency can be divided into indirect and direct
research methods. In the early empirical studies,
researchers largely used the indirect research method.
The indirect research method is a rough
measurement; its use stems from researchers'
inability to obtain needed business segment data (Lu
Jianxin, 2008). With the improvement of segment
reporting standards, segment information gradually
meets the need of directly measuring the efficiency
of the internal capital market. Particularly, after the
advent of databases directly providing detailed
financial data of the enterprise segment such as
COMPUSTAT database and the LRD database, the
direct research method has been increasingly
used(Wang Fengjuan,2009). In abroad, the direct
research model mainly has the following four kinds:
investment cash flow sensitivity method (Shin and
Stulz, 1998), the value added method (Rajan and
Zingales, 2000), Q-sensitivity (Peyer and Shivdasani,
2001), and cash flow sensitivity method
(Maksimovic and Phillips, 2002; Shcoar, 2002).
Chinese scholars mostly use Q-sensitivity and cash
flow sensitivity methods, including Wang Fengjuan
and Zou Cunliang (2009), Lu Jianxin (2008), Xu
Qiting (2008), Shao Jun and Liu Zhiyuan (2007).
Conducted an in-depth analysis of the four models
above, Wang Fengjuan and Xie Zhihua(2010)
designed a new model named “cash flow sensitivity
methods based on asset return”.
The formula of cash flow sensitivity coefficients
based on the return on assets is as follows:
])()[(
1
,
BA
BA
BA
capex
BA
capex
BA
cf
BA
cf
CFS
j
j
j
n
j
j
j
A
−−=
∑
=
In the formula BAj is the book assets of segment
j, BA is the book assets of all segments; cf is the cash
flow of all segments. Capex is capital expenditure.
The model is an improvement on cash flow sensitive
method, replacing
⎟
⎟
⎠
⎞
⎜
⎜
⎝
⎛
−
sale
cf
sale
cf
j
j
with
⎟
⎟
⎠
⎞
⎜
⎜
⎝
⎛
−
BA
cf
BA
cf
j
j
.
Just as the external investors invest to obtain
investment return, the ultimate goal of internal
capital allocation is to maximize return on capital.
Thus, in theory, regardless of the external or internal
capital markets, the return on investment is the
resource allocation criterion which is the principle to
design cash-flow sensitivity method based on assets
return. Therefore, this article selects cash-flow
sensitivity method based on return assets to evaluate
the internal capital market efficiency.
3.2 Evaluation Methods of Internal
Capital Market Efficiency
This paper uses two approaches to evaluate the
internal capital market effectiveness of the samples
as a whole. The first is based on the mean and
median of the sample company's cash flow
sensitivity coefficient: if both are positive, then the
internal capital market is effective; if they are
opposite, then make a judgment after further analysis.
The second is based on the positive and negative
signs of cash flow sensitivity coefficients, and
calculates the percentage of samples with positive
efficiency to the total sample (referred to "percentage
of effective class"), when the percentage is greater
than or equal to 50%, the internal capital market is
effective on the whole.
In addition to the overall evaluation of all
samples, in order to determine continuity of internal
capital market efficiency in the sample companies,
this paper has also drawn the samples that have
disclosed segment data for 8 consecutive years, or
throughout the period covered by our research,
calculated the percentage of the years in which
resources are effectively allocated to the 8 years. If
the percentage is greater than or equal to 50%, then
the sample's internal capital market as a whole is
effective.
4 EVALUATION OF INTERNAL
CAPITAL MARKET
EFFICIENCY IN H SHARES
LISTED COMPANIES WITH
MULTI-SEGMENT
4.1 Sample Selection and Data Sources
In China listed company's shares include A shares, B
shares, H shares, N shares and S shares. This
distinction is primarily based on the location and
investors the stock may target. In the quantitative
terms, A-share listed company is largest and most
representative, but due to incomplete division
information, there is a lack of the critical data
necessary to measure the internal capital market
efficiency: "segment capital expenditure" and
"division cash flow". Therefore, this paper selects H-
share listed companies as object and makes an
overall assessment of the internal capital market
efficiency of listed companies in China. H-share and
A-share listed companies are registered in the
Mainland, there are therefore identical in terms of
ICEIS 2011 - 13th International Conference on Enterprise Information Systems
602
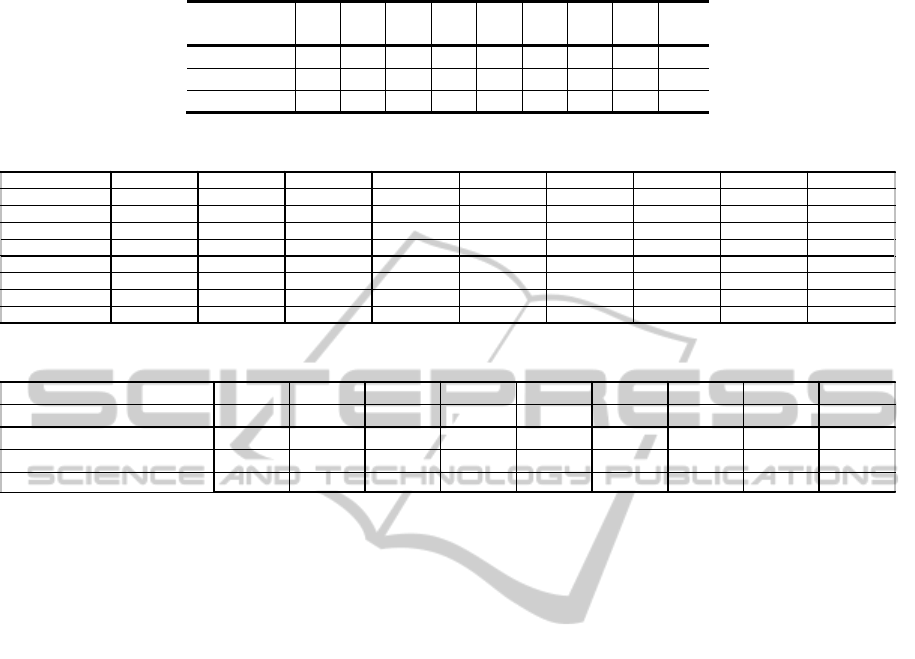
Table 1: Total samples and distribution in each year.
Year
20
07
20
06
20
05
20
04
20
03
20
02
20
01
20
00
Tot
-al
Sample 72 64 46 37 29 20 17 12 297
Main board 56 49 33 26 20 15 15 11 225
GEM 16 15 13 11 9 5 2 1 72
Table 2: The descriptive statistics.
Item
2007 2006 2005 2004 2003 2002 2001 2000
total
Observation
72 64 46 37 29 20 17 12 297
Mean
0.0005885 0.0034292 0.000528 -0.001498 0.0030955 0.0081759 0.0002153 0.0006378 0.0016677
Median
1.956E-05 0.0004584 5.631E-05 0.000006 0.0000981 0.0006605 0.0001805 -4.6E-05 0.0001499
Change scope
0.0522768 0.4083792 0.0406579 0.1560778 0.075269 0.0912034 0.0157066 0.0165996 0.4083792
Min
-0.020521 -0.172303 -0.025152 -0.107211 -0.016456 -0.002803 -0.009739 -0.007817 -0.172303
Max
0.0317557 0.2360765 0.015506 0.0488668 0.058813 0.0884001 0.005968 0.008783 0.2360765
Skewness
1.8238095 1.9762107 -1.004468 -3.720129 3.1522601 3.2461998 -1.02608 0.2011373 -3.720129
Kurtosis
10.528633 25.898063 7.2486914 22.297462 11.018523 10.814744 3.661448 0.2791072 22.297462
Table 3: The statistics by class for each year.
Year
2007 2006 2005 2004 2003 2002 2001 2000 Total
Number of samples
72 64 46 37 29 20 17 12 297
Inefficient Class
35 25 21 18 13 6 7
6
131
Efficient Class
37 39 25 19 16 14 10
6
166
P
ercen
t
age o
f
e
ffi
c
i
en
t
class
51.39 60.94 53.35 51.35 55.17 70 58.82 50 55.89
ownership structure, corporate governance and
business environment. Some of the samples belong to
both A-share and H-share, so the samples have a
strong representative value. The paper ultimately
obtains 297 samples, with the total number of
samples and the distribution in each year are set out
in Table 1.
4.2 The Evaluation based on All
Samples
All samples and the descriptive statistics of cash flow
sensitivity coefficients of sample groups for each
year are set out in Table 2.
It can be seen from Table 2 that the maximum of
cash flow sensitivity coefficient of all samples is
0.236076526, the minimum is -0.172302688 and
change amplitude is 0.408379214, which indicate the
level of differences in the efficiency of the internal
capital market is relatively large; the mean is
0.001667662, the median is 0.000149884, both are
positive. Therefore, the internal capital market of the
samples as a whole is effective. From the descriptive
statistics for each year, except in 2000 and 2004, the
mean and median are positive, indicating in the six
years the samples are able to effectively allocate
resources. A further analysis found that in 2004 the
sample statistical bias degree was -3.72012936,
indicating the efficiency indicators of sample
companies presented serious left side. When
excluding the minimum, the mean is 0.001438145,
and the median is 0.00004489, both being positive;
when excluding the minimum and maximum, the
mean is 8.30393E-05, and the median is 0.000006,
both being positive.
4.3 The Evaluation based on All
Samples Comparison of Main
Board and Growth Enterprise
Market
The comparison of internal capital market efficiency
of Main Board and Growth Enterprise is set out in
table 4.
In Table 4 by comparing the mean and median of
cash flow sensitivity coefficient in Main Board and
GEM, the internal capital market efficiency of Main
Board is higher than the GEM. This is mainly
because the size of listed companies in the Main
Board is large, cash flows are highly complementary
and the internal capital operating mechanism are
relatively advanced and standardized.
4.3 Evaluation of the Continuity of
Internal Capital Market Efficiency
The above statistical analysis in general evaluates the
internal capital market efficiency of Chinese listed
companies, but because the return on capital may
occur at a later time. The cash flow sensitivity
coefficient for a period is negative, this does not
IS INTERNAL CAPITAL MARKET OF CHINA LISTED COMPANIES EFFICIENT? - Empirical Evidences from Listed
Companies which Have Multiple Divisions in H-stock
603
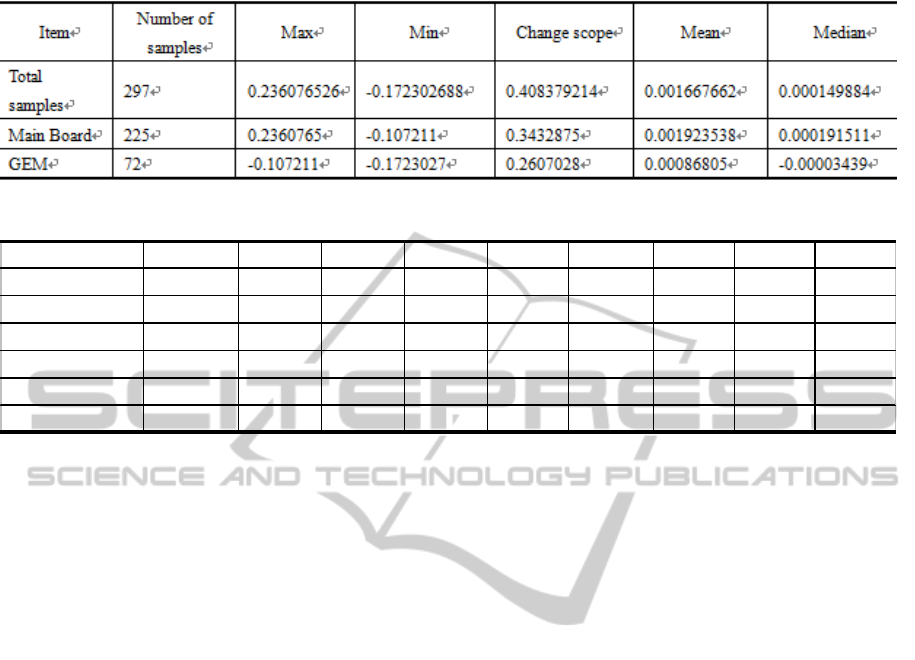
Table 4: Cash flow sensitivity coefficient of Main Board and Grow Enterprise Market.
Table 5: Cash flow sensitivity coefficient of sub-sample.
Item 2007 2006 2005 2004 2003 2002 2001 2000 total
Number of samples 12 12 12 12 12 12 12 12 96
Max 0.021319 0.236077 0.005891 0.008910 0.058813 0.011401 0.005968 0.008783 0.236077
Min -0.002943 -0.001282 -0.001448 -0.107211 -0.001240 -0.002803 -0.009739 -0.007817 -0.107211
Change scope 0.024262 0.237359 0.007339 0.116121 0.060053 0.014204 0.015707 0.016600 0.343288
Mean 0.002467 0.022108 0.001183 -0.007753 0.005943 0.001776 0.000395 0.000638 0.003345
Median 0.000912 0.000651 0.000098 0.000171 0.000234 0.000985 0.000376 -0.000046 0.000349
necessarily point to the inefficient resources
allocation in the current period. Therefore, it is
needed to conduct a continuity research on the
allocation efficiency for each year. Of the 72 sample
companies with 2007 as the base, 12 companies
disclosed segment information throughout 8 years
from 2000 to 2007, and met the requirements for the
calculation of cash flow sensitivity coefficients based
on the return on assets. Therefore, this paper selects
the 12 listed companies as the research object and got
96 sub-samples.
The descriptive statistics of cash flow sensitivity
coefficients of the 96 sub-samples are set out in
Table 5. As seen from Table 5, except that the
median in 2000 is negative (consistent with the
analysis of total sample), the mean and median of the
other years as well as the total sample are positive.
Therefore, either from the sub-sample for each year
or from the sub-sample for the total sample, the
internal capital market is effective.
5 CONCLUSIONS, LIMITATIONS
AND FUTURE RESEARCH
DIRECTIONS
5.1 Conclusions
By analyzing 297 samples from 2000 to 2007 by year
and by the Main Board and the GEM, and evaluating
the sample in accordance with the mean and median
of the cash flow sensitivity coefficient and the
percentage of efficient class, this paper arrives at the
conclusion that the internal capital market of the
sample companies was effective, and the internal
capital market of the Main Board samples was more
efficient than that of the GEM. As the samples have
strong representativeness, this paper concludes that
internal capital markets of Chinese listed companies
and even non-listed companies are efficient, and the
internal capital market efficiency of large enterprises
was higher than that of small businesses.
5.2 The Limitations of this Article and
Future Research Directions
Although H-share listed companies and A-share
listed companies are registered and operate in the
Mainland, and are identical in terms of ownership
structure, corporate governance and business
environment, the conclusions of the study has certain
limitations due to the difference in the regulatory
level between the A-share and H-share market.
Therefore, the research directly on the A shares will
be more meaningful. But this requires improvements
on segment information disclosure in the A-stock
market or a new empirical model designed based on
existing available information, which is exactly the
direction of future research. Moreover, the paper
finds that 44.11% of the sample companies were still
unable to effectively
allocate resources. So why
can some companies allocate resources
efficiently, while others can not? What factors
have led
to differences in the efficiency of resource
ICEIS 2011 - 13th International Conference on Enterprise Information Systems
604

allocation? How to build an effective internal capital
market? These are valuable research topics.
ACKNOWLEDGEMENTS
This article is subsidized by Beijing Education
Commission (SM201010011008 and PHR20100512)
and Beijing Natural Science Foundation (9112005)
.
REFERENCES
Chen Xiaoyue, Chen Xiao, and Gu Bin, 1997. Empirical
research on weak efficiency in the Chinese stock
market. Economic Research Journal , vol.9, pp.13-17.
Gertner, R. H., D. S. Scharfstein and J. C., Stein, 1994.
Internal Versus External Capital Markets. The
Quarterly Journal of Economics, No.109, pp.1211-
1230.
Han Liyan, Cai Hongyan, 2002. Research on the capital
allocation efficiency in China and its relationship with
the financial market. Management World, no.1, pp.65-
70.
Jensen, M., 1986. Agency Costs of Free Cash Flow,
Corporate Finance , and Takeovers. the American
Economics, vol.76, no.2, pp.323-329.
Jensen, M., 1993. The Model Industrial Revolution, Exit,
and the Failure of Internal Control Systems. Journal of
Financial, vol.46, no.2, pp.831-880.
Lu Jiangxin, 2008. Research on allocation efficiency of
internal capital market. Peking University Press.
Maksimovic, V., G. Phillips, 2002. Do Conglomerate
Firms Allocate Resources Inefficiently across
Industries? Theory and Evidence. Journal of Finance,
Vol.56, No.2, pp.721-768.
Myers, S. C., and N. C. Majlufm, 1984. Corporate
Financing and Investment Decision when Firms Have
Information that Investors Do Not Have. Journal of
Financial Economics,no.13, pp.187-222.
Peyer, U. C. and A. Shivdasani, 2001. Leverage and
internal capital markets: Evidence from leveraged
recapitalizations. Journal of Financial Economics,
Vol.59, No. 2: pp.477-515.
Schoar, A., 2002. Effects of Corporate Diversification on
Productivity. Journal of Finance, Vol.57, No.6,
pp.2379-2403.
Rajan, R., S. Henri, and L. Zingales, 2000. The Cost of
Diversity: The Diversification Discount and Inefficient
Investment. Journal of Finance, Vol.52, No.1, pp.35-
80.
Shao Jun, Liu Zhiyuan, 2007. Is the internal capital market
within an enterprise family efficient? – case study
based on the Hongyi Family. Management World ,
No.6,pp.114-121.
Shin and Stulz, 1998. Are Internal Capital Market
Efficient?. Quarterly Journal of Economics, Vol. 113,
No.2 (May), pp.531-552.
Stein, J. C., 1997. Internal Capital Markets and the
Competition for Corporate Resources. The Journal of
Finance, vol.52, pp.111-133.
Stulz, R., 1990. Managerial Discretion and Optimal
Financing Policies. Journal of Financial Economics,
Vol.26, No.1, pp.3-27.
Wang Fengjuan, 2009. Research on Internal Capital
Market efficiency: A Study Based on H-stock.
Economic sciences press
Wang Fengjuan, Xie Zhihua, 2010. The Modification and
Verification of Empirical Model to Measure Internal
Capital Market Efficiency. Accounting Research, no.8,
108-124.
Wang Fengjuan, and Zou Cunliang, 2009. Degree of
diversification and efficiency of internal capital market
– study of cases based on division data. Management
World , no.4,pp.153-161.
Williamson, O liver E., 1975. Markets and Hierarchies
:
Analysis and Antitrust Implication. New York:Free
Press.
Wu Shinong, 1996. Analysis of the efficiency in the
Chinese securities market. Economic Research
Journal, no.4, pp.13-19.
Xu Qiting, 2008. Research on efficiency of internal capital
market – empirical study based on privately-owned
listed companies in China. Economic Science Press.
Yu Qiao 1994. Efficient Market, Abnormal Circle and
Volatile Stock Price. Economic Research Journal,
no.9, pp.43-50.
Zeng Yamin, and Zhang Junsheng, 2004. Ownership
structure and output efficiency: empirical study on
Chinese enterprise. Finance and Economics Reseach,
no.7, pp.89-96.
Zhang Bing, and Li Xiaoming, 2003. Study on gradual
efficiency in the Chinese stock market. Economic
Research Journal , no.1, pp.54-61.
IS INTERNAL CAPITAL MARKET OF CHINA LISTED COMPANIES EFFICIENT? - Empirical Evidences from Listed
Companies which Have Multiple Divisions in H-stock
605
