
ACCOUNTING INFORMATION CONTENT AND TIMELINESS
OF ANNUAL REPORT DISCLOSURE
An Evidence from China’s Listed Companies
Hou Pu, Geng Guanyu
School of Economics and Management, Beijing Jiaotong University, Beijing, China
Ma Zhong
School of Economics and Management, Beijing Jiaotong University, Beijing, China
Keywords: Timeliness, Information content, Accounting, China market.
Abstract: In China, new corporate accounting standards and new CPAs auditing standards were mandatory
implemented in 2007, which brought in more convergence with international standards. In the same year,
the Administrative Measures on Information Disclosure for Listed Companies was also implemented,
setting up more specific requirements on information disclosure for annual reports. Based on these
institutional changes and current analysis of report disclosure, this study examines the timeliness of
accounting information disclosure and related information content. Our findings provide evidences that in
current China market, while the pattern of “slack starting and tight ending” continues, most listed
corporations still won’t disclose their information until latter half of report disclosure period, some evidence
of improvements has begun to appear in comparison with previous years. The empirical results further
suggest that compared with companies making late disclosures, firms making early disclosures tent to
surprise the market with stronger price reactions, larger abnormal earning and more accumulative surplus
profits. It also indicates that institutional changes have improved the timeliness of information disclosure;
the timeliness does possess information capacity. The earlier a disclosure is made, the larger information
content it may carry out, which is particularly reflected non-state enterprises and competition industry.
1 INTRODUCTION
Early or late disclosure of information may give rise
to different degrees of market reaction. The timelier
information disclosure it is, the stronger market
reaction will be (Chen et al., 2005). As the market
reaction is mainly reflected in the volatility of the
stock price, timeliness of accounting information
disclosure plays a critical role for investors’
decision- making.
Disclosure of accounting information in China
has always appeared in a pattern of “slack starting
and tight ending”. Distributions of disclosure time
are extremely uneven. Most listed companies choose
to disclose their information just before the deadline
(Haw et al., 2000). Companies with poor
performances are even more seriously lagging
behind (Chai & Tung, 2002). Compared with
developed countries, Chinese listed companies have
more serious problems lagging of information
disclosure. However, as the government regulations
and business operations get improved over time, the
situation may gradually change (McGee & Yuan,
2008).
China has begun to implement “Administrative
Measures on Information Disclosure by Listed
Companies” since 2007 and has thoroughly changed
the disclosure rules of 1993 version, with a special
emphasis on the importance of regulated timely
information disclosure system. Since then, China
Ministry of Finance has also implemented a set of
new corporate accounting standards and new CPAs
auditing standards with mandatory, which sets the
Chinese system in more convergence with
international standards. The standards require a
higher quality of information disclosure and expand
the scope of information disclosed.
400
Pu H., Guanyu G. and Zhong M..
ACCOUNTING INFORMATION CONTENT AND TIMELINESS OF ANNUAL REPORT DISCLOSURE - An Evidence from China’s Listed Companies.
DOI: 10.5220/0003595104000408
In Proceedings of the 13th International Conference on Enterprise Information Systems (SSSCM-2011), pages 400-408
ISBN: 978-989-8425-54-6
Copyright
c
2011 SCITEPRESS (Science and Technology Publications, Lda.)

With these institutional changes and
development, what new trends in information
disclosure will show whether the lagging situation
will indeed get improved, what relationship between
timeliness and market reaction will evolve, and
whether the timeliness includes information content?
This article will focus on these important issues. We
have selected relevant data from 2007-2009 annual
reports of listed companies in Shanghai and
Shenzhen and developed test models of information
content to study timeliness of information disclosure
after the systematic changes.
2 LITERATURE REVIEW &
HYPOTHESIS
Most of the previous studies on timeliness focus on
two issues. One is analysis of the timeliness and its
influencing factors; the other is the information
content of timeliness. On the timeliness and its
influencing factors, many scholars have conducted
empirical researches based on different samples.
Based on a study of 588 firms’ Annual reports in
1998 in Bangladesh, India and Pakistan, Kamran
(2003) found that delay in information disclosure
popularly exists among the listed companies in all of
the three countries. And the results are apparently
affected by lagging in auditoria practice of these
countries. Whittred (1980) proved in his study that
in Australian listed companies with reservation
opinion to their audit reports will usually lag longer.
More serious the enterprise’s unclean opinion is, the
longer the delay appears, and the lag of annual
report disclosure therefore becomes even longer.
There are many factors that may cause delay of audit,
such as industry environment, unexpected surplus
and the situation of auditors and other financial
difficulties etc. Kinney & McDaniel (1993)
conducted a research on these factors, and the result
is consistent with the conclusion drawn above, that
is, the process of unclean opinion leads to a longer
delay of audit and therefore leads to delay of the
annual disclosure.
Academic studies about the impact of "good
news" and "bad news" on the information disclosure
delay have obtained different results. The results of
Chambers & Penman (1984), Kross & Schroeder
(1984) showed that managers tend to release good
news early, and bad news late. Compared to the
previous studies, this time pattern of accounting
information disclosure has been a consistent
conclusions among most researches of this nature.
However, it was not the case in France, Germany
and the UK. listed companies in these countries
tended to report bad news earlier and good news
later (Rees & Giner, 2001).
In china market, influenced by the political
environment, social system and level of economic
development, China is still in a process of economic
transformation. Companies in such financial
transformation are always far more behind in
timeliness of information disclosure than the
companies with established management system are,
which may have caused the Chinese listed
companies weaker in the timeliness (McGee,2007).
But with institutional improving, the state gradually
regulate the disclosure regime, the cost of late
disclosure of listed companies will increase. Under
the effect of instutional changes, as the improvement
of operating results, internal control and financial
system, the possibility of getting an unclean opinion
has reduced. It is likely that the timeliness of
Chinese companies issuing their financial statements
and annual reports will be improved (McGee &
Yuan, 2008). However, due to the big gap in general
between China and developed countries in level of
development, the overall lag in information
disclosure will not have a substantial change.
Based on the analysis above, we come up with
the first research hypothesis of this article:
H1: After the institutional changes, the overall
trend of information disclosure of listed companies
in China will continue show a delay, but the
timeliness will be improved than before.
Early or late information disclosure has different
information content, and there had not shown a
information content decline during the last three
decades (Landsman & Maydew, 2002). Gilvoly &
Palmon (1982) found in their study on timeliness of
annual report disclosure of listed companies in New
York Stock Exchange during 1960-1974, that market
price reacts stronger to earlier disclosure than later.
It is suggested that more timely disclosure of
information, the greater its information content
becomes. This is consistent with China's market
research findings (Chen et al., 2005). For companies
in the same industry, late information disclosure
may cause information leak more easily (Kross &
Schroeder, 1984). However, during the Gulf crisis of
the 1990s, petroleum refining companies, which
delayed reporting extraordinarily high profits
because of the political repercussions (Han &
Wang, 1998). Research also shows that annual
report disclosure in countries with a strong system of
investor protection has more information content
(DoFond et al., 2007).
ACCOUNTING INFORMATION CONTENT AND TIMELINESS OF ANNUAL REPORT DISCLOSURE - An
Evidence from China's Listed Companies
401

Whether for investors or regulators, the listed
companies’ accounting information is an important
tool to understand their business situation. It has
important significance for making economic
decisions. Timely disclosure of accounting
information, on one hand, can reduce the possibility
of management using information disclosure delay
to engage in insider trading, and help to provide
more reliable accounting information for external
information users. On the other hand, it can help
investors for rationally valuating the companies,
preventing excessive pricing error. Conversely, it
may lead to "information asymmetry". It will causes
information delay and much adverse impact to
policymakers, investors, regulators and many other
stake holders. Specifically, as for external
stakeholders, untimely accounting information may
cause hazards. Firstly it increases investor’s
decision-making risk-lack of a deterministic
decision-making basis; Secondly it damages the
foundational status of accounting information, so
that information users turn to other sources of
information; Finally, it may create time condition for
some companies to manipulate accounting
information and prepare false statements.
According to the provision of China Securities
Regulatory Commission (CSRC), the deadline of
listed company annual report disclosure is next April
30 generally. If the company has special situation
and can’t disclose the annual report before April 30,
it should apply to the CSRC. But the latest
disclosure date can’t exceed June 30. In the context
of this system, with the impacts of listed companies'
ownership structure and industry, early and late
disclosure of information will have different market
reactions, which will lead to the issues of timely
disclosed information content.
In 2007, China implemented the new Enterprise
Accounting Standards and the new auditing
standards. Based on the changes, are the conclusions
on information content still consistent with previous?
There has been no evidence.
Based on the analysis above, We propose the
second research hypothesis:
H2: Companies with early disclosure of their
annual reports will get a stronger market reaction
than those with later disclosure.
Since we use Abnormal Return (AR) and
Cumulative Abnormal Return (CAR) to measure
degrees of market reaction, the above hypothesis
may be further explained as:
Companies with early disclosure of their annual
reports will have definitely stronger AR and CAR
than those with late disclosure.
3 METHODOLOGY & MODELS
3.1 Timeliness of Accounting
Information disclosure
The paper uses Rlag (Reporting Lag) as the proxy
variable of timeliness (Chambers & Penman,1984).
It refers to the interval between the date of annual
report disclosure and accounting year end. We study
the annual disclosure measurement with the specific
situation of China's securities market and use trade
date method to determine the Rlag. The Rlag is
described as the number of trading days between the
date of annual report disclosure and Dec.31st. The
smaller the Rlag is, the timelier the reports
disclosure is. If the company's annual report is
disclosed during non-trading days, the disclosure
date is determined as the first trading day following
the disclosure date. Based on the above
considerations, we define two time variables in this
paper. One is URlag (Unexpected Reporting Lag),
and the other is RLI (Reporting Lag INDUex). In
this paper, we use Random-walking model “E(Rlag)
=Rlag
t-1
” to calculate the Rlag. Therefore, URlag =
Rlag
t
-Rlag
t-1
. Rlag
t
means the company i t-year’s
Rlag. RLI =n/N, “n” is equal to Rlag. “N” means the
sum of trading days within the time limit of annual
reports disclosure. In this paper N equals to 81.
We use the mean and t-test (Model 1) to measure
the improvement of timeliness after the
implementation of new institution. We compared the
mean of Rlag during 2006-2009 to analyze the
improvement of timeliness, especially in the late half
of the disclosure period. In order to test hypothesis 1,
we also analyzed the variation of March-disclosure
percentage.
3.2 Market Reaction
Investors’ reaction in stock market is reflected
mainly through stock prices. Therefore, we use
Abnormal Return (AR) and Cumulative Abnormal
Return (CAR) to measure the market reactions. AR
is the estimated value of changes in the company
stock price of the day caused by the events; it's the
income that is unexpected, the difference between
the actual return and expected return: AR
it
=R
it
-R
mt
.
AR
it
means the company i t-day’s abnormal returns.
R
it
means the company i t-day’s daily return. R
mt
means the company i t-day’s expected daily return
rate. In this paper, we count R
mt
by using Market-
adjustment model. That is, using the daily market
yields weighted by total market value as an estimate
of the expected rate of return. To a certain time
ICEIS 2011 - 13th International Conference on Enterprise Information Systems
402

period, the sum of the daily abnormal returns is
CAR.
Since this paper uses event-study to research the
impact of timeliness on the stock, when calculating
CAR, we need to set a time interval, which is also
called event window. We should consider not only
the duration of event influence, but also the
interference from other events. In normal situation, a
market reaction caused by information leaks has
occured usually before the annual report is disclosed,
and the reaction does not last long. Based on this
assumption, we pick [-20, -3] and [-20, 2] as event
windows to measure the possible information leak.
At the same time, we also pick [-5, 5], [-2, 2] and [-1,
1] as three symmetric windows to measure the
market reaction to the report disclosure.
3.3 Research Model Design
The paper uses RLag, URLag and RLI as variables
to measure the timeliness of report disclosure. When
measuring improvements of timeliness, we use
NMar. We also use AR and CAR as the proxy
variables of market reaction.
3.3.1 Research Design for Hypothesis 1
This paper divides the sample into two groups by
months and trading days, and uses descriptive
statistics to analyze the status of annual reports
disclosure during 2007-2009. Then three variables
RLag, URLag and RLI are analyzed to further
examine the hypothesis1.
We use the mean and t-test (Model 1) to measure
the improvement of timeliness after the
implementation of new institution. We compared the
mean of Rlag during 2006-2009 to analyze the
improvement of timeliness, especially in the late half
of the disclosure period. In order to test hypothesis 1,
we also analyzed the variation of March-disclosure
percentage.
3.3.2 Research Design for Hypothesis 2
By analysing the correlation between AR, CAR and
Rlag, RLI, and grouping the samples according to
certain standards, we can compare AR and CAR of
both early and late disclosure companies.
Model 2: AR measures the change of company
value caused by important events. We use model 2
to calculate the market reaction, based on the study
of the connection between CAR and Rlag around the
report disclosure date:
AR
i
t
=α
0
+α
1
Rlag
i
+ε (1)
ARit is the company i t-day’s abnormal returns.
Rlagi is the company i t-day’s report lag. ε is the
random error.
Model 3 is used to make sure if CAR of early
reporting disclosure companies is significantly
higher than the late ones. It needs to compare the
sample mean of two groups and make a t-test on the
reporting lag. The standards of grouping are below:
(1) Firms disclose report in January and February
(Early disclosure group) and firms disclose reports
in March and April (Late disclosure group).
(2) URlag < 0 (Early disclosure group) and
URlag >= 0 (Late disclosure group).
(3) RLI<0.3 (Early disclosure group) and
RLI>0.7 (Late disclosure group).
Since some firm characteristics and market variables
such as size, message type, audit opinion and the
nature of ownership may affect the cumulative
abnormal returns, they have to be controlled, in
order to have a better review on the factors that
affect the reaction proceeds during the period of
annual report disclosure. Therefore, we have
designed a multiple regression model (Model 4):
CAR=β
0
+β
1
URlag+β
2
SIZE+β
3
PUBL+β
4
UE+β
5
EPS
+β
6
LAR+β
7
AUDI+β
8
CONT+β
9
EXCH+β
10
INDU
+β
11
YEAR+ε (2)
In this model, SIZE means the company size.
PUBL is the proportion of tradable shares. INDU
means the industry. UE is the unexpected earnings.
EPS is earnings per share. LAR is the asset-liability
ratio. AUDI is the audit opinion. CONT is the nature
of ownership. EXCH is type of the exchange. YEAR
means for the year of reporting disclosure. ε is the
random error.
3.4 Sample & Variables
Table1 shows the interpretation of variables
appeared in this paper:
Table1: Variables.
Variable Variable Description
Rlag
Trading days between the date of annual
report released and Dec.31st
URlag URlag=Rlag
t
-Rlag
t-1
RLI RLI =n/N
AR AR
it
=R
it
-R
mt
CAR CA
R
,
=
SIZE Natural logarithm of final total assets
ACCOUNTING INFORMATION CONTENT AND TIMELINESS OF ANNUAL REPORT DISCLOSURE - An
Evidence from China's Listed Companies
403
Table1: Variables (cont.).
Variable Variable Description
PUBL
PUBL=number of year-end floating stock/
total shares
INDU Competitive industry INDU=1;else INDU=0
EPS EPS= retained profits /year-end total shares
UE UE=EPS
t
-EPS
t-1
LAR
LAR=year-end total liability / year-end total
assets
AUDI clean opinion AUDI=; else AUDI=1
CONT State-owned, CONT=0; else CONT=1
EXCH
Shenzhen exchange EXCH=1,Shanghai
exchange EXCH=0
YEAR
Setting two dummy variables based on 2007
Considering the impacts of new accounting
standards, we choose all companies that publish A
share and listed on the Shenzhen or Shanghai
exchanges as our sample. On this basis, the paper
has removed the following types of listed companies:
(1) Financial companies
(2) ST / PT companies
(3) Companies that disclose their annual reports
later than Apr.30th.
(4) Companies that miss part of the data or data
can’t be obtained.
Thus, there are a total of 2,927 sample
companies in the paper.
3.5 Data Sources & Tools
In addition to the audit opinion data obtained from
the wind database, other data are all from CSMAR
database. The statistical tools used are STATA 11.0,
Access2010 and SPSS 19.0.
4 FINDINGS
4.1 Describe Statistical Analysis
When examining research hypotheses 1, we make a
basic descriptive statistical analysis on the variables
of timeliness:
Table 2 reflects the descriptive statistics of
distribution of listed companies annual reports
disclosure time by month. It can be seen from the
distribution that the number (1358) and the
percentage (46.40%) of sample companies which
choose to disclose annual reports in March is
significantly more than that in January (63,2.15%)
Table 2: Frequency statistics of annual report disclosure 1.
Months
Jan. Feb.
Year/Sample Number (%) Number (%)
2007(901) 34 3.77% 131 14.54%
2008(940) 7 0.74% 82 8.72%
2009(1086) 22 2.03% 121 11.14%
Sum(2927) 63 2.15% 334 11.41%
Months
Mar. Apr.
Year/Sample Number (%) Number (%)
2007(901) 378 41.95% 358 39.73%
2008(940) 462 49.15% 389 41.38%
2009(1086) 518 47.70% 425 39.13%
Sum(2927) 1358 46.40% 1172 40.04%
and in February (334, 11.41%). It is slightly more
than that in April (1172, 40.04%). The result shows
that the number of firms choosing to disclose annual
report in January and February is far less than that in
March and April. The disclosure of annual report
reflects hysteresis phenomena of delay as a whole.
Table 3: Frequency statistics of annual report disclosure 2.
Days
Year
Sum
2007 2008 2009
0-15 0 7 10 17
16-25 42 17 39 98
26-35 53 65 94 212
36-45 119 105 111 335
46-55 135 256 249 640
56-65 276 255 289 820
66-77 276 235 294 805
Sum 901 940 1086 2927
Figure1: Frequency distribution of annual report
disclosure.
0
50
100
150
200
250
300
350
0-15 16-25 26-35 36-45 46-55 56-65 66-77
The Conpany Number
Reporting Lag (Days)
2007
2008
2009
ICEIS 2011 - 13th International Conference on Enterprise Information Systems
404
Table 3 shows the results of detailed statistical
analysis of annual report disclosure frequency with
10 trading day as an unit. It further reflects the
distribution of annual report disclosure time. The
number of companies is respectively 640, 820 and
805, which choose to disclose annual report in the
intervals of [46, 55], [56, 65] and [66, 77]. The
number of the three intervals increases suddenly
relative to the interval of [36, 45]. This phenomenon
can be more intuitively observed in Figure 1. The
result above further explans that a majority of
companies disclose their reports in March and April.
It also reflects the pattern of " slack starting and tight
ending " mentioned previously.
Table 4: Frequency statistics of annual report lag.
Variable Mean Median St. Dev Min. Max.
Rlag 55.2156 57 14.3224 9 77
RLI 0.6817 0.7037 22.5611 0.1111 0.9506
URlag 3.2928 0 0.1768 -64 77
Table 4 presents descriptive statistical analysis
results of Rlag, RLI and URlag. The mean of Rlag is
55.2156 and the median of Rlag is 57. The mean of
RLI is 0.6817 and the median of RLI is 0.7037.The
evidence shows that a majority of China’s listed
companies choose relatively late disclosure of their
annual reports and that the distribution of report
disclosure time is not random.
The result of descriptive statistical analysis
powerfully supports the relevant content of
hypotheses 1: Disclosure of corporate annual reports
in China is serious lagging.
Table 5: Compare of mean of Rlag.
mean-Rlag t-test
2006 2007 t-Value p-Value
57.2433 55.4022 -2.6591 0.004**
Table 6: Mean of Rlag during 2006 - 2009.
Year 2006 2007 2008 2009
Rlag 57.2433 55.4022 55.1610 54.7360
Table 5 reflects the results of compare of mean-
Rlag between 2006 and 2007. The result shows that
in 2007 mean of Rlag is significantly less than that
in 2006 (t=-2.6591). It confirms that the timeliness
of report disclosure has improved due to the
institutional changes in 2007.
Table 6 reflects the change of mean-Rlag during
2006 to 2009, and it finds that mean of Rlag
decreased significantly in 2007compared with 2006
while it maintained at the same level in 2008 and
2009.The result above suggest that the reform of
new system has improved the situation of annual
report disclosure lag overall, and the improvement
was Long-term effective.
Table 7: Percentage of company disclosing report in Mar.
Year 2006 2007 2008 2009
Mar. (%) 35.6 41.9 49.1 47.7
Table 7 reflects the percentage of the number of
companies disclosing annual report in March in
2006-2009. We can find that the percentage
increased significantly during 2006 to 2008, and it
tended to recede in 2009. The result shows that the
percentage of the number of companies disclosing
annual report in March had increased significantly
due to the institutional reform.
The result suggest that the situation of timeliness
of annual report disclosure has significantly
improved in China after the reform of institution and
the improvement mainly concentrated in the second
half of the disclosure period combined with the
analysis of Table 2 and Table 3.
4.2 Market Response Analysis
This paper uses two variables (AR and CAR) to
measure the strength of the market reaction, and then
studies the information content of timeliness. Table
8 to Table 12 present the results of AR and CAR
caused by the timeliness of annual reports disclosure
(Model 2-Model 4).
Table 8 presents the result of relevance analysis
between AR and Rlag (Model 2). It shows that 12
trading days out of 17 observation days have
significant regression coefficients at the 0.05 or 0.01
level. The statistical significance is more clearly
reflected during the day 11 and the day 3 before the
disclosure day. In addition, 14 regression
coefficients are less than zero. The evidences above
show that the smaller Rlag is, the bigger AR is,
meaning that the more timely the disclosure of
report is, the stronger the market reaction is.
ACCOUNTING INFORMATION CONTENT AND TIMELINESS OF ANNUAL REPORT DISCLOSURE - An
Evidence from China's Listed Companies
405
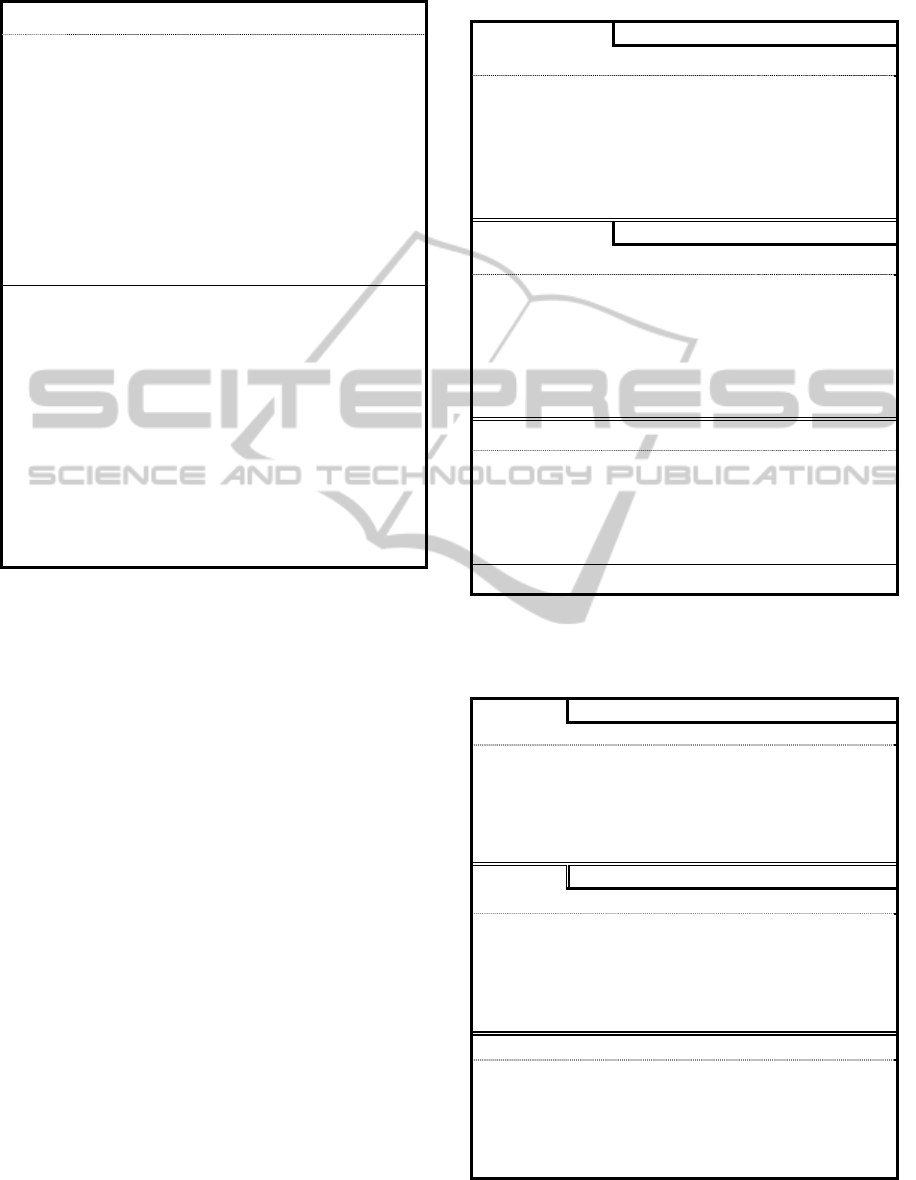
Table 8: Abnormal returns around disclosure.
Days Coefficient t-Value F-Value Sig.
-11 -0.00008 -2.2556 5.0878 0.02418*
-10 -0.00020 -4.1674 17.3673 0.00003**
-9 -0.00011 -3.0942 9.5742 0.00199**
-8 -0.00012 -4.0002 16.0017 0.00006**
-7 -0.00011 -3.3588 11.2817 0.00079**
-6 -0.00014 -3.9048 15.2477 0.00009**
-5 -0.00007 -1.9650 3.8612 0.04952*
-4 -0.00007 -2.0294 4.1183 0.04252*
-3 -0.00012 -3.0250 9.1505 0.00251**
-2 -0.00003 -0.8820 0.7780 0.37783
-1 0.00003 0.8940 0.7993 0.37137
0 -0.00004 -1.0693 1.1433 0.28502
1 -0.00005 -1.3110 1.7187 0.18998
2 0.00002 0.4445 0.1976 0.65672
3 -0.00012 -2.9276 8.5706 0.00344**
4 -0.00012 -2.8417 8.0753 0.00452**
5 0.00008 2.1906 4.7988 0.02856*
* Significant at the 0.05 level.
** Significant at the 0.01 level.
Table 9 presents the result of mean differences
comparative analysis of CAR grouped by report
disclosure earlier and later (Model 3). Result shows
that among all 5 intervals, there are 4 intervals
who’s CAR in early disclosure group (Jan. & Feb.)
is significantly bigger than that in late disclosure
group (Mar. & Apr.). This shows that listed
companies with annual reports disclosed earlier will
get better market reaction. It supports the hypothesis
2 of this paper.
Table 10 and Table 11 respectively show the
results of comparative analysis of CAR while the
samples are grouped by URlag and RLI (Model 3).
The analysis results show that CAR in early
disclosure group (RLI<0.3, URlag<0) is bigger than
that in late disclosure group (RLI>0.7, URlag>0)
among all the 5 intervals. And the result is
significant in the intervals of [-20, -3], [-20, +2] and
[-5, +5]. This reflects that the market reaction of
early disclosure group is stronger than that of late
disclosure group. The above results further support
the research hypotheses 2 of this paper: Companies
with early disclosure of their annual reports deliver a
stronger market reaction than those with later
disclosure.
Table 9: Cumulative Abnormal Return by bi-monthly
sample.
Interval
Mean
Jan. & Feb. Mar. & Apr.
[-20, -3] 0.090845 0.023563
[-20,+2] 0.098488 0.021351
[-5, +5] 0.039215 0.004218
[-2, +2] 0.007642 -0.002212
[-1, +1] -0.001936 -0.00431
Interval
St. Dev
Jan. & Feb. Mar. & Apr.
[-20, -3] 0.113971 0.110172
[-20,+2] 0.129946 0.126724
[-5, +5] 0.100501 0.096095
[-2, +2] 0.079571 0.073968
[-1, +1] 0.071061 0.057869
Interval Z-Value Sig.
[-20, -3] -10.9849 0**
[-20,+2] -11.0329 0**
[-5, +5] -6.48868 0**
[-2, +2] -2.31545 0.010294*
[-1, +1] -0.63346 0.263215
* Significant at the 0.05 level.
** Significant at the 0.01 level.
Table 10: Cumulative Abnormal Return by RLI.
Interval
Mean
RLI<0.3 RLI>0.7
[-20, -3] 0.115494 0.014266
[-20,+2] 0.118977 0.009399
[-5, +5] 0.023766 0.002502
[-2, +2] 0.003483 -0.004867
[-1, +1] -0.005702 -0.005694
Interval
St. Dev
RLI<0.3 RLI>0.7
[-20, -3] 0.119024 0.118076
[-20,+2] 0.128209 0.136097
[-5, +5] 0.110129 0.105047
[-2, +2] 0.090953 0.081236
[-1, +1] 0.080079 0.061966
Interval Z-Value Sig.
[-20, -3] -8.323938
0**
[-20,+2] -8.320053
0**
[-5, +5] -1.894145
0.029103*
[-2, +2] -0.903715
0.183073
[-1, +1] 0.001005
0.499599
* Significant at the 0.05 level.
** Significant at the 0.01 level.
ICEIS 2011 - 13th International Conference on Enterprise Information Systems
406
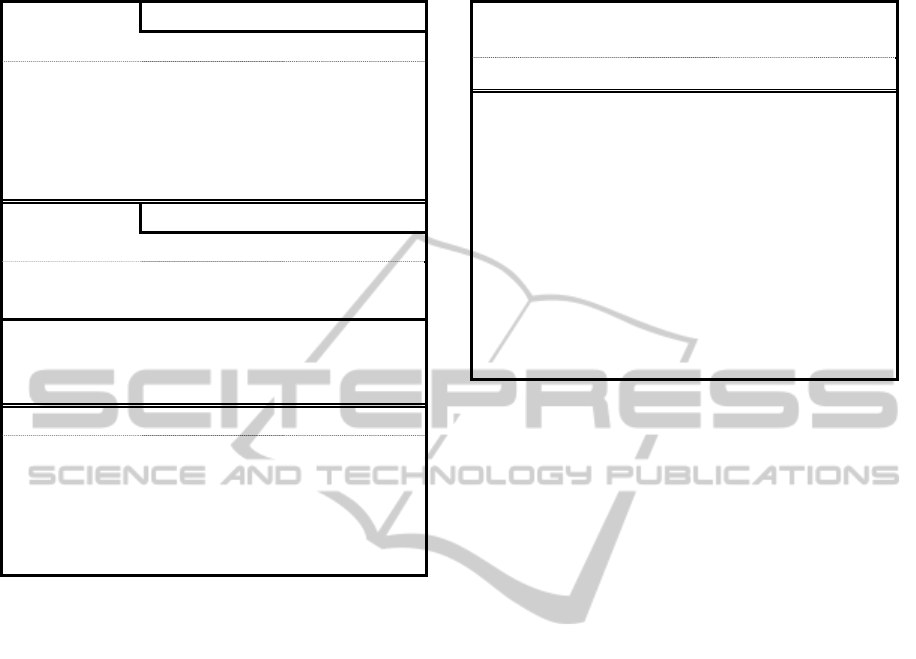
Table 11: Cumulative Abnormal Return by URlag.
Interval
Mean
URlag<0 URlag>=0
[-20, -3] 0.041738 0.024931
[-20,+2] 0.043843 0.021501
[-5, +5] 0.015183 0.003634
[-2, +2] 0.002105 -0.00343
[-1, +1] -0.001133 -0.006436
Interval
St. Dev
URlag<0 URlag>=0
[-20, -3] 0.107114 0.117377
[-20,+2] 0.124877 0.133158
[-5, +5] 0.094637 0.099478
[-2, +2] 0.072653 0.07655
[-1, +1] 0.059161 0.060292
Interval Z-Value Sig.
[-20, -3] -8.323938
0.000026**
[-20,+2] -8.320053
0**
[-5, +5] -1.894145
0.000653**
[-2, +2] -0.903715
0.022506*
[-1, +1] 0.001005
0.008280**
* Significant at the 0.05 level.
** Significant at the 0.01 level.
Finally, table 12 presents the result of relativity
analysis between timeliness and CAR, after
controlling the variables such as company features
and market factors (Model 3). The regression
analysis of CAR in the intervals of [-20,-3] and [-20,
+2] shows similar features, i.e., the regression
coefficient of URlag is negative number and it is
statistically significant at the 0.01 level. The result
shows that the CAR of early disclosure group is
bigger than that of the late disclosure group.
Besides the performance variable EPS and CAR
is positively correlated and the relationship of the
audit opinion and the CAR is significant negative,
which is consistent with previous researches. In
addition, the nature of ownership variable CONT
and CAR are positively correlated; reflecting that
investor’s expectations on the performance of non-
state enterprises is lower than that of the state-owned
enterprises in the Chinese market.
Therefore, the annual reports of non-state
enterprises are more likely to surprise the market
and achieve higher abnormal returns those of state
enterprises do. The result also shows that INDU and
CAR are positively correlated; meaning that
compared with non-competitive industry protected
Table 12: Multivariate regression.
CAR(-20,-3) CAR(-20,2)
R
2
0.0434 0.0442
Var.
coefficient t-Value coefficient t-Value
URlag -0.000912 -7.3** -0.000959 -6.56**
SIZE -0.01313 -6.65** -0.014054 -6.08**
LAR 0.020623 1.77* 0.015413 1.13
PUBL -0.013033 -1.46 -0.01297 -1.24
EPS 0.006208 1.21 0.010268 1.71*
UE 0.002824 0.53 0.001611 0.26
AUDI -0.034434 -1.74* -0.040022 -1.73*
EXCH -0.01132 -2.65** -0.005558 -1.11
INDU 0.006902 1.63 -0.002025 -0.41
* Significant at the 0.05 level.
** Significant at the 0.01 level.
by the government, the timeliness of report
disclosure of competitive industry may cause
stronger market reaction, and has more information
content.
The above analysis shows that annual reports of
the non-state listed company in a competitive
industry have a strong market reaction with earlier
disclosure, better performance and cleaner opinion,
which further confirms the research hypothesis 2.
5 CONCLUDING COMMENTS
The paper empirically examines whether timeliness
of China’s accounting information has improved and
possesses information content after a series of
institutional changes, based on a sample of 2927
non-financial Chinese listed corporations during
2007-2009. We uses abnormal return (AR) and
accumulative abnormal return (CAR) as proxy
variables of market reaction and process the data
through statistics and multiple regression analysis.
In the analysis of current situation and timeliness
improvement, this paper firstly divides the sample
into two groups by months and trading days, and
uses descriptive statistic to analyze the current
situation and the improvement of timeliness over
time. The results prove that the information
disclosure of listed companies in China has a trail in
general. By comparing the mean of the Rlag during
2006-2007, it confirms that the timeliness of report
disclosure has improved due to the institutional
changes. This kind of improvement will last long
ACCOUNTING INFORMATION CONTENT AND TIMELINESS OF ANNUAL REPORT DISCLOSURE - An
Evidence from China's Listed Companies
407

and mainly reflect on the late half of disclosure
period.
In analysis of information content of timeliness,
we firstly analyze the co-efficiency between
reporting lag and abnormal returns. The empirical
evidence suggests that the relationship between
abnormal returns around announcement date and the
reporting lag is obviously negative. Secondly, this
paper conducts a comparative average analysis on
the cumulative abnormal returns of the early
disclosure group and the late disclosure group
around the announcement date. The results show
that the cumulative abnormal returns of early
disclosure groups are greater than that of the late
disclosure groups. Finally, in control of the company
size, ownership nature, revenue, exchange and other
variables, we further discussed the relationship
between reporting delay and cumulative abnormal
returns. Results of a multiple regression analysis
confirm that early disclosure always has a stronger
market response. All of the results above are
consistent with the second hypothesis: In
comparison with companies that make late
announcements, companies that make early
announcements tent to surprise the market with
higher price reactions, which proves that timeliness
has information content.
The new findings of this paper is that timeliness
of information disclosure has improved and has
information content in China market with some new
characteristics since the new institutions were
implemented. The results also confirm that in the
emerging market of China, state-owned enterprises
and enterprises in a competitive industry, the
information content of timeliness of annual reports
disclosures is more obvious.
REFERENCES
Ahmed, K., 2003. The Timeliness of Corporate Reporting:
A Comparative Study of South Asia. Advances in
International Accounting, 16: 17-43.
Annaert, J., Marc J. K. DeCeuster, R. Polfliet, R. & Van
Campenhout, G.2002. To be or not be…‘Too late’: The
case of the Belgian semi-annual earnings
announcements. Journal of Business Finance &
Accounting, 29(3&4): 477-495.
Chai, M. L., S. Tung, 2002. The effect of earnings
announcement timing on earnings management.
Journal of Business Finance & Accounting, 29 (9 &
10), 1337-1354.
Chambers, A., S. Penman, 1984. Timeliness of reporting
and the stock price reaction to earnings announcements.
Journal of Accounting Research, 22(1): 21-47.
Chen, G. M., C. Louis, G. Ning, 2005, Information content
and timing of earnings announcements, Journal of
Business Finance & Accounting, 32(1): 65-95.
DoFond, M., M. Y. Hung, R. Trezevant. 2007, Investor
protection and the information content of annual
earnings announcements: International evidence.
Journal of Accounting and Economics, 43: 37-67.
Gigler, F. B., T. Hemmer. 2001. Conservatism Optimal
Disclosure Policy and the Timeliness of Financial
Reports. The Accounting Review, 76(4): 471-493.
Gilvoly, D., D. Palmon. 1982. Timeliness of Annual
Earnings Announcements: Some Empirical Evidence.
The Accounting Review, 57: 486-508.
Han, J. C. Y., S. Wang, 1998. Political costs and earnings
management of oil companies during the 1990 Persian
Gulf Crises. The Accounting Review, 73, 103-117.
Haw, I. M., D. Qi, W. Wu, 2000. Timeliness of annual
report releases and market reaction to earnings,
announcements in an emerging capital market: The
case of China. Journal of International Financial
Management and Accounting, (11): 108-131.
Haw, I. M. G., K. Park, D. Qi, W. Wu. 2003. Audit
qualification and timing of earnings announcements:
Evidence from China, Auditing: A Journal of Practice
& Theory, 22 (2): 121-146.
Kinney, W. R., Jr., L. S. McDaniel. 1993. Audit delay for
firms correcting quarterly earnings, Auditing: A
Journal of Practice & Theory, 12: 135-142.
Kross, W., D. A. Schroeder. 1984. An empirical
investigation of the effect of quarterly earnings
announcement timing on stock returns, Journal of
Accounting Research, 22: 153-176.
Landsman, W. R., E. L. Maydew, 2011. J. R. Thornock.
The information content of annual earnings
announcements and mandatory adoption of IFRS. The
UNC Working Paper.
McGee, R. W., 2007. Corporate governance and the
timeliness of financial reporting: A case study of the
Russian energy sector. 5th International Conference on
Accounting and Finance in Transition. London, July
12-14.
McGee, R. W., Y. Li, 2008. Corporate governance and the
timeliness of financial reporting: An empirical study of
the People's Republic of China. Florida International
University Working Paper.
Rees, W. P., B. Giner, 2001. On the asymmetric
recognition of good and bad news in France, Germany
and the UK. Journal of Business Finance &
Accounting, 28 (9&10): 1285-1332.
Whittred, G. P. 1980. Audit qualification and the
timeliness of corporate annual reports. The Accounting
Review, 55:563-577.
ICEIS 2011 - 13th International Conference on Enterprise Information Systems
408
