
A NEW NETWORK TRAFFIC PREDICTION MODEL IN
COGNITIVE NETWORKS
Dandan Li, Runtong Zhang and Xiaopu Shang
The Institute of Information Systems, Beijing Jiaotong University, Beijing, China
Keywords: Cognitive networks, Ant colony algorithm, Neural network, Wavelet, BP (back propagation) neural
network, Network traffic prediction.
Abstract: With the development of the network technology and the increasing demands on communication, more
complex, heterogeneous, and suitable network structures are right on their way to come. Cognitive networks
can perceive the external environment; intelligently and automatically change its behavior to adapt the
environment. This feature is more suitable to provide security for users with QoS. This paper proposes a
hybrid traffic prediction model, which trains BPNN with Ant Colony Algorithm based on the analysis of the
present models, in order to improve the cognitive feature in the cognitive networks. The proposed model
can avoid the problem of slow convergence speed and an easy trap in local optimum when coming up with a
fluctuated network flow. At the beginning, the model rejects the abnormal traffic flow data, and then use
wavelet decomposition, in the following steps, the model predicts the network traffic with the hybrid model.
Thus, the traffic prediction with high-precision in cognitive networks is achieved.
1 INTRODUCTION
A cognitive network (CN) has a cognitive process
that can perceive current network conditions, and
then plan, decide and act on those conditions. The
network can learn from these adaptations and use
them to make future decisions, all while taking into
account end-to-end goals (Thomas et al., 2005).
With the wide application of multi-media on the
Internet, Quality of Service (QoS) of the network
becomes more and more important. The
advancement of CN can improve the user
experience.
The feature of the network traffic reflects the
interaction and influence in the process of data
transmission. By analyzing the traffic data, people
can better learn the interior operation mechanism of
the network and build a mathematical model that can
depict the traffic data flow more accurately.
Designing a traffic prediction model with the
cognitive feature can make networks give a more
reasonable bandwidth assignment, traffic control,
routing control, admission control and error control,
et al (Wang et al., 2005). It is a good method to
improve QoS.
CN has the capacities of self-learning and self-
adaption. Therefore, researching a real-time
prediction model of the traffic based on CN can
better solve the problem of load balancing
hysteresis. And a high-precision traffic prediction
model, especially short-term one, can improve the
cognitive feature of CN. However, current network
traffic prediction models are mostly based on regular
networks, few of them specially research on
cognitive features of networks. Usually, their self-
learning and self-adaption capacities are not so
good, cannot express the cognitive features either, so
it is hard to be applied in CN directly.
By analyzing the advantage and disadvantage of
current network traffic prediction models, and
combining the features of CN, we propose a new
network traffic prediction model. It is a hybrid
model with double-BPNN. BP neural network is
employed twice and Ant Colony Algorithm (ACA)
is employed to train weight values, so it is also
called ACA BP-Double model for short.
This paper is divided into six parts. Section II
gives a summary about current network traffic
prediction models. In section III, we give a brief
introduction of the related theories. A detail
description of the Ant Double-BP model is presented
in section IV. Simulation analysis of the model is
shown in section V. Section VI is the conclusion. the
final formatting of your paper.
427
Li D., Zhang R. and Shang X..
A NEW NETWORK TRAFFIC PREDICTION MODEL IN COGNITIVE NETWORKS.
DOI: 10.5220/0003593504270435
In Proceedings of the 13th International Conference on Enterprise Information Systems (NMI-2011), pages 427-435
ISBN: 978-989-8425-53-9
Copyright
c
2011 SCITEPRESS (Science and Technology Publications, Lda.)

2 BRIEF LITERATURE REVIEW
Current network traffic prediction methods can be
divided into two types: linear prediction and
nonlinear prediction. Linear method, such as (Jin et
al., 2003; Yu and Zhang, 2004; Sang and Li, 2000)
which are in the use of Auto-regressive Integrated
Moving Average Model (ARIMA), is popular. The
precondition to use ARIMA model is that the
network traffic must have feature of linear wide
stationary processes, while the network traffic
always has multi-scale feature in different time
frequency scales (Gao et al., 2001) and the nature of
multi-construct and self-similarity as well (Leland et
al., 1994; Paxson and Floyd, 1995). So it is hard to
express the whole feature of network traffic with
ARIMA singly.
Neural Network (NN) shows its great advantage
in prediction because of its capacities of nonlinear
approximation, self-learning and fitting, for example,
(Husmeier and Taylor, 1998; Hussain, 2001;
Wakurah and Zurada, 2001) achieve ideal results
with NN. Wavelet Transform (WT) is one of the
most effective methods in dealing with non-
stationary time series, so there are nonlinear
researches combined the advantages of NN and WT
representative into Wavelet Neural Network
(WNN), Li et al., 2007). References (Lei and Yu,
2006) and (Peng and Yuan, 2008) employ WT and
three layers BPNN; Reference (Zhao and al., 2005)
employs WNN in Next Generation Network (NGN);
Reference (Yao et al., 2007) uses WT, RBFNN and
Elman NN, then synthesizes outputs with BPNN;
Reference (Tian and Yu, 2008) combines WT with
FIRNN. These applications depict the feature of
network traffic flow very well, and reach high-
precision. Back Propagation (BP) algorithm is the
most popular one nowadays, mainly because it is on
the basis of strong theories and uses widely. But BP
algorithm is based on gradient descent algorithm, so
it needs a long time to train weight values, and easily
falls into local optimum.
ACA (Schoonderwoerd et al., 1996) is a new
evolutionary optimization algorithm from the natural
behavior of ant colony. It possesses characteristics
of high speed, global convergence and heuristic
study. Recent years, there are some models which
combine ACA with BPNN, for example, (Wang et
al., 2003; Yang et al., 2009; Gao, 2008; Pokudom,
2009) determination of appropriate BPNN structure
and weight using ACA. The simulation results show
that extensive mapping ability of CN and rapid
global convergence of ACA can be obtained by
combining ACA with NN. But because network
condition is complex and uncertain, and users who
access network are diverse, data like sudden traffic
appears easily, thus affect the precision of traffic
prediction. First, the data mean nothing to network
traffic prediction. If we use them to train BP NN,
they will increase the complexity of model, and
reduce the accuracy of model. Second, when we deal
with data using WT or normalization, it will affect
the precision because of the abnormal data. So, it is
necessary to deal with the original data first, to reject
abnormal data. In this way,(Wang et al., 2009)
proposes a model using double BPNN. Firstly, it
judges, identifies and rejects abnormal data with
BP1, then inputs them into BP2 to train.
Besides, some researches have proposed to
employ hybrid models to depict the feature of
network traffic flow. For example, (Yao et al., 2007)
combines RBFNN, Elman NN with BPNN.
Reference (Feng et al., 2006) expresses the
interaction and non-stationary of traffic flow by
means of linear NN and Elman NN, and compounds
these outputs from previous models with BPNN to
become final results. This hybrid model obtains a
good effect, and improves fitting and predicting
precision.
But the aforementioned models are mainly based
on regular network, their self-learning and self-
adaptation is not so good, and cannot be employed
in CN directly. According to such considerations, a
traffic prediction model is proposed, which can be
applied in CN. This model applies hybrid NN, and
double BPNN (Wang et al., 2009) as for reference.
The results obtained show that it is more accurate
than other models.
3 RELATED THEORIE
In this section, we review some related theories
which involved the model of Ant Double-BP. Such
as ARIMA, Elman NN, BP NN, WT and ACA.
3.1 ARIMA
ARIMA is a time series prediction model. It is the
typical representative of linear prediction models,
which can supply accurate short term prediction.
Now, we introduce ARMA first. ARMA(p,q) is
given by (1).
011 1122
... ...
ttptptttqtq
yy y
ϕ
ϕϕεθεθεθε
−
−−−−
=+ ++ ++ + ++
(1)
where y
t
is an observed value of period t. ε
t
is an
error or deviation of t period, that’s to say, it is the
ICEIS 2011 - 13th International Conference on Enterprise Information Systems
428
random factors which cannot be explained by model.
φ
i
and θ
i
are the parameters to be estimated, i
∈
[1,p],
j
∈
[1,q].
If a time series is non-stationary, we handle data
with zero-mean and difference stationary to make it
become a stationary time series. After processing,
ARMA becomes ARIMA. ARIMA(p,d,q) is given
by (2).
() ()
d
tt
By B
φ
δθ ε
Δ=+
(2)
Where
12
( ) 1 ...
p
p
BBBB
φφφφ
=− − − −
(3)
12
() 1 ...
q
q
BBBB
θθθθ
=− − − −
(4)
△
is difference.
△
d
is d-order difference. B
k
is k-
steps shift operator, it means
k
ttk
Bx x
−
= . φ(B) is
autoregressive operator. θ(B) is shift mean operator.
From the analysis we can see that, ARMA is a
special example of ARIMA when d=0. It means both
non-stationary and stationary time series could be
expressed with ARIMA(p,d,q).
3.2 Wavelet Transform
Wavelet Transform is one of the most effective
methods in dealing with non-stationary time series.
Generally speaking, for an arbitrary continuous
variable function or signal f(t), continuous WT is
given by (5), and we call it WT for short.
1/ 2
[](,)| | ()( )
tb
Wfab a ft dt
a
ψ
ψ
∞
−
−∞
−
=
∫
(5)
While discrete WT is given by (6).
/2
000
[](,)| | ()( )
mm
Wfmn a ft atnbdt
ψ
ψ
∞
−−
−∞
=−
∫
(6)
where a is scale parameter. b is step parameter.
ψ
(t)
is a basic wavelet, which is positive and negative
shocks, its mean is zero. f(t) is a square integrable
function, f(t)
∈
L
2
(R). a=a
0
m
,
b=nb
0
a
0
m
(m, n
∈
Z).
In this paper, we decompose network traffic with
Mallat algorithm (Zhang, 2008). It is an easy
recursion formula for wavelet and scale parameter,
based on (7).
0
1/2
11
1/ 2
11
() ()
() 2 [ (2) (2 1)]
() 2 [ (2) (2 1)]
jjj
jjj
Ak fk
Ak AkAk
Dk D k D k
−
++
−
++
⎧
=
⎪
⎪
=++
⎨
⎪
=++
⎪
⎩
(7)
where j
∈[1,L], L is steps of layer. A
j
(k) and D
j
(k)
are approximate and detailed signal.
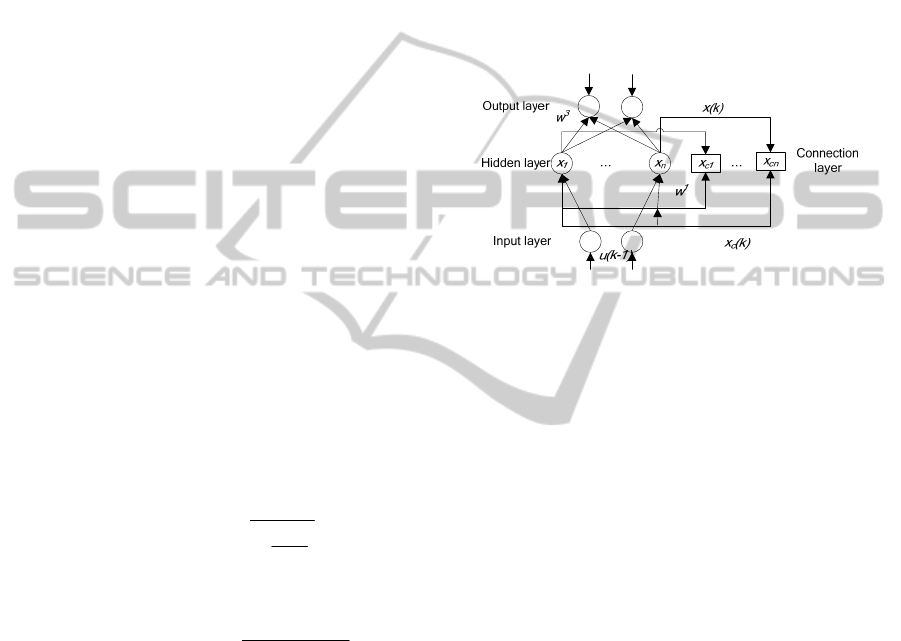
3.3 Elman Neural Network
Elman NN is proposed by Elman in 1990,which is
based on the basic structure of BPNN with dynamic
mapping by storing inside situation. The system can
hence, adapt to time-variant characteristics through
Elman NN. Elman NN is four layers which are
input, output, intermediate (or called hidden) and
connection layer. The structure shows in Fig. 1.
Figure 1: Stucture of Elman NN.
Its nonlinear expression is given by (8).
3
12
() ( ())
() ( () (( -1)))
() ( -1)
c
c
yk gwxk
xk f wx k w uk
xk xk
⎧
=
⎪
=+
⎨
⎪
=
⎩
(8)
where y is a m-dimension output node vector. x
is a
n-dimension intermediate layer node element vector.
u is r-dimension input vector. x
c
is n-dimension
feedback state variable. w
1
is connection weight
value between connection layer and intermediate
layer. w
2
is connection weight value between input
layer and intermediate layer; w
3
is connection weight
value between output layer and intermediate layer.
g(x) is both transmit function of output neurons and
linear combination of intermediate output. f(x) is
transmitting function of intermediate neurons.
3.4 Ant Colony Algorithm
An ant always can find the shortest path between
food source and formicary. That is because when
ants cross the road, they leave something volatile,
we call it pheromone. So the more ants walk across
the road, the more pheromone will be left; while the
more pheromone, the more ants follow it on this
path. If there is no ant on the path, the path
pheromone volatilizes itself, which is called positive
feedback effect. The steps of ACA show in Fig.2.
A NEW NETWORK TRAFFIC PREDICTION MODEL IN COGNITIVE NETWORKS
429
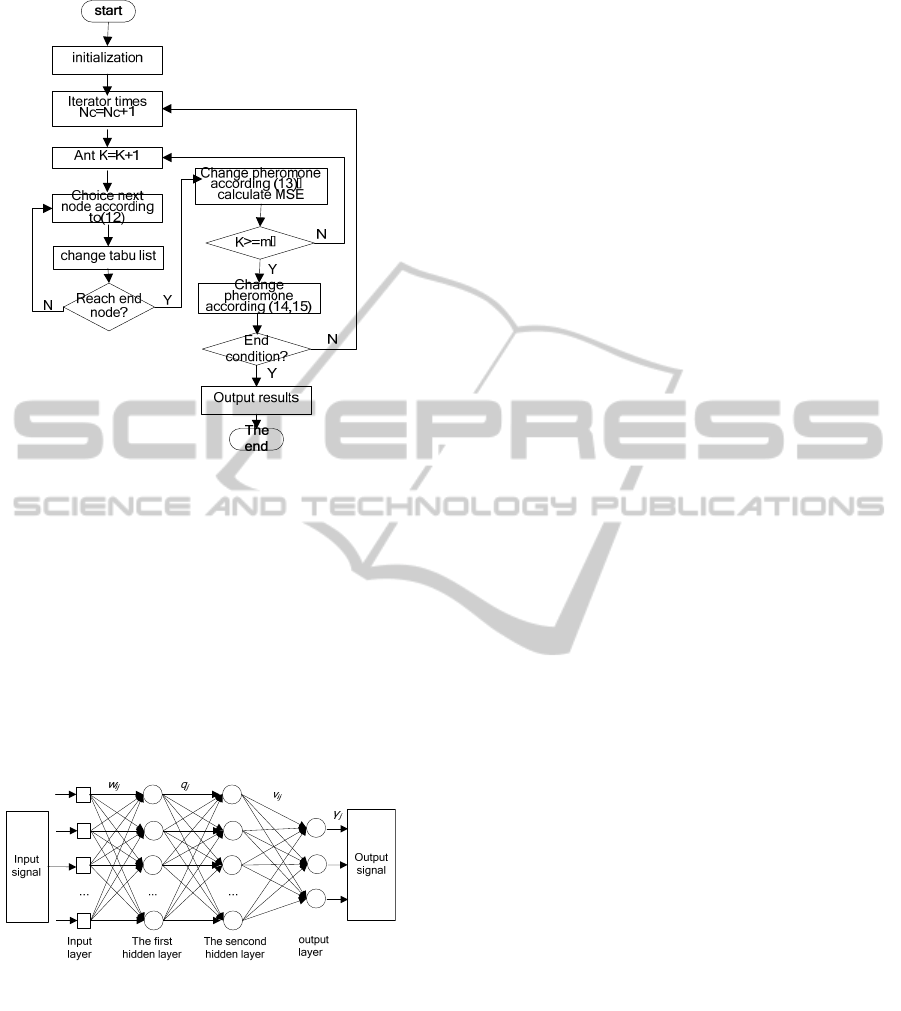
Figure 2: Steps of ACA.
3.5 BP Neural Network
BPNN is a multilayer feedforward neural network
which trains network with error back-propagation
algorithm. If we input a pair of training samples into
BPNN, neuron value will transmit from input layer
to output layer visa all intermediate layers, and
obtain reflection of network at output layer neurons.
Then according to direction of the error between real
and object output, it changes connection weight
values reversely from output to input layer.
Figure 3: Structure of BP NN with several layers.
Fig.3 is the structure of BPNN with one input
layer, one output layer and two hidden layers, the
network is fully connected. BPNN is based on
gradient descent algorithm. Its efficiency is low
because the use of complex optimization functions.
Besides, BP is a local optimization searching
algorithm hence, the possibility of failure is very
large. Thirdly, the weight values of BPNN are
mostly based on training data. So considering the
processing of training weight value is similar to the
way of ants finding food, we determine BP structure
and weight values by ACA.
4 ACA DOUBLE-BP MODEL
The goal of CN is to optimize the end-to-end
performance of QoS which is for the whole network
not any nodes. CN can learn by itself in the process
of dynamic adaptation, and accumulate experience
for the future acting and deciding. Otherwise, CN
has the foreseeing ability, and its adjustments
happen before what will happen not after that. In this
section, a new network traffic prediction model
which has the features of CN is proposed. It is a
high-prevision model which can be employed in CN
better, and realizes optimization of end-to-end’s
QoS.
4.1 The Basic Idea
The training data are from real network, so there are
some abnormal data in them. They are caused by
artificial factors and other reasons related to
network. Before using them to train weight values,
we must reject these abnormal data first because it
means nothing for traffic prediction. If we do not
reject them, the complexity of model will be
increased, and the precision will be lowered. So, in
this paper, we reject the abnormal data using
abnormal data rejecting network called BP1.
Network traffic flow has the features of multi-
scale, multi-construct, non-stationary and self-
similar. In order to make it stationary, WT is
employed. After that, the data are decomposed to the
scaling coefficient series and wavelet coefficient
series. And the coefficient series is taken as input of
ARIMA and Elman NN. At last, we fit data with
BP2, and output network traffic of prediction.
From the mathematical point of view, BPNN is
based on gradient descent algorithm which is a local
optimization searching algorithm. But the problem
that resolved is global extreme value of complex
nonlinear function, it easily falls into local optimum
and fails the training. Besides, the approximation
and extension capacity of network is closely related
to training samples. It shows that how to choose
typical samples become the key problem of network.
So, in this paper, we determine BP structure and
weight value using ACA. It can avoid the problem
of local optimum and lower the speed of
convergence while the weight value has no business
of training samples.”
ICEIS 2011 - 13th International Conference on Enterprise Information Systems
430
4.2 Procedure
According to the considerations, ACA Double-BP
model is proposed to be employed in forecasting
network traffic flow, which uses ACA to determine
BP structure and weight value. Framework of the
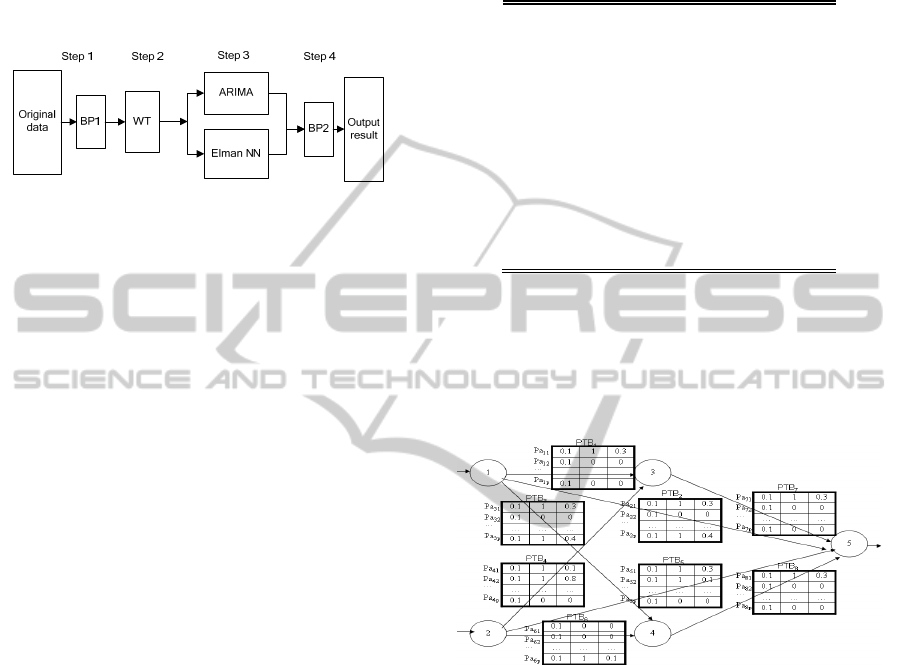
proposed model shows in Fig. 4.
Figure 4: Framework of ACA Double-BP model.
According to Kolmogorov theorem , regular
nonlinear function only needs three layers BP NN.
So in ACA Double-BP model there are three layers
in both BP1 and BP2: one input layer, one hidden
layer and one output layer. In order to express it
clearly, we divide proposed model into four stages.
Stage 1: Rejecting abnormal data. In this stage,
abnormal data are rejected from original data with
BP1. The framework of BP1 is similar to Fig.3
except one hidden layer. There is one node in input
layer and two nodes in output layer. The output is 1
when signal is effective or is 0.
Stage 2: Wavelet transmission. Data which
output 1 are transmitted with Mallat algorithm (7),
multi-scale, multi-construct, non-stationary and self-
similar data are divided into two parts: scaling
coefficient series with feature of stationary and
wavelet coefficient series with high-frequency.
Stage 3: Forecasting traffic flow. ARIMA and
Elman NN are combined to predict stationary
wavelet scaling coefficient series with (2) and
wavelet coefficient series with high-frequency with
(8).
Stage 4: Integrating data and reducing errors.
Outputs which from stage 3 are Integrated with BP2.
It is to fit data by using the function approximation
ability of BP NN, and to reduce errors which caused
by single model. The outputs are predicted results.
4.3 Determination of Appropriate BP
NN Weight Value using ACA
In this section we take (Pokudom, 2009) for
reference. The parameter table is a set of parameters
on each route, represent by PTB
n
. Where n is a
sequence of route in network. Which is consist
group of the parameters for an ant choose from
PTB
n
, each parameter in PTB
n
represent by pa
ni
,
where i = 1,2,…, P (P is the number of parameter in
PTB
n
). The pa
ni
consist pheromone (τ
ni
), connection
(c
ni
) and weight (w
ni
), shows in Table I.
Table 1: The parameter table (ptbn) on route n.
Nu
mber
Phero
mone
Conne
ction
W
eight
Pa
n1
τ
n1
c
n1
w
n
1
Pa
n2
τ
n2
c
n2
w
n
2
Pa
n3
τ
n3
c
n3
w
n
3
…
…
……
……
…
…
Pa
np
τ
np
c
np
w
n
p
Detailed steps are as following.
Step 1: Initialization. Give an initial value for
pa
ni
for all PTB
n
on the routes. Set τ
ni
=τ
0
, where τ
0
is
the initial value of the pheromone. The rest
parameters are random. Take 2
×2×1 BP NN for
example, Fig.5 is the framework of ant k=1.
Figure 5: The parameter table (PTBn) on every route.
Step 2: Route traversal. An ant k starts from
arbitrary route, selects pa
ni
from PTBn is given by
(9) and (10). It depends on a random variable q
uniformly distributed over [0,1], and a parameter q
0
(q
0
∈
[0,1]). Mmean square error (MSE) is calculate.
An ant k which traversals all routes decodes the
parameters shows in Fig.6. Then BP structure is
determined shows in Fig.7.
10
arg max { },
,
ip ni
ni
qq
i
pelse
τ
<<
≤
⎧
⎪
=
⎨
⎪
⎩
(9)
1
/
p
ni ni nj
j
p
τ
τ
=
=
∑
(10)
Step 3: Updating local pheromone. An ant k
applies this step only to the pa
ni
choosed form all
A NEW NETWORK TRAFFIC PREDICTION MODEL IN COGNITIVE NETWORKS
431
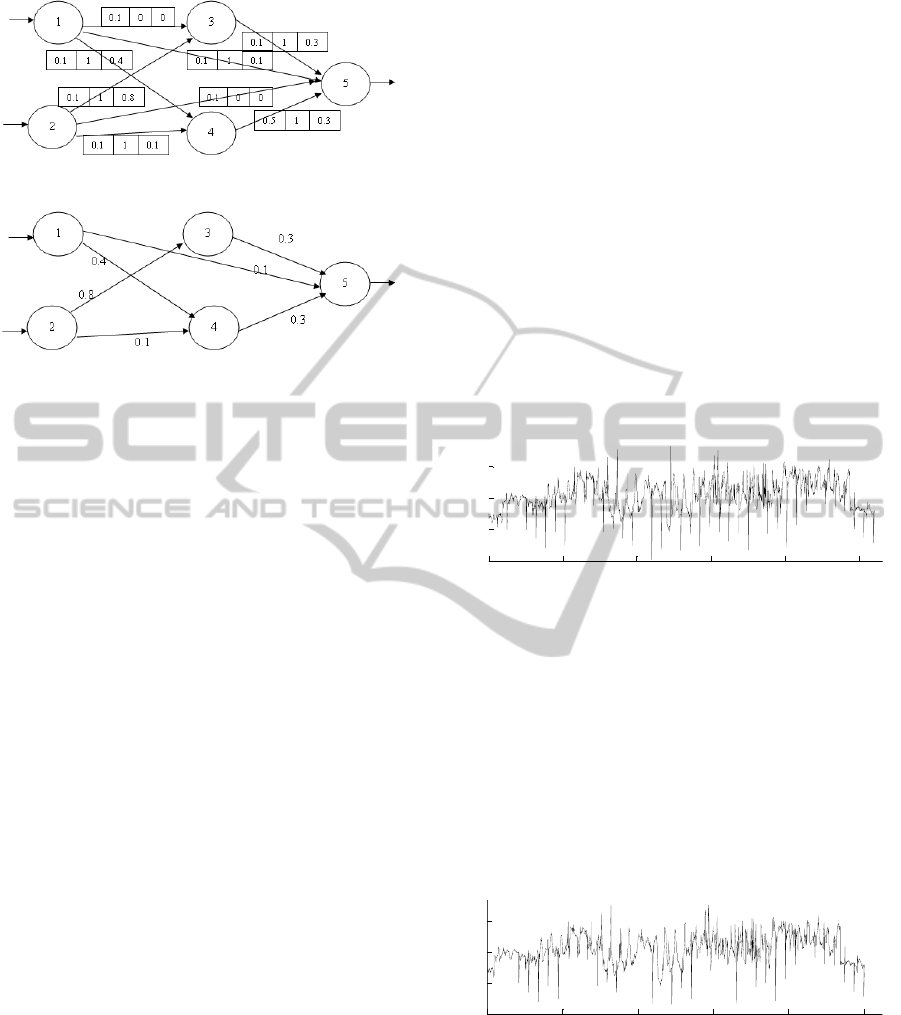
Figure 6: The parameter of ant k.
Figure 7: The structure of ant k.
PTBn in the routes, then it updates the pheromone
(τ
ni
) level is performed by applying (11).
0
(1 )
ni ni
τ
ϕτ ϕτ
=− +
(11)
where
∈
φ (0,1], and φ is the pheromone decay
coefficient.
Step 4: Repeat step2-step4, for every ant.
Step 5: Updating global pheromone. A global
update is applied to the pheromone on the pa
ni
belonging to the best solution or least MSE using
(12) and (13).
(1 ) ,
,
ni ni best
ni
ni
iMSE
otherwise
ρτ ρ τ
τ
τ
−+Δ∈
⎧
=
⎨
⎩
(12)
And
1/
ni best
M
SE
τ
Δ=
(13)
where ρ
∈
(0,1), and ρ is the evaporation rate, Δτ
ni
is
additional pheromone and MSE
best
is the least MSE
of the tour ant.
Step 6: Judging end condition. If the maximum
number of iteration is run or it reaches the error
precision that is given before, go step 7; else go step
2.
Step 7: Determination of BP structure and weight
value. Use c
ni
to determine BP structure, it means
deleted connections which c
ni
=0, and left
connections which c
ni
=1. The weight value is the
result that is convergence by ACA.
Step 8: The end.
From this algorithm we can see that it does not
completely depend on original data using ACA, and
makes the whole model posses better self-learning
and self-organization ability. It embodies the feature
of CN well, and more suitable in CN.
5 SIMULATION AND ANALYSIS
In this section, MATLAB (Liu et al., 2008) is
employed to simulate and analyze ACA Double-BP
model. The structure of BP1 is 9
×10×1 with three
layers, and BP2 is 9
×10×2 with three layers. The
learning rate is set to 0.01, the number of ants is 30,
the maximum iteration is 100, p=60, q
0
=0.9, ρ=0.9,
ϕ
=0.9.
The simulated data are history data from a core
router of backbone of 1 hour intervals. The number
is 1,040, and the last 140 is for detecting fitting
results. The curve of the network traffic flow shows
in Fig. 8.
0 200 400 600 800 1000
0
500
1000
1500
Figure 8: The curve of original data.
In Fig. 8, abscissa represents time, and ordinate
represents traffic data. The unity is hour and kb/sec.
Range is [0,1816.73].
5.1 Reject Abnormal Data using BP
There are abnormal data in original data caused by
artificial factors or other reasons related to network,
for example, the moment traffic is 0kb/sec. The
curve of the network traffic which has rejected
abnormal data shows in Fig.9 .
0 200 400 600 800 1000
0
500
1000
1500
Figure 9: The curve of data which reject abnormal one.
In Fig. 9, abscissa represents time, and ordinate
represents traffic data. The unity is hour and kb/sec.
After rejecting abnormal data, there is 1001 left,
range is [159.79, 1765.24].
ICEIS 2011 - 13th International Conference on Enterprise Information Systems
432
5.2 Wavelet Transmission
For traffic data in Fig. 9, transmit them by (7). L=5,
wavelet coefficient series after transmitting is {
D1(k), D2(k), D3(k), D4(k), D5(k), A5(k)}, and
t=d1+d2+d3+d4+d5+a5, the result shows in Fig.
10.
0 200 400 600 800 1000
0
1000
2000
Wavelet Decomposition(db4 at level 5:s=a5+d5+d4+d3+d2+d1)
Kb/s
0 200 400 600 800 1000
500
1000
1500
a5
0 200 400 600 800 1000
-500
0
500
d5
0 200 400 600 800 1000
-500
0
500
d4
0 200 400 600 800 1000
-500
0
500
d3
0 200 400 600 800 1000
-500
0
500
d2
0 200 400 600 800 1000
-1000
0
1000
d1
Figure 10: The result of data WT.
In Fig. 10, the first one is original data, the
second one a5 is low-frequency data, from the third
to the seventh are high-frequency data d1, d2, d3, d4
and d5.
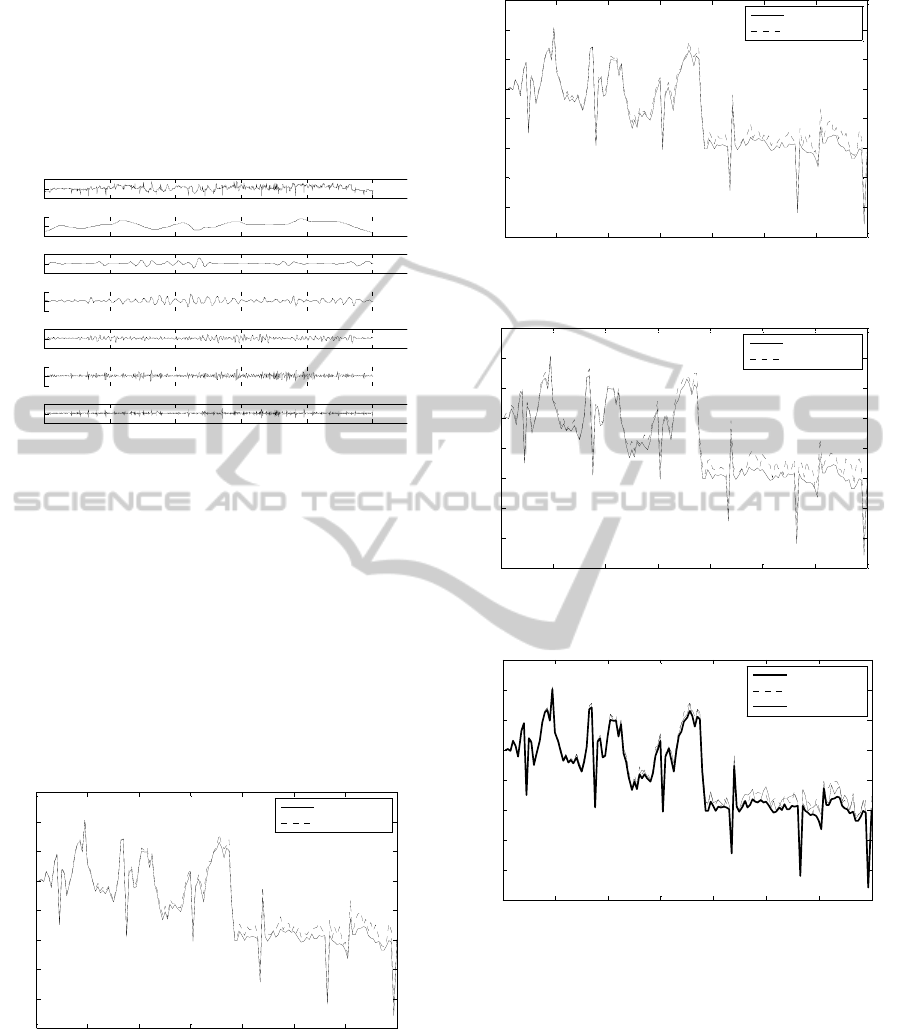
5.3 Traffic Prediction
Input a5 to ARIMA, input d1, d2, d3, d4 and d5 to
Elman NN. Then combine outputs of ARIMA and
Elman as inputs, input them to BP2 to predict.
The fitting result by last 140 signals shows in Fig.
11, it is a short time prediction for one hour.
0 20 40 60 80 100 120 140
200
400
600
800
1000
1200
1400
1600
1800
traffic:kb/s
time:hour
original value
predicted value
Figure 11: Proposed model one hour prediction.
Fig. 12 is the fitting result by last 140 signals
which is a short time prediction for two-hour. And
Fig. 13 is 24-hour. The proposed model ACA
Double-BP compared with WNN shows in Fig. 14.
From Fig. 11-12, we can see that ACA Double-
BP model reaches high precision and fitting degree
0 20 40 60 80 100 120 140
200
400
600
800
1000
1200
1400
1600
1800
traffic:kb/s
time:hour
original value
predicted value
Figure 12: Proposed model two-hour prediction.
0 20 40 60 80 100 120 140
200
400
600
800
1000
1200
1400
1600
1800
t
ra
ffi
c:
kb/
s
time:hour
original value
predicted value
Figure 13: Proposed model 24-hour prediction.
0 20 40 60 80 100 120 140
200
400
600
800
1000
1200
1400
1600
1800
traffic:kb/s
time:hour
original value
Ant Double-BP
WNN
Figure 14: The proposed model compared with WNN.
in short term prediction. Although in Fig.13 24-hour
prediction is not good as Fig. 11-12, its error is so
small, and it does not influence the effective of
model. It shows its obvious advantage from
comparing with WNN in Fig.14.
In order to express the advantage of ACA
Double-BP model clearly, the performance
parameters compared with WNN and shows in table
II. Where SSE is square sum of error, MRE is mean
relative error, MAE is mean absolute error.
A NEW NETWORK TRAFFIC PREDICTION MODEL IN COGNITIVE NETWORKS
433

Table 2: Ant Double-B model performance parameter.
6 CONCLUSIONS
This paper is based on CN, through analyzing the
advantage and disadvantage of current network
traffic prediction models. And points out that they
are hard to be applied in CN directly. Then a new
model named ACA Double-BP model is proposed
which has great self-learning and self-adaptation
ability. Comparing with other models, ACA Double-
BP solves the problem of low speed convergence
and local optimum, improves the prevision by means
of rejecting abnormal data. BP does not depend on
training samples using ACA at all. Meanwhile, using
hybrid model obtains high fitting and prediction
prevision. It is applied in CN by using self-
organization and self-learning algorithm. The
Simulation in MATLAB and comparison with WNN
shows that performance of the novel model is better.
But ACA Double-BP is very complex, so how to
improve the efficiency with high-precision character
is the researching trend of this paper.
ACKNOWLEDGEMENTS
This work is partly supported by the Fundamental
Research Funds for the Central Universities of China
under Grant No.2009YJS034, and Beijing Nature
Science Foundation of China (No.4112044).
REFERENCES
Ryan W. Thomas, Luiz A. DaSilva, and Allen B.
Mackenzie, “Cognitive networks”, in Proc.IEEE
DySPAN 2005, Nov. 2005, pp. 352-360.
Zhaoxia Wang, Yugeng Sun, Zengqiang Chen, and Zhuzhi
Yuan, “Study of predicting network traffic using fuzzy
neural networks”, Journal on Communication, vol.26,
pp. 136-140, Mar. 2005.
Qi Jin, Changxing Pei, and Changhua Zhu, ”ARIMA
analysis method in network traffic”, Journal of Xidian
University ( Natural Science), vol.30, pp. 6–10, Feb.
2003.
Guoqiang Yu and Changshui Zhang, “Switching ARIMA
model based forecasting for traffic flow”, in
ICASSP'04. Canana, 2004, Vol.2, pp.429-432.
Aimin Sang and Sanqi Li, “A predictability analysis of
network traffic”, in INFOCOM 2000.Nineteenth
Annual Joint Conference of the IEEE Computer and
Communications Societies, Tel Aviv, Israel, 2000,
Vol.1, pp.342–351.
Chuanshan Gao, Liangxiu Han, Zhiwei Cen and Chunbo
Chu, “A new multi fractal traffic model based on the
wavelet transform”, in Proceedings of the ISCA 14th
International Conference: Parallel and Distributed
Computing Systems, Richardson, Texas USA, Aug.8–
10.2001, pp.157–162.
W. E. Leland, M. S. Taqqu, W. Willinger, and D. V.
Wilson, “On the self-similar nature of Ethernet traffic
(extended version)”, IEEE/ACM Transactions on
Networking, vol.2, pp. 1-15, Jan.1994.
V. Paxson and S. Floyd, “Wide-area traffic: The failure of
Poisson modeling”, IEEE/ACM Transactions on
Networking, vol.3, pp.226-244, Mar. 1995.
D. Husmeier and J. G. Taylor, “Neural networks for
predicting conditional probability densities: improved
training scheme combining EM and RVFL”, Neural
Networks, vol.11, pp. 89,116, Jan. 1998.
D. Hussein, “An object-oriented neural network approach
to short-term traffic forecasting”, European of
Operational Research, vol.131, pp.253-261, Feb.
2001.
Wakurah and J. M. Zurada, “Bi-directional computing
architecture for time series prediction”, Neural
Networks, vol.14, pp. l307-1321, Sep. 2001.
Jie Li, Xiuhong Hou, and Zhijie Han, ”Application of
kalman filter and wavelt in traffic prediction”, Journal
of Electronics & Information Technology, vol. 29, pp.
725-728, Mar. 2007.
Ting Lei and Zhenwei Yu, “A wavelet neural network
model of network traffic forecast”, Computer
Application, vol.26, pp.526-528, Mar. 2006.
Wang Peng and Liu Yuan, “Network traffic prediction
based on improved BP wavelet neural network”, in
Wireless Communications, Networking and Mobile
Computing 2008, Oct. 2008, pp.1-5.
Qigang Zhao, Xuming Fang, and Qunzhan Li, “WNN—
based NGN traffic prediction”, in Proc. ISADS 2005,
Chengdu, China, Apr. 2005, pp. 230-234.
Meng Yao, Yuan Liu, and Gang Zhou, ”Network traffic
prediction model of wavelet combined neural
network”, Computer Engineering and Design
, vlo.28,
pp. 5135-5136 and 5159, Nov. 2007.
Nili Tian and Li Yu, ”A WAN network traffic prediction
model based on wavelet transform and FIR neural
networks”, Journal of Electronics & Information
Technology, vol.30, pp. 2499-2502, Oct. 2008.
R. Schoonderwoerd, O. Holland and J. Bruten, “Ant-based
load balancing in tele-communications networks”,
Adaptive Behavior, vol. 5, pp. 169-207, Feb. 1996.
Bingrong Hong, Feihu Jin, and Qingji Gao, “Multi-layer
feedforward neural network based on ant colony
Name MSE/% SSE/% MRE/% MAE/%
WNN 1.74 10.57 21.14 7.57
ACA
Double-
BP
(time)
24h 1.90 8.26 22.79 7.97
1h 1.09 4.59 14.38 3.52
2h 1.25 6.21 17.56 16.74
ICEIS 2011 - 13th International Conference on Enterprise Information Systems
434

system”, Journal of Harbin Institute of Technology,
vol.35, pp. 823-825, Jul. 2003.
Na Yang, Qiang Fu, and Shuli Wang, “Improvement of
wavelet neural networks model and application”,
Systems Engineering-Theory & Practice, vol.29, pp.
168-173, Jan. 2009.
Wei Gao, “Evolutionary neural network based on new ant
colony algorithm”, in IEEE/2008 International
Symposium on Computational Intelligence and
Design1, 17-18 Oct. 2008, Vol. 1, pp. 318-32.
Nikorn Pokudom, “Determine of appropriate neural
networks structure using ant colony system”, in
ICROS-SICE International Joint Conference 2009,
Fukuoka International Congress Center, Japan, Aug.
2009, pp. 4522-4525.
Yi Wang, Liqin Fu, and Yan Han, ”Acoustic locating
based on double-BP neural network data fusion”,
Nuclear Electronics & Detection Technology, vol.29,
pp. 676-679, Mar. 2009.
Hailiang Feng, Di Chen, Qingjia Lin, and Chunxiao,
Chen, “Combined prediction model of internet traffic
on neural network”, Computer Applications, vol.26,
pp. 108-111, Sep. 2006.
Junsong Wang, Jiukun Wang, Maohua Zeng, and Junjie
Wang, “Prediction of Internet traffic based on Elman
neural network”, in CCDC’09, Chinese, pp.1246-
1252, Jun. 2009.
Defeng Zhang, MATLAB wavelet analysis, Beijing, China
machine press, 2008, pp. 50-51.
Linhui Liu, Jie Chen, and Lixin Xu. Realization and
application research of BP neural network based on
MATLAB, Future Bio-Medical Information
Engineering International Seminar, Dec. 2008, pp.
130-133.
A NEW NETWORK TRAFFIC PREDICTION MODEL IN COGNITIVE NETWORKS
435
