
STUDY ON THE KNOWLEDGE -SHARING NETWORK OF
INNOVATION TEAMS USING SOCIAL NETWORK ANALYSIS
Zhihong Tian, Zhenji Zhang
Beijing Jiaotong University, Beijing, China
Dongpo Xiao
China Agriculture Film and Television Center, Beijing, China
Keywords: Social network analysis, Knowledge network, Knowledge–sharing.
Abstract: Under the conceptual framework of social network theory, we study the knowledge-sharing network of
innovation teams by using the social network analysis methods. This paper puts particular emphasis on how
does the structure of knowledge-sharing network impact on the knowledge flows at the overall level. We
expect to find the key man and small groups in knowledge-sharing activities. Comparing with the actual
organizational structure, we could improve the efficiency of knowledge flows within the organization.
1 INTRODUCTION
Team is a formal group composed of individuals
who make great efforts and cooperate for common
goals. Members of team committee common goals,
and maintain the mutual responsible relationship.
The differences between innovation teams and
traditional teams are as follows: innovation team
members may be more loosely organized, but they
are brought together in a series of research and
development projects or tasks. The main work of
innovation teams is knowledge innovation.
Innovation teams can be defined as: they are
collaborative groups which are composed with
members who have complementary skills and
common mission objectives, and their main tasks are
science research and development projects.
From the definition of innovation teams we can
see that the efficient knowledge innovation is the
most important goal of such teams. Therefore, the
knowledge sharing within the team and
collaboration capabilities determine the
effectiveness of the task (Fu and Liu, 2008).
Knowledge flows within the team is a transfer and
diffusion process of knowledge. By the action of
technology networks and social networks,
knowledge flows within the organization exhibit
network-like structure which is called
knowledge-sharing network. From the perspective
of occurrence process, the flow of knowledge
exhibit the nature of the connection group, and that
is called the feature of "network ". From the
perspective of the essence, knowledge flows are
strongly influenced by the behaviors of the actors,
and that is called the feature of "social" (Chau and
Xu, 2007).
Social network theory provides a theoretical
basis which embed the actors of knowledge and
knowledge-sharing activities into social networks
(social structure). Social network theory was first
proposed by Simmel. In the sixties and seventies of
the 20th century, a series of mid-level theory
formed, and at the same time, social network
analysis (SNA) method was proposed to generate
testable model. Therefore, from the perspective of
social relations, under the conceptual framework of
social network theory, we research innovation
team's knowledge sharing network with the social
network analysis method.
2 SOCIAL NETWORK ANALYSIS
Social network analysis views social relationships in
terms of network theory consisting of nodes and ties
(also called edges, links, or connections). Nodes are
438
Tian Z., Zhang Z. and Xiao D..
STUDY ON THE KNOWLEDGE -SHARING NETWORK OF INNOVATION TEAMS USING SOCIAL NETWORK ANALYSIS.
DOI: 10.5220/0003590804380443
In Proceedings of the 13th International Conference on Enterprise Information Systems (KMKSSC-2011), pages 438-443
ISBN: 978-989-8425-54-6
Copyright
c
2011 SCITEPRESS (Science and Technology Publications, Lda.)

the individual actors within the networks, and ties
are the relationships between the actors. The
resulting graph-based structures are often very
complex. There can be many kinds of ties between
the nodes. Research in a number of academic fields
has shown that social networks operate on many
levels, from families up to the level of nations, and
play a critical role in determining the way problems
are solved, organizations are run, and the degree to
which individuals succeed in achieving their goals.
There are two types of social network which are
ego-centered network and whole network. Since we
expect to find the key man and small groups in
knowledge-sharing activities, we use the whole
network theory.
Metrics (measures) in social network analysis are
as follows.
2.1 Centrality
This measure gives a rough indication of the social
power of a node based on how well they "connect"
the network. "Betweenness", "Closeness", and
"Degree" are all measures of centrality.
1) Degree Centrality
The first, and simplest, is degree centrality. Degree
centrality is defined as the number of links incident
upon a node. Degree is often interpreted in terms of
the immediate risk of node for catching whatever is
flowing through the network. If the network is
directed (meaning that ties have direction), we
usually define two separate measures of degree
centrality, namely indegree and outdegree.
The absolute value of the degree centrality is
defined as follows:
∑∑
===
j
ji
j
ijiiD
xxndnC )()(
(1)
The value of
ij
x
is 0 or 1, which means whether
there is relationship between the actor j and i or not.
The standardized value is defined as follows:
)1/()()(
−
=
′
gndnC
iD
(2)
The definition of centrality can be extended to
graphs. The graph
G (group degree centrality) is
defined as follows:
[]
[]
∑
∑
=
=
=
−
−
g
i
iDD
g
i
iDD
nCnC
nCnC
D
C
1
*
1
*
))((max
)()(
(3)
This formula means a gap between the largest
degree centrality and the degree centrality of any
other actor in the network. The greater this
difference is, the higher the group degree centrality
of the entire network is. The extreme is the star
network.
The situation that the group degree centrality is
too high means that the allocation of relationships is
uneven in the group. Only several key men
participate in the interaction, and this action will
lead to the atrophy of knowledge sources and low
efficiency of knowledge sharing. However, too low
group degree centrality will affect the knowledge
sharing within the team.
2) Betweenness
Betweenness is a centrality measure of a vertex
within a graph. Vertices that occur on many shortest
paths between other vertices have higher
betweenness than those that do not.
The betweenness is defined as follows:
∑
<
=
kj
jkijkiB
gngnC /)()(
(4)
The group betweenness is defined as follows:
[]
[]
)2()1(
)()(2
2
g
1
*
−−
−
=
∑
=
gg
nCnC
C
i
iBB
B
(5)
This formula means a gap between the largest
betweenness and the betweenness of any other actor
in the network. The greater this difference is, the
higher the group betweenness of the entire network
is.
In 1992, Burt proposed the concept of structural
holes: in the network, if an actor links the other two
who have no direct connection between them, then
the actor’s location is called structural hole, and the
actor can control the flow of resources and thus
place a profit. Structural holes mark the interest of
the location in a network: when a member of an
innovation team is on the structural hole, he has
chances to access to two types of heterogeneous
information flow, and at that time, across the
structural holes, the redundancy of the information
obtained is very low (Gammelgard et al., 2004).
In topology, a cut-point is a point of a connected
space such that its removal causes the resulting
space to be disconnected. For example, every point
of a line is a cut-point, while no point of a circle is a
cut-point. Cut-points are useful in the
characterization of topological continua, a class of
spaces which combine the properties of compactness
and connectedness and include many familiar spaces
such as the unit interval, the circle, and the torus.
In accordance with the Burt 's view, there will be
STUDY ON THE KNOWLEDGE -SHARING NETWORK OF INNOVATION TEAMS USING SOCIAL NETWORK
ANALYSIS
439

small groups in the network which has excessive
structural holes. If the network which the actor
embeds is a reciprocal relationship network, he will
pass information between two small groups which
have no strong relationship, and the actor's role
become a "bridge "—a position that can stimulate
the circulation and sharing of knowledge. In a large
creative team, the bridges are essential. For example,
some key members of different groups play a bridge
role. Through the bridge, small groups can get some
overlapping research knowledge to promote
innovation activities.
2.2 Small Group
Small group (subgroup or cliques) is a sub-group in
which the relationships of the members are
particularly close. Small groups can match the
factions, which is the overall structure indicators of
network.
There are two kinds of methods for the
calculation of small groups. First, calculate the node
degree, and view a group of connected nodes as a
small group. Second, nodes that can be achieved in
the distance will be viewed as a small group. In this
paper, we select the most commonly used method—
K-plex.
K-plex is a Sub-graph that contains g
s
nodes. In
the graph, each node is connected with g
s
-k nodes in
the same sub-graph.
The presence of small groups of
knowledge-sharing activities has both positive and
negative effects. On the one hand, the small group
members can maintain a high level of strong ties, to
strengthen knowledge sharing effect, and to
stimulate knowledge innovation within small groups.
In a large innovation team, members of different
sub-groups easily form small groups, which is
conducive to concentrate their limited forces and
improve the stage activities. Another aspect is that if
a small group is too self-closing, the knowledge of
outside groups can not enter, and the knowledge
within the group can not be shared. Extreme cases
are: in a team that lacks of a common vision, each
member come together only for research or
development, and even the division of labor and
cooperation can not be fully realized. In such team,
knowledge sharing will not be able to achieve, and
accumulation of knowledge and innovation also can
not be achieved for the whole team.
3 BACKGROUND AND DATA
PROCESSING
In this paper, we select a university innovation
research team as a knowledge-sharing networks
quantitative study object. The purpose of the study is
to discover the team's knowledge sharing structure
and the status, to identify and solve problems in the
knowledge flow and to improve the flow efficiency
within the organization.
In the team, there are 14 members engaged in the
development of an information system project. We
use letters A ~ N to indicate the members. The
team's organizational structure is shown as figure 1.
A is the leader of the team, while leading a team
contained of B, K and H. C and D are assistants of A
and they both lead a research team. C’s group is the
largest, and responsible for the most expensive part
of the project. The organizational structure will be
compared to the knowledge-sharing network in
order to discover problems in the knowledge flow.
Figure 1: The team's organizational structure.
In accordance with the requirements of the
whole network analysis, we first determine the
analysis unit and social network boundary. This
network is a closed social network composed of 14
members. Then, we determine the important
relationship dimension to be analyzed. In this paper
we use the 1 - mode network, which only measure
the exchange of knowledge among the team
members. Then, we design the questionnaire. There
are 3 survey questions to answer, including "When
confronted with the knowledge and technology
difficulties, who would you ask for help?", “Who do
you often get the most substantive help from? " and
" who do you discuss the situation of the project
with?". Three questions are designed to get more
knowledge sharing status. Based on the analysis,
ultimately the relationship between members is a
C
D
A
I
M
L
G
N
F
E
J
B
K
H
ICEIS 2011 - 13th International Conference on Enterprise Information Systems
440

binary data case. There is a relationship of
knowledge sharing or not between any two
members.
After gathering up the questionnaire, we must
analyze the validity. First, check the questionnaire to
delete the failure respondents. In the whole social
network analysis, all names of the network will be
given to select by the respondents. The answers of
different members will be compared. For example, if
A selects B in the 3rd title, B does not choose A.
This means that the validity of the A’s answer is
doubt.
After confirming the validity of the questionnaire,
we input the data. We use network analysis software
UCINET. UCINET (University of California at
Irvine NETwork) is a powerful social network
analysis software, and originally developed by
Linton Freeman who is a scholar in University of
California in Irvine, and then maintained by Steve
Borgatti in Boston University and Martin Everett in
University of Westminster.
Enter the data into UCINET. The
knowledge-sharing relationship matrix is shown as
figure 2.
Figure 2: Knowledge-sharing relationship matrix.
4 SNA-BASED
KNOWLEDGE-SHARING
NETWORK ANALYSIS
4.1 Drawing of Network Diagrams
In UCINET, according to the relations matrix, the
software can draw a network diagram, which is
shown as Figure 3. As knowledge exchange and
sharing is a two-way relationship, the arrows in the
diagram are two-way. You can put the diagram as an
undirected graph. This diagram can clearly show the
knowledge flow within the team and propagation
condition. However, in order to descript the problem
more accurately, we must analyze the structural
parameters of the network specifically.
Figure 3: Network diagrams.
4.2 Analysis of Centrality
From the figure 3, we can see that A, C and D have
more ties, and they are at the center of the network.
Using UCINET, We calculate the degree centrality
and betweenness centrality of each member.
The data of degree centrality is shown as Table 1.
From the data we can see that, the degree centrality
of C is the highest. The absolute value is 5, while the
relative value is 38.462%. A and D follow C by the
absolute value 4 and the relative value 30.769%.
Table 2 shows the overall statistical parameters of
degree centrality of the network. The average degree
centrality of network nodes is 2.714, and overall
relative degree centrality of the network is 20.51%.
Table 1: Degree centrality.
Then, we calculate the value of betweenness.
The data of betweenness is shown as Table 3. From
the data we can see that, the betweenness of C is the
highest. D and A follow C. Table 4 shows the overall
statistical parameters of betweenness of the network.
The average betweenness of network nodes is
51.68%.
STUDY ON THE KNOWLEDGE -SHARING NETWORK OF INNOVATION TEAMS USING SOCIAL NETWORK
ANALYSIS
441
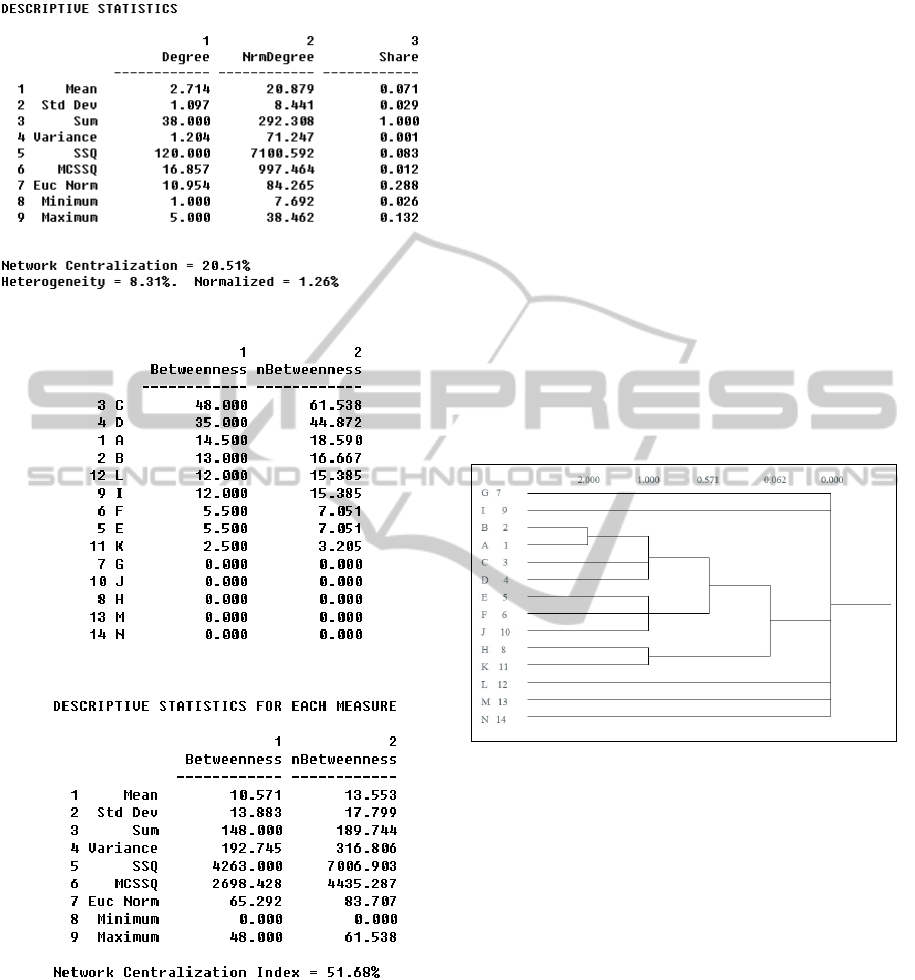
Table 2: Statistical parameters of degree centrality.
Table 3: Betweenness.
Table 4: Sstatistical parameters of betweenness.
Comparing with the actual organization chart,
we can see that A, C and D who have the highest
degree centrality are just the team leaders. They are
in the heart of knowledge-sharing network as the
central figures which are consistent with their roles
and responsibilities of work characteristics. They
occupy the knowledge of the team, while they
coordinate the members to start work and to
exchange of views.
The actual position of B is not a leader, but his
centrality is very high. He follows three leaders.
This shows that B is very active in activities of
knowledge sharing. The members N and M whose
centralities are at the last two should arouse our
attention. They belong to the group led by C, but the
ties with other members are very less. This situation
may due to the special nature of their tasks or to the
design of the organizational structure, the character
and ability of members. Thus, we need to analyze
the actual situation.
4.3 Analysis of Small Group
In the analysis of small group, the parameter k and
the Minimum Set Size require repeated attempts to
obtain a reasonable classification. After several
attempts, we choose k to 2, and specify the
Minimum Set Size to 4. After calculation, we find
that there are 3 knowledge sharing small groups:
ABCD, ABHK and DEFJ. Small-group relationship
matrix histogram is shown as Figure 4.
Figure 4: Small-group relationship matrix histogram.
The above words compare the centrality data
with the organizational structure, and we analyze the
status of knowledge sharing from the perspective of
the individual. Now, we compare the
knowledge-sharing small groups with the actual
organizational structure to analyze the problems in
the knowledge-sharing network.
First of all, A, B, C and D form a small group. A,
C and D are leaders of the team. B is a very active
member in knowledge sharing activities, who is
likely to be involved in leadership group as a
technical authority. A, B, H and K form a small
group. Comparing with the actual organizational
structure, we can see that the group is led by A. In
this group, only B contact with other members
outside the small group. D, E, F and J is just the
small group led by the D. Except the leader D, other
members have no contact with other small group
ICEIS 2011 - 13th International Conference on Enterprise Information Systems
442

members. D is the "bridge" of the team. Knowledge
sharing within the group is conducive to the
knowledge application, but desolation from the
whole team will be conducive to failure.
The team led by C has not yet formed small
groups, and members tend to conflicts. First,
because the members of the group are too many.
Second, partly because the work of members is low
similar. Both reasons are the organizational structure
design problems. As a leader, C should shoulder the
task to strengthen knowledge sharing within the
group. M and N are at the edges of the entire
organization, who must improve their knowledge
and communication skills.
5 CONCLUSIONS
Research on the knowledge-sharing networks in
innovative team has important significance for
improving the efficiency of the team. In this paper,
under the conceptual framework of social network
theory, using social network analysis methods, we
quantitatively analyze the network structure of
innovative team, identify the central figures and
small groups, and find the knowledge-sharing
network flows. Comparing with the actual
organizational structure, we discover the defects of
the organizational structure. These studies contribute
to optimize the knowledge flow within the team.
REFERENCES
Fu F, Liu L, W. I. Empirical analysis of online social
networks in the age of Web2.0[J]. Physica A:
Statistical Mechanics and its Applications, 2008(3):
675-684.
Chau M, Xu J. Mining communities and their
relationships in blogs: a study of online hate groups[J].
International Journal of Human-Computer Studies,
2007, 65(1): 57-70.
Jens Gammelgard, Kenneth Husted, Snejina Michailova.
Knowledge- Sharing Behavior and Post-Acquisition
Integration Failure[J]. CKGWP, 2004(6):24-41.
ROY L.Tacit knowledge and knowledge management: the
keys to sustainable competitive advantage
[J]. Organizational Dynamics.2001.29 (3): 164.
The Hybrid Vigor Institute.A multi-method analysis of
the social and technical conditions for
interdisciplinary collaboration (2003) [R/OL].
[2009-5-10]. http:// hybridvigor.org/
Kochikar V. P. Suresh. J. K. Towards a knowledge-sharing
organization: some challenges faced on the infosys
journey[R]. India: hfosys Technologies Limited, 2004.
Hansen M. T. The search-transfer problem: the role of
weak ties in sharing knowledge across organization
subunits[J]. Administrative Science Quarterly, l999,
44 (1): 82-111.
STUDY ON THE KNOWLEDGE -SHARING NETWORK OF INNOVATION TEAMS USING SOCIAL NETWORK
ANALYSIS
443
