
PASSENGER-ORIENTED ERGONOMIC DRAWING
OF DIAGRAM MAP FOR CHINESE RAILWAY
PASSENGERS’ LINES
Junmin Yi
Department of Management Sciences, Xiamen University of Technology, Xiamen 361024, China
Keywords: Diagram, Network, Ergonomics, Graph.
Abstract: The diagram maps for passengers’ lines of China Railways presents a basic reference for decades, however,
it can’t meet the demand of Chinese passengers today and it can’t catch the pace of the achievements and
expansion of China Railways. Based on a marketing perspective for caring passengers, brand new diagram
maps of Chinese Railway and its High-speed Railway (CRH) with a planning horizon up to the year of 2020
are designed and drawn by using the theories and methods from both the subjects of ergonomics, visual
communication design and graph theory. These graphs will convey a new image and modern information of
CRH to attract potential passengers, and help to improve the railway service quality.
1 INTRODUCTION
The diagram map for railway lines serves all walks
of passengers with different literacy and
background, and shows them the origin, destination
and transfer station quickly from China’s dense and
expanding railway networks. These maps convey the
connectivity and convenience of railway networks,
and served as part of the service image of
passengers’ transport. The maps are published on
booking offices, travel agencies, timetables, books,
newspapers and even Internet. However, the old
diagram map (MOR, 2009) for passengers’ lines had
decades of history. Owing to the rigidness of lines,
shortage of aesthetics, lack of the convenience, the
old diagram is hard to be recognized by normal
passengers, hence it can not be adapted to the
requirement of modern transportation and the
railway passengers. With the quick development of
Railway system, especially the emerging high-speed
railways network in China (Bai and Qian, 2010), the
diagram map needs to be considered from a system
perspective urgently to help the improvement of
railway service. Based on the service and
ergonomics, with integrating the theories and
methods of marketing, graph theory, human factors
and communications, the railway diagram map will
be redesigned comprehensively and systematically,
making it the “window” of China railway and an
important and integrated part of the Chinese Railway
- Corporate Identification System (CR-CIS). Thus, it
will convey a brand-new image of Chinese Railways
to all the tourists and passengers both from domestic
and abroad, in the modernization and advancing
drive of high-speed and service quality.
2 THE DRAWBACK OF PRESENT
MAP
The present diagram map of Chinese Railways is
multiple additions and revisions of traditional
railway network. It exhibits the connectivity of
railway network, but there isn’t a system planning
from the beginning, and it lies in the following
drawbacks.
Inconvenience to the Passengers. The old maps
were not drawn basing on the passengers’ view;
passengers with different vision and knowledge
levels can not find out their starting, ending and
transferring points and on-going lines quickly when
they look through the complex network map of
irregular lines and dots.
Non-straightened Backbone Lines. The high-
speed nonstop straight-forwardness and importance
of the main lines isn’t prominent in the old maps.
Such as the busiest and most important Beijing-
Shanghai railway line is zigzagged with seven to
389
Yi J..
PASSENGER-ORIENTED ERGONOMIC DRAWING OF DIAGRAM MAP FOR CHINESE RAILWAY PASSENGERS’ LINES.
DOI: 10.5220/0003590003890393
In Proceedings of the 13th International Conference on Enterprise Information Systems (SSSCM-2011), pages 389-393
ISBN: 978-989-8425-54-6
Copyright
c
2011 SCITEPRESS (Science and Technology Publications, Lda.)

thirteen segments in different editions of the
traditional railway diagram. Since the diagram maps
are not proportional diagrams, the backbone lines
should be straight lines to reflect the directed
relations of transportation.
Shortage of Aesthetics. The traditional diagram
with only rigid straight segment lines was drawn by
engineers, and usually done without a bit sense of
beauty. These segments and their arbitrary angle
between connected segments reveal the old
mechanical era image. The rigid segments network
without any curves inspires readers nothing of
aesthetics and modern service.
In all, the traditional diagram was focused on
engineering but hardly with the consideration of
passengers needs, it is not accordance with the basic
theory of human communications and factors, and it
is inconvenient for passengers to read the map,
hence it is not functioned the illustration of diagram
maps to passengers.
3 THE BASIS AND REFERENCE
FOR IMPROVEMENT
The railway diagram maps illustrate the connectivity
between stations; it would be drawn better on
network graph with nodes and arcs rather than the
proportional geometric map coordinated to the
geographic sites. By network graph, the railway
stations are nodes and the lines between stations are
arcs which can be straight lines or curves by the
graph layout. A good example is the metro diagram
maps of large cities, such as Paris and New York.
3.1 Metro Diagram Maps and
Ergonomics
For a metro diagram map, such as the Paris Metro
Map, it is a planar graph with different colours for
passengers’ convenience, and is designed based on
ergonomics and visual communication theories
(Sanders and McCormick, 2001). The main
characteristics of these diagrams are list as follow.
Colour Usage. Colours are used for a quick
finding of expected nodes and lines from the
network and colours enhance passenger’s cognition
and memory with each metro line a unique
identification colour. Nowadays the metro maps in
large Chinese cities are done in such style, but it is
hard to find such style in the Railway system.
More Vertical and Horizontal Lines. The vertical
and horizontal lines are used to illustrate the
connectivity, so it is easier to make and read the
graph and fits to human cognition intuition. The
slope lines will be used to the least; and a 45 degree
slope line is used in case of necessity. In such a
degree, there will be a good supporting and visual
effect for the graph. And if there is a turning corner
of two segments without a node, then the corner will
be rounded to smooth curve.
Nodes Representation. In the metro maps,
different nodes represent different types of stations
for a quick cognition by passengers. These
representations includes: emphasized circles for
origins and destinations of a line, solid dots for non-
transfer nodes and circles for transfer nodes. A small
transfer station is represented by a small circle, but
large and multiple transfer station is represented by a
rounded rectangle or a complex shape with rounded
rectangle and circles to show stations’ connectivity.
Text in the Map. Although different lines are
distinguished by identification colours, the text for
stations should be in single colour, namely black, for
consistence and striking in reading; while main
stations are emphasized by bold font style.
3.2 The Theory of Graph and Network
By the theory of graph and network (Hu, 2009), a
connected graph can represent the railway network
of a country or area while the station acted as node
and railway segment as the edge. Recent years with
the emerging study of complex networks, some
scholars begin the research of a scale-free railway
network in China. In the empirical analysis by Li
and Cai (Li and Cai, 2007), the statistical properties
of the China Railway Network consisting of 3915
nodes (train stations) and 22259 edges (railway
segments). The network displays the small-world
property, has the fingerprint of a small characteristic
shortest-path length, 3.5, accompanied by a high
degree of clustering, 0.835. That is after an average
of 3.5 times of transfer, any of two stations in the
Chinese Railways network can be reached. Here, our
main purpose is to study the connectivity of main
nodes with multiple edges, and this connectivity is
the basis for the scale-free graph. And the location
and distance of nodes are considered afterward.
4 DESIGN IDEAS
AND STRATEGIES
The design of the diagram map for passengers’ line
should be guided systematically by the theories of
ergonomics and visual communication (Sanders and
McCormick, 2001). A concise, elegant, striking
ICEIS 2011 - 13th International Conference on Enterprise Information Systems
390
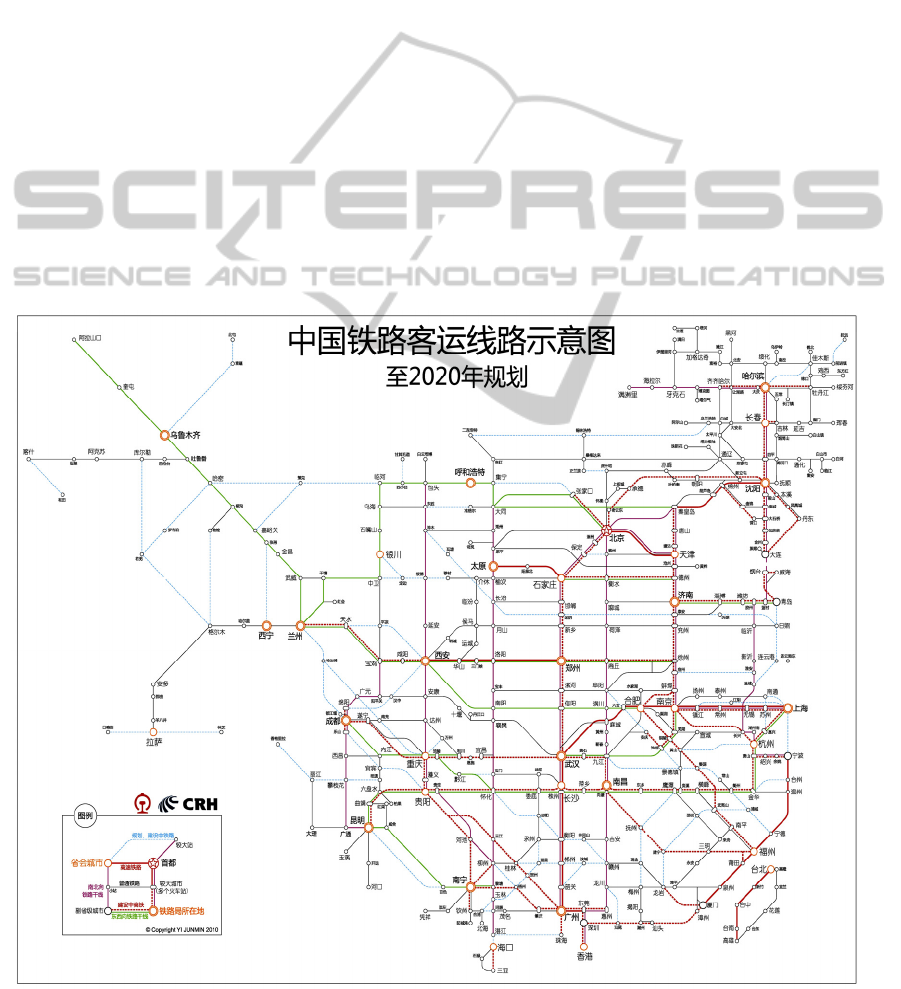
diagram map can be achieved with integration and
convenience for passengers, based on the status quo
and long-term planning of Chinese Railways
network. Our design is shown in Figure 1 (Yi, Yuan
and Zhang, 2010) with the following strategies.
4.1 Based on the Long Term Planning
The railway construction is booming in China these
years with leap in line length and network expansion,
an updated diagram map is needed to reflect the
planning and development. Our design is based on
the Revised Mid and Long term Railway Planning
with a horizon up to the year of 2020 (MOR, 2008)
and some Five-Year plans before. It focuses on the
network connection and grid space to meet the
requirement of present framework and future
development.
4.2 Straightening of Backbone Lines
Based on the planning of the dual four main Vertical
and Horizontal (4V4H) high-speed passenger lines, a
backbone network is formed with these straightened
segments, such as vertically Harbin-Dalian Line,
Tianjin-Nanjing section of Beijing-Shanghai Line,
Shijiazhuang-Guangzhou section of Beijing-
Guangzhou Line, and horizontally Xuzhou-Baoji
section of Gansu-Jiangsu Line, Jinghua-Changsha
section of Shanghai-Kunming Line, Shanghai-
Nanjing section of Beijing-Shanghai Line Jinan-
Qingdao and Shijiazhuang-Dezhou sections of
Qingdao-Taiyuan Line, Wuhan-Nejiang section of
Yangtze Line. Also, it straightens most of the dual
eight main Vertical and Horizontal railway lines
(8V8H) by the finished tenth Five-Year Plan such as
the Beijing-Kowloon, Lanzhou-Xinjiang, Datong-
Zhanjiang, Baotou-Liuzhou (Baotou-Guiyang
section), and Lanzhou-Kunming (Chengdu-
Guangtong section) Lines, and other existing
railways such as Linhe-Yangpingguang, Wuwei-
Dezhou, Jiding-Hami, Wuhai-Qinghuangdao,
Manzhouli-Suifenhe, Bihong-Baihe Line. Even the
Datong-Qinghuangdao Line mainly for cargo
transport is represented in straight line on our
Figure 1: Our design of the diagram map for Chinese Railways passengers’ lines.
PASSENGER-ORIENTED ERGONOMIC DRAWING OF DIAGRAM MAP FOR CHINESE RAILWAY PASSENGERS'
LINES
391

diagram map. Non vertical or horizontal lines are
laid in 45 degree orthogonal with curved corner for
streamline effect. In all, the diagram map conveys a
backbone straightforward high-speed concept, which
Chinese Railways is undergoing.
4.3 Line Types and Colouring
According to the principles of ergonomics and visual
communication, four types of line and colour are
used to classifying different types of railway. A red
line with line width of 1 is for the latest CRH High-
speed railway service, while a dashed one for such
railway under construction, an example is the new
Wuhan-Guangzhou CRH line paralleling to the old
ones (one of the 8V in pink with line width of 0.6,
while 8H in green). A watery blue line with line
width of 0.3 is for planned lines while black one for
existing line with rated speed less than 200 km/hour.
The colours are chosen by railway tradition and
general colour meanings. The ratio of line width is
1:0.6:0.3, which has a clear variation.
4.4 The Nodes
The nodes are on the top priority for passengers to
find the origin and destination from the map quickly.
By considering of the complexity, robustness and
dependence between stations in Chinese railway
network (Derrible and Kennedy, 2010, Wang, Y-L
et al, 2009), in our design, five categories of node
are classified based on the stations in old diagram
map and planned new stations.
Category 1. Beijing is represented by a five-
pointed star in a large circle for the normal
meaning of state capital and top railway hub.
Category 2. Cities where railway administrative
bureau seated are represented by a dual large
circle, these 17 cites are both provincial capital
now.
Category 3. Other provincial capital cities and
five large sub-provincial level cities are
represented by a large circle.
Category 4. Cities in the intersection of several
lines, especially with both normal line and
CRH line are represented by a long circle.
Category 5. Other stations are represented by a
small circle.
There are several hundred railway stations under
construction in China’s railway boom today, thus
there are large cities rather than stations to be shown
in the map for it is hard to show all the passenger
stations for a large city in the map. For example,
there are Beijing Station, Beijing West, South and
North stations in Beijing City only and Wuchang,
Hankou and Wuhan stations in Wuhan city now. The
structure of one-city-multiple-station can be
summarized by a table by the side of the map, as
shown in Figure 2.
4.5 Font for Nodes
The font of stations and cities are necessary and
meaningful to read the diagram. In our design, the
font is always in black san serif for clear reading,
and there are four types with two fonts. Type 1 is for
Category 1 and 2 cities aforementioned by Microsoft
Yahei font with font height of 5; Type 2 for
Category 3 cities by Youyuan font with font height
of 5; Type 3 for Category 4 by Youyuan font with
font height of 3.5; and Type 4 for Category 5
stations by Microsoft Yahei font with font height of
2.5. The ratio of font height is 1:0.7:0.5 close to the
golden section, which has a clear differentiation.
These arrangements with broad and fine line,
single and double circle and large and small size
confirm to ergonomic principles, and the total layout
is striking for passengers’ quick and meaningful
reference.
5 DESIGN RESULTS
The finished diagram map includes 370 cities /
stations in a 166
・
112 lattice, with space for more
stations in the future. The map reveals several
interesting findings.
In general, there are more horizontal lines than
vertical ones, but the North to South vertical
backbone lines are more strong and in evidence.
Slope lines lie more in the West and the South,
with a reflection of less orthogonal and straight
lines in these mountainous regions.
There is a distinct difference between the South
and the North by the Gansu-Jiangsu Line. There
are more straight lines in the North, while more
curves in the South, and especially in the vast
Northwest China, the sparse railway lines can
be drawn just straightforward. This is consistent
with the analysis of Wang’s Geographic coarse
graining analysis of the railway network of
China (Wang et al., 2008).
By density, the highest lies in Northeast China
and The Yangtze River delta. While there are
more lines by planning and under construction
in the regions of East China (South) and
Southwest China, which reflects the potential
demand of railway service.
ICEIS 2011 - 13th International Conference on Enterprise Information Systems
392
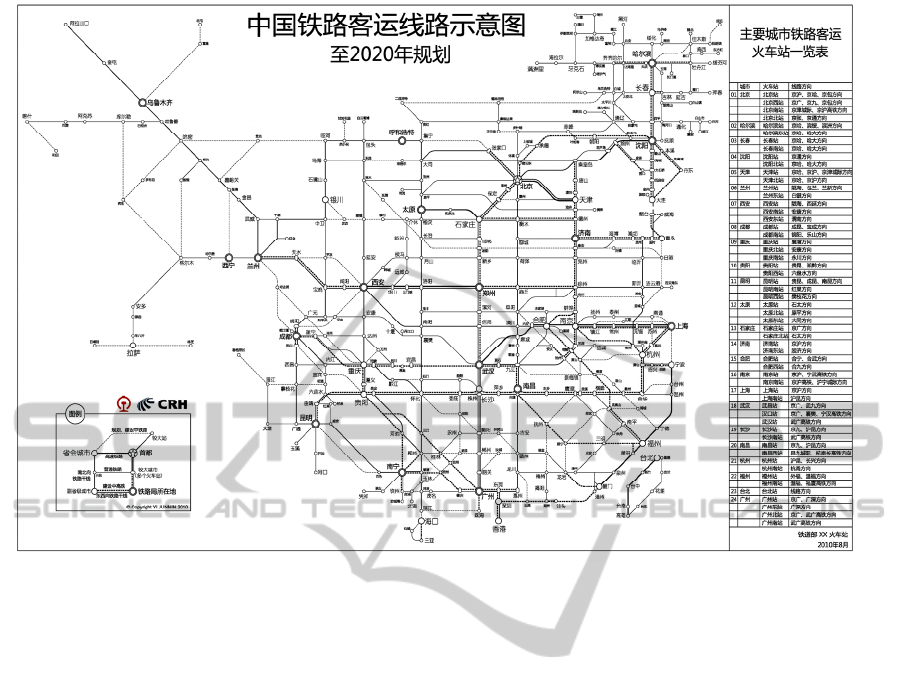
Figure 2: The diagram map of CR with one-city-multiple-station table (in black and white).
For the nodes in the diagram map, it can be treated
as vertices in graph theory and their degree can be
applied to explain the connecting relationship
Beijing as the top railway hub has a vertex degree of
11, which means there are eleven railway lines
started from Beijing.
Next, Nanjing and Xi’an both have a degree of
10, and other hubs, Shanghai, Guangzhou,
Zhengzhou, Wuhan, Chongqing and Chengdu have a
degree of 8 or 9. These hubs are also large cities in
China with great population and passengers.
The drawing is made with AutoCAD, it can be
further beautified with art perspective for better
image of Chinese Railways, and a series of map can
be created for the demand of all walks of passengers
and of railway system.
In conclusion, the new design is customer-
oriented and focused on service and ergonomics, it
will convey a new image and modern information of
CRH to attract present and potential passengers, and
in some way help to improve the railway service
quality.
REFERENCES
Bai, C-E, Qian, Y. Infrastructure development in China:
The cases of electricity, highways, and railways,
Journal of Comparative Economics, 38(1): 34-51,
2010.
Derrible, S., Kennedy, C. The complexity and robustness
of metro networks, Physica A: Statistical Mechanics
and its Applications, 389(17): 3678-3691, 2010.
Hu, Y.C. Operations Research and its Application, fifth
Edition. Beijing: Higher Education Press, 2009.
Li, W., Cai, X. Empirical analysis of a scale-free railway
network in China, Physica A: Statistical Mechanics
and its Applications, 382(2): 693–703, 2007.
MOR (Transportation Bureau, Ministry of Railway). The
diagram map for passengers’ line in Chinese
Railways. Beijing: Chinese Railway Press, 2009.
MOR (The Ministry of Railway, PRC). Mid and long term
planning of railway network, a revision in 2008.
Beijing, 2008.
Wang, Y-L et al. Empirical analysis of dependence
between stations in Chinese railway network, Physica
A: Statistical Mechanics and its Applications, 388(14):
2949-2955, 2009.
Sanders, M. S., McCormick, E. J. Human Factors in
Engineering and Design, 7
th
edition. McGraw-Hill,
2002.
Wang, R. et al. Geographic coarse graining analysis of the
railway network of China, Physica A: Statistical
Mechanics and its Applications, 387(22), 5639-5646,
2008.
Yi, J., Yuan, H. and Zhang, Q. Drawing of China Railway
Passengers’ Line Diagram Map Based on Passengers’
Convenience and Ergonomics. Chinese Railways 9: 4-
7, 2010.
PASSENGER-ORIENTED ERGONOMIC DRAWING OF DIAGRAM MAP FOR CHINESE RAILWAY PASSENGERS'
LINES
393
