
RESEARCH AND IMPLEMENTATION OF CAMPUS CARD
DATA ANALYSIS SYSTEM
Feng Wang, Fang Wang
Information Center, Beijing Jiaotong University, No.3 Shang Yuan Cun, Hai Dian District, Beijing, China
Lei Hang
School of Economics and Management, Beijing Jiaotong University
No.3 Shang Yuan Cun, Hai Dian District, Beijing, China
Keywords: Campus card system, Data mining, Student behavior analysis system, Decision support system.
Abstract: The campus smart card system is one important basic part of campus information constructions. It is one of
projects which most represent campus information construction effects and can promote school’s
management and service level. The campus smart card system is integrated by two major categories of
subsystems, they are consumption and authentication. These systems accumulated a flood of card records
during the past years. This article describes the research work about campus card system data mining carried
by Beijing Jiaotong University. The researchers developed a data analysis system, which they called student
behavior analysis system. The article lay emphasis on the design of the System framework,and technical
methods of implementation. At last, application cases are given.
1 PREFACE
The campus smart card system is one important
basic part of campus information constructions. It is
one of projects which most represent campus
information construction effects and can promote
school’s management and service level. Campus
smart card system is an integrated information
system, use smart cards as a carrier, set two major
categories of consumption and identification
functions in it.
At present, many colleges and universities have
campus card system construction or in progress, the
main business subsystem, including food
consumption, library, medical treatment, computer
room management, meeting attendance, electronic
package of counter, building access control, vehicle
management, etc.
So many applications accumulated a flood of
data. Case Study of Beijing Jiaotong University,
campus card system put into use for six years, credit
card records of the system are up to 500 million. If
we can convert data into information for school
leadership and administrative departments to support
decision-making, we will greatly promote the level
of school’s information management. Depend upon
the former study on data mining, the project team
has developed a campus card data analysis system,
and achieved a very good practical effects.
2 ARCHITECTURE OF THE
DATA ANALYSIS SYSTEM
The architecture of data analysis system is divided
into data analysis & processing module and data
statistics & querying module.
2.1 Network Structure
Our campus smart card system uses a private
dedicated network, which is isolated to campus
public network by a physical firewall. As shown in
Figure 1, data analysis and processing module work
on a server located in smart card private network.
Data statistics and querying module work on another
server located in campus public network. After data
processing, data will be transferred from the backup
515
Wang F., Wang F. and Hang L..
RESEARCH AND IMPLEMENTATION OF CAMPUS CARD DATA ANALYSIS SYSTEM.
DOI: 10.5220/0003586505150518
In Proceedings of the 13th International Conference on Enterprise Information Systems (SSE-2011), pages 515-518
ISBN: 978-989-8425-53-9
Copyright
c
2011 SCITEPRESS (Science and Technology Publications, Lda.)
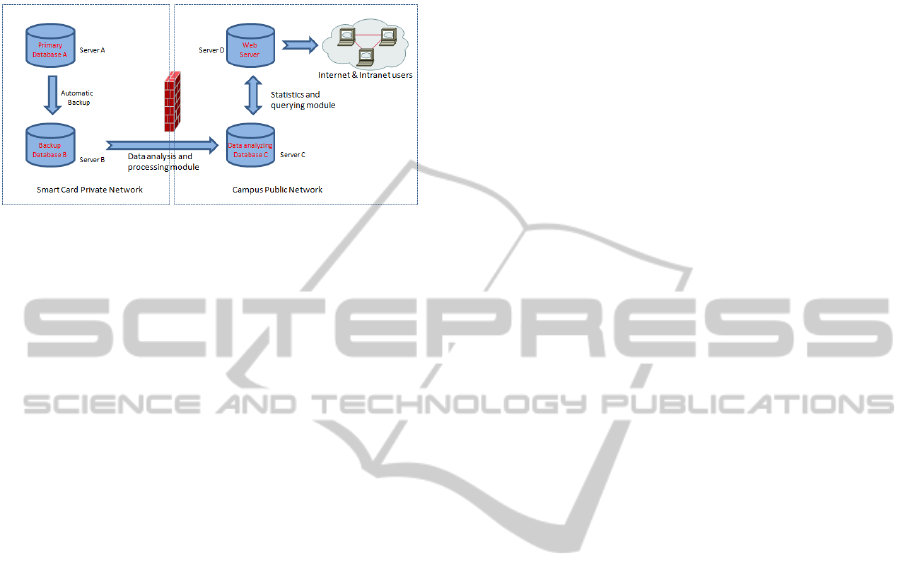
database B to the database C, which is running on
server C located in the campus public network. At
last, completion of data published online in the
campus network.
Figure 1: Architecture of the data analysis system.
2.2 Data Analysis & Processing Module
Our campus card system have two database, primary
database A and backup database B, they are both
Oracle9i database running on two SUN V880
Server. At 4 o’clock every morning, data file will be
thoroughly copied from primary database A to the
backup server B. Data analysis database C is also an
Oracle9i database, but it is running on Linux
platform. Data analysis and processing module runs
regularly every day on the server C as a service to
capture data from backup server B to database C.
But the capture from B to C is different from the
simple copy from A to B, because the process of
data analysis needs induction, split and merge.
2.3 Data Statistics & Querying Module
Statistics and querying module uses B/S three-tier
architecture. The bottom layer is an Oracle9i
database, where processed campus card data is
stored in it. The middle layer is a web server,
running IIS and .Net framework 2.0. The top layer is
the user's browser come from the clients located in
the campus public network. Our system does not
design user management, but use of the school
uniform integrated management information system
to complete the portal and access control.
3 IMPLEMENTATION OF DATA
ANALYSIS SYSTEM
3.1 Difficulties in Implementation the
System
The campus card system has up to 500 million data
records. In such a large database, in order to
analyzing, querying, statistics and calculating,
efficiency is the primary consideration, and is very
difficult to achieve. So we use a variety of measures
to optimize the execute speed.
3.1.1 Optimizing Data Sources
In order not to affect the normal operation of the
campus card system, we do not run data collecting,
analyzing and processing program on the primary
server A, but from the campus card backup server B,
instead. Card runtime data will be backed up to the
backup server on every morning at 4 am. Then data
processing system begin to run at 8 am to capture
data from the backup database, data are also
analyzed and summarized at the same time. The
average collected records daily are 130,000, spend
about 2 hours. Therefore, the data analysis system
own all data created before 4 am this morning,
though it is not real time system, yet for the statistics
and query purpose, the lag day is perfectly
acceptable.
3.1.2 Optimizing the Database
In order to improve access efficiency, we created the
index on the database, and appropriate citations to
some of the redundant data and reduce the
associated table to optimize access efficiency. At the
same time, we created a number of tables, in which
results are saved while statistic procedures execute
in the background periodically. The user programs
access statistics results directly, so as to achieve
optimization.
3.1.3 Optimizing Algorithm
We optimize the raw data for three times.
Firstly, we removed credit card records belonging to
the temporary staff outside, because the original
campus card database records include all user
records, not only students and teachers. Leaving
only the card records of formal teachers and students
is necessary.
Secondly, we classified food and beverage
consumption data, building access data, shower data,
medical data and other types of data when they are
extracted from the database B. Here is an
explanation of how we optimize food and beverage
consumption data.
Step 1, we summarize the meals. In each meal
period, if one student credit card more than
ICEIS 2011 - 13th International Conference on Enterprise Information Systems
516
once on different POS machines, we treat
multiple records as one meal, add the several
costs, and merged into one meal.
Step 2, we add up each student’s cost and
times monthly with breakfast, lunch and
dinner, so that a statistical chart will come into
being faster.
Step 3,we insert warning data into the table
monthly, rather than calculate each time, thus
improve access efficiency.
4 CASE PRESENTATION
4.1 Student Behavior Analysis System
We developed this system is to enable those teachers
who is responsible for student management can keep
track of dynamic information. For example, students
who have meal more than 70 times per month, but
monthly cost less than 150 Yuan RMB, etc.
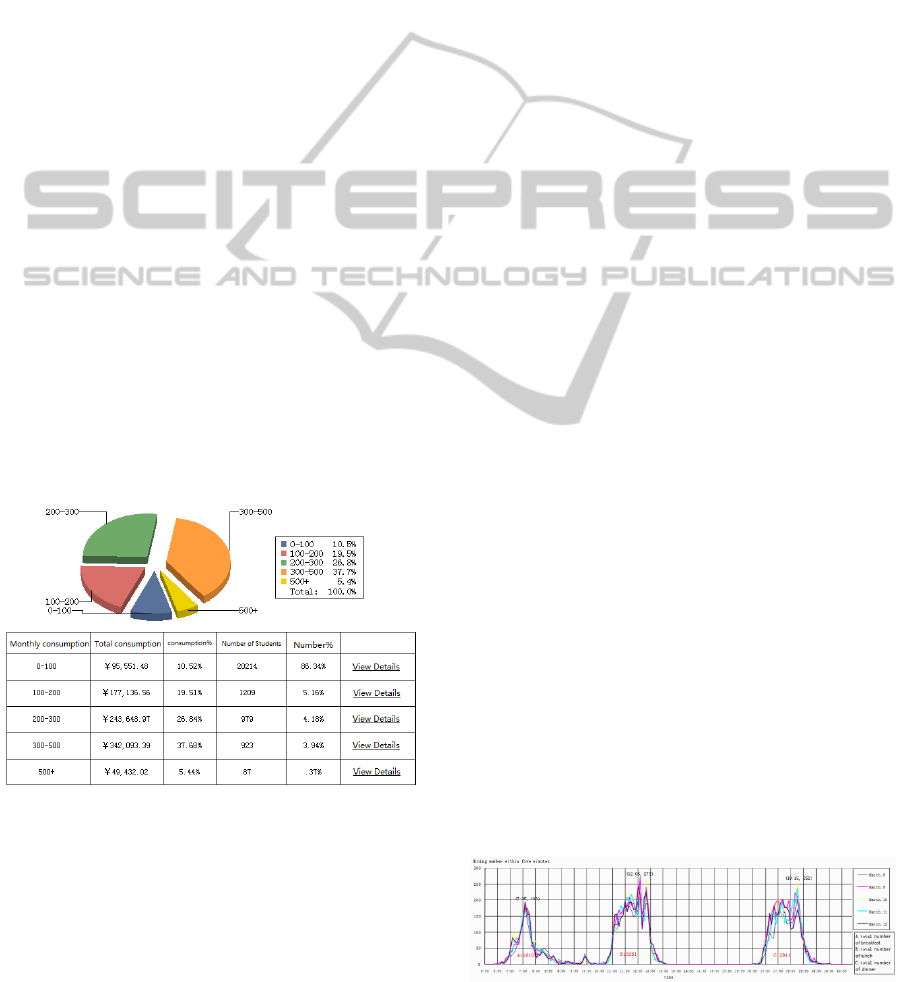
4.1.1 Statistics and Query Function
One can select specific groups, such as a particular
college, a grade or a period number of students,
query and statistics the recharge records, consumer
records, eating records, computer room records,
medical records, access records, and draw the
appropriate cake Chart, histogram. As shown in
Figure 2.
Figure 2: Interface of statistical and query function.
4.1.2 Alert Function
Analyze each type of behavior, based on statistical
theory, set alerts threshold and save the results of
data analysis into the table. Such as, students who
come back dormitory too late more than 7 times a
month; students who eat more than 60 times a month
but the total cost is less than 100 Yuan RMB;
students who spend more than 300 hours a month on
internet, etc. These information need to be saved
into the question table, and take the initiative to push
a window to student management workers when
they log on, or the messages are sent to the
manager’s mobile phone.
4.2 Decision Support System
Beijing Jiaotong University have five student
canteens, a foreign student canteen and a staff
canteen. Last year, in order to build a new student
activity center, university had to place a student
canteen for demolition and reconstruction. However,
removal of the old dining hall, and rebuild a new
canteen will spend about 2 years. During the 2 years,
students will have a significant impact on crowded
dining, especially in the peak dinner time. How to
open the canteen windows scientifically, adjust the
service time of the canteens is the urgent task which
placed in front of school leaders. To this end, the
project team submitted canteen statistics data weekly
to the school leadership and logistics management.
Here are a few sample charts.
4.2.1 Comparison Charts of Each Canteen
According to the Chinese students’ consumption
data, we conducted a statistical analysis separately,
according to No.1 canteen, No.2 canteen and No.4
canteen. Our statistics date is from March 6 to 12
(except Saturday and Sunday), every five minutes as
a number of sampling points. According to statistics,
the time period as the abscissa, number of meals
eaten within five minutes as the vertical axis, make
the daily meals curve. We draw the dinner curve five
days on a chart, respectively, in different colours for
different date. As shown in Figure 3 to Figure 5.
Through analysis, We can see, from March 6 to
12, the maximum number of breakfast appears in
No.2 canteen, the peak number is 225 times every
five minutes and the peak time is 7:40. The
maximum number of lunch appears in No.1 canteen,
the peak number is 229 every five minutes and the
peak time is 12:20. The maximum number of dinner
appears in canteen No.1, the peak number is 214
every five minutes and the peak times is 18:15.
Figure 3: Analysis of dining number of canteen No.1 in
March 6 to 12.
RESEARCH AND IMPLEMENTATION OF CAMPUS CARD DATA ANALYSIS SYSTEM
517
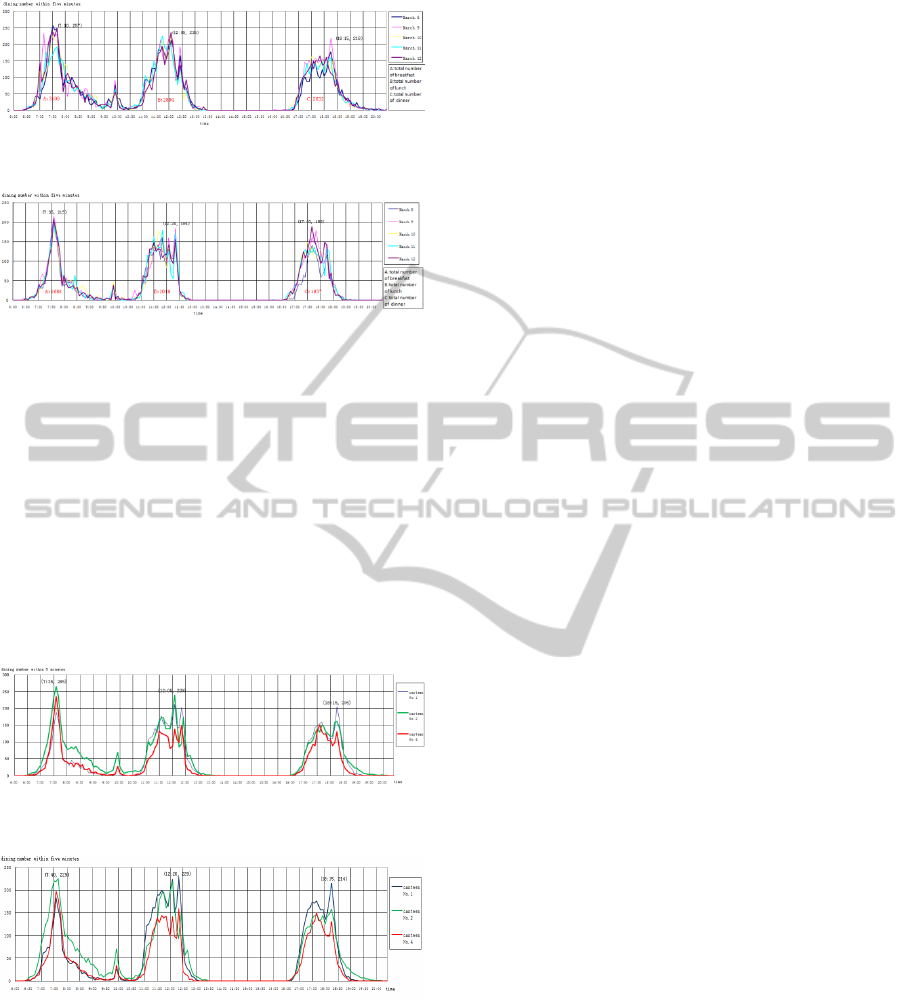
Figure 4: Analysis of dining number of canteen No.2 in
March 6 to 12.
Figure 5: Analysis of dining number of canteen No.4 in
March 6 to 12.
4.2.2 Comparing the Number of Meals
of Each Canteen
Project team choose two periods of time, February
23 to 27 and March 6 to 12, calculate the average
number of diner, draw a curve about the three
canteens on a chart. As shown in Figure 6 to Figure
7. It can be seen that, in March No.2 canteen
decrease in the number of diners, while No.1
canteen increase the number of diners. We can draw
a conclusion: some students diverted to No.1
canteen.
Figure 6: Analysis of dining number of three canteens in
Feb 23-27.
Figure 7: Analysis of dining number of three canteens in
Mar 6-12.
5 CONCLUSIONS
In the past two years, through the application of card
system data mining, all departments enjoy the
benefits more efficient and more scientific when
they make management and service-related
decisions involved in teachers and students. In
addition to campus card system, there are many
other management information systems.
Development and utilization of the information
should be the focus of information technology
research in future. Managements will also benefit
from the use of information.
REFERENCES
Decai Wang, Yongli Zhang. 2008. Campus card system
construction need to look at the overall situation,
China Education Network.
Linfeng Jiang. 2006. Construction of Science and
Technology for the digital card, China Education
Network.
ICEIS 2011 - 13th International Conference on Enterprise Information Systems
518
