
ANALYSIS ON THE SPATIAL VARIATION OF THE CENTER
OF GRAVITY OF INBOUND TOURISM IN CHINA
Yining Chen and Hui Zhang
School of Economics and Management, Beijing Jiaotong University, Beijing, P.R. China
Keywords: Inbound tourism, Center of gravity (CoG), Spatial distribution, China.
Abstract: This paper examines CoG movement of the chief indicators of inbound tourism in China from 2000-2010.
Three themes guide the analysis. First, the changing CoG of China inbound tourism is calculated and
mapped. Second, the changing inbound tourism size distribution of the 31 provinces is examined. Third, the
provinces are ranked according to their growth rate, and analyse the changing spatial concentration of
inbound tourism. Some generalizations regarding spatial variation are given and future trends for the
balanced development of inbound tourism are briefly discussed.
1 INTRODUCTION
Since the reform and opening up, inbound tourism in
China has been experiencing a rapid development,
and foreign exchange reserve due to international
tourism has been growing at a high speed. The
number of inbound tourists to China of 2010
exceeds 264 millions, and the industry income
brought by inbound tourism reached 51.96 billions
for the same year, being 144 and 224 times
respectively the numbers of 1978, 7.62 and 21.4
times those of 1990, 1.17 and 1.1 times those of
2000. From the beginning of the 21st century,
impacted by SARS, international financial crisis,
China’s exchange reform and various natural
disasters, the growth rate of inbound tourism in
China shrunk, and a negative growth even appeared.
Under the accumulated influences of policies like
File 41 and its implementations, assignment
instructions released by the State Council in 2009,
inbound tourism gained a strengthened position in
the regional economy development. Witnessing the
building of high-speed mass transit system, the
establishment of International travelling island of
Hainan and Touristic reform experiment area of
Guilin, the constructing of local style tourist
destination by the autonomous region of Ningxia,
international interests sites by the region of Xizang
and the like by the region of Xinjiang, inevitable
questions arise: What is the current situation of the
spatial distribution of inbound tourism in China?
How to enhance development the regional tourism
for a more balanced spatial distribution of the
inbound tourism in China? It is based on these
questions that this paper attempts to illustrate the
spatial diversity and diachronic dynamic variation of
the inbound tourism in China.
The center of gravity (CoG) is a concept
developed by Carl Von Clausewitz, a Prussian
military theorist, in his work On War (Carl Von
Clausewitz, 2009). In its military sense, the CoG is
usually seen as the "source of strength"; in its
geometric sense, it is the point in or near a body
upon which gravity can be thought of as acting.
Recently, the CoG was applied to social and
economic research, it was seen as the point of
greatest importance, interest, or activity. Scholars
employ the CoG model to do analysis on metropolis
demographic gravity center movement and
demographic spatial convergence (L. N. Tellier,
1995; G. F. Mulligan, 2005). Lucia Falzon (2006)
brought Bayesian Network algorithm into the
research of military planning gravity center (Y. H.
Bao, 1998). Research involving CoG in China came
about comparatively late, with the subjects varying
from demography gravity center at the primary stage
to spatial gravity center concerning society,
economy and natural resources. Some researchers
analysed the arable land gravity center coal resource
(Y. H. Bao, 1998; J. H. Wang, 2006). Some
441
Chen Y. and Zhang H..
ANALYSIS ON THE SPATIAL VARIATION OF THE CENTER OF GRAVITY OF INBOUND TOURISM IN CHINA.
DOI: 10.5220/0003580604410447
In Proceedings of the 13th International Conference on Enterprise Information Systems (SSTS-2011), pages 441-447
ISBN: 978-989-8425-53-9
Copyright
c
2011 SCITEPRESS (Science and Technology Publications, Lda.)

researchers focused on the analysis of the
demographic and economic gravity center
and did
some comparative study on the results (Fan C, 2003;
Y. J. Yu, 2005; Z.X.Feng, 2005; Z.X.Feng, 2006). In
recent years, there has been a shift of attention to
industrial gravity center among domestic scholars
(G. Z. Cao, 2007; J. J. Zhang, 2009; S. M. Wu, 2010;
Wen M, 2004).
The subjects of the current research concentrate
at the macro-economic level, and are limited to the
primary and secondary sector of economy. The
researches revolving economic development and
industry spatial distribution is not seen with obvious
progress, and those on tourism economic gravity
center are very rare. This paper sees each province
(autonomous area, municipality) as the basic
physical unit, calculate and work out CoG
movement of the chief indicators of inbound tourism
in China, in the aim to look inside the spatial
variation and characteristics of the inbound tourism
from an overall perspective, with the help of which
the geographical developing planning and related
policies formulation of the industry of tourism can
be better done.
2 METHODOLODGY
2.1 Data
In the measurement of the gravity centers for
inbound tourism, the coordinates of the capital city
in each province are taken as the economic gravity
center (the capital cities remain geographically static
during the time of research). The fact is more than a
few provinces govern at least two chief touristic
cities, such as Guilin and Nanning in Guangxin
Province, Qingdao and Jinan in Shandong Provice,
Suzhou and Nanjing in Jiangsu Provice, etc., but it’s
quite difficult to acquire data of sub-provincial
areas, and the inbound touristic gravity center tend
to be physically close to the capital city in most
cases. Therefore, it’s feasible and necessary to set
the coordinates of the capital city as the economic
CoG and to do explorative research on the topic. As
to the indicator selecting, consulting the statistics
from 2000 to 2009 from “China Tourism Statistics
Yearbook”, this paper chooses inbound tourism
foreign exchange income as the total amount
indicator. Based on the indicator chosen, inbound
tourism economic center is worked out. Please note
that the calculation is within the Chinese mainland,
Hong Kong, Chinese Taipei and Macaw are not
included.
2.2 Method
The gravity center model being the basis, this paper
analyses the regular patterns of the spatial variation
of the inbound tourism and industrial distribution in
China over the past decade. More specific
description would be: establish a resource data base,
the inbound tourism economic indicators of each
province for the years from 2000 to 2010 included,
then the gravity center model is used to calculate the
gravity center coordinates of inbound tourism for
each year; draw out a scatter diagram and a gravity
center moving line; conclude the reasons for the
inbound tourism gravity centers referring to their
longitudes and latitudes.
2.2.1 CoG Model
Assume that a region consists of n sub-regions
(particle), the longitude and latitude of central city in
the number i sub-region are set as X
,Y
, and T
represents the quantity of certain feature of the
number i sub-region. Certain feature and coordinates
of provinces (autonomous regions, municipalities)
are used to help calculate the CoG of certain feature.
Formula for calculating the CoG coordinates is
X=
∑
X
∗T
∑
T
⁄
(1)
Y=
∑
Y
i
∗T
i
∑
T
⁄
(2)
From the algorithm point of view, there are two
determinants of CoG: geographical location and
feature variation in each area. Now that the
geographical location of each area is assumed to be
same, the CoG variation can reflect the change of
corresponding feature. Due to an uneven developing
level and speed of inbound tourism and related
touristic industries throughout different regions in
China and a huge annual gap, the inbound tourism
economic and industrial gravity centers stay in a
continuously changing state.
2.2.2 Moving Direction of CoG
The CoG moving direction points out the physical
structure variation direction. The CoG of the years i
and i+1 are represented as
A ( X
,Y
) , B (
X
,
Y
). The year i is the starting year, and θ
stands for the shifting angle away from the starting
year when it comes to year i+1. The east is
ICEIS 2011 - 13th International Conference on Enterprise Information Systems
442

considered
0
°
in this paper. The following formula is
used to calculate the angle between two sequential
years:
θ
=arctg
–
(3)
θ stands for the shifting angel of the gravity
center (0
°
< θ < 180
°
), with the east being 0
°
,
counter-clockwise movement means a positive
variation, and clockwise negative. When
θ = 0
°
or θ = ±180
°
, the gravity center moves
horizontally, to the east or the west; when θ=±90
°
,
it moves vertically, to the north or the south; when
0
°
<θ<90
°
, the gravity center moves to the north-
east direction; when 90
°
<θ < 180
°
, it moves to the
north-west; when −90
°
<θ<0
°
, the gravity center
moves to the south-east direction; and to the south-
west when 0
°
<θ<90
°
.
2.2.3 Geographical Shifting Distance of CoG
Formula (4) is used to calculate the gravity center
geographical shifting distance of two sequential
years:
D=C∗
(X
−X
)
+(
Y
−
Y
)
(4)
C=111.111, the ratio between the physical
coordinates (degree) and the graphic distance
(kilometer), X
−X
, Y
−Y
represent the
variation of the gravity center coordinates from the
year i to the year i+1, C*
(X
−X
), C∗(Y
−Y
)
respectively stand for the actual shifting distances
along the longitude and the latitude, thus
∗(
)
∗(
)
stands for the ratio between the variation speed
along the two directions.
When
|
| <1, the gravity center shifting
angel is within the range of (-45º, 45º ), (135 º,
180º), (-135º,-180º), indicating that the variation
speed along the longitude is faster than along the
latitude;
When
|
| >1, the gravity center shifting
angel is within the range of (45 º, 135º), (-45º,
-135º), indicating that the variation speed along the
latitude is faster than along the longitude;
When
|
| =1, the gravity center shifting
angel straddles the diagonal of 45 º and 135 º ,
indicating that the variation speeds at both directions
are the same;
If the shifting direction coincides with the axis,
the gravity center moves along the longitude or the
latitude.
3 GEOGRAPHICAL DISPARITY
AND VARIATION ROUTE OF
THE INBOUND TOURISM IN
CHINA
3.1 Characteristics of Variation of the
In-bound Tourism Spatial
Distribution
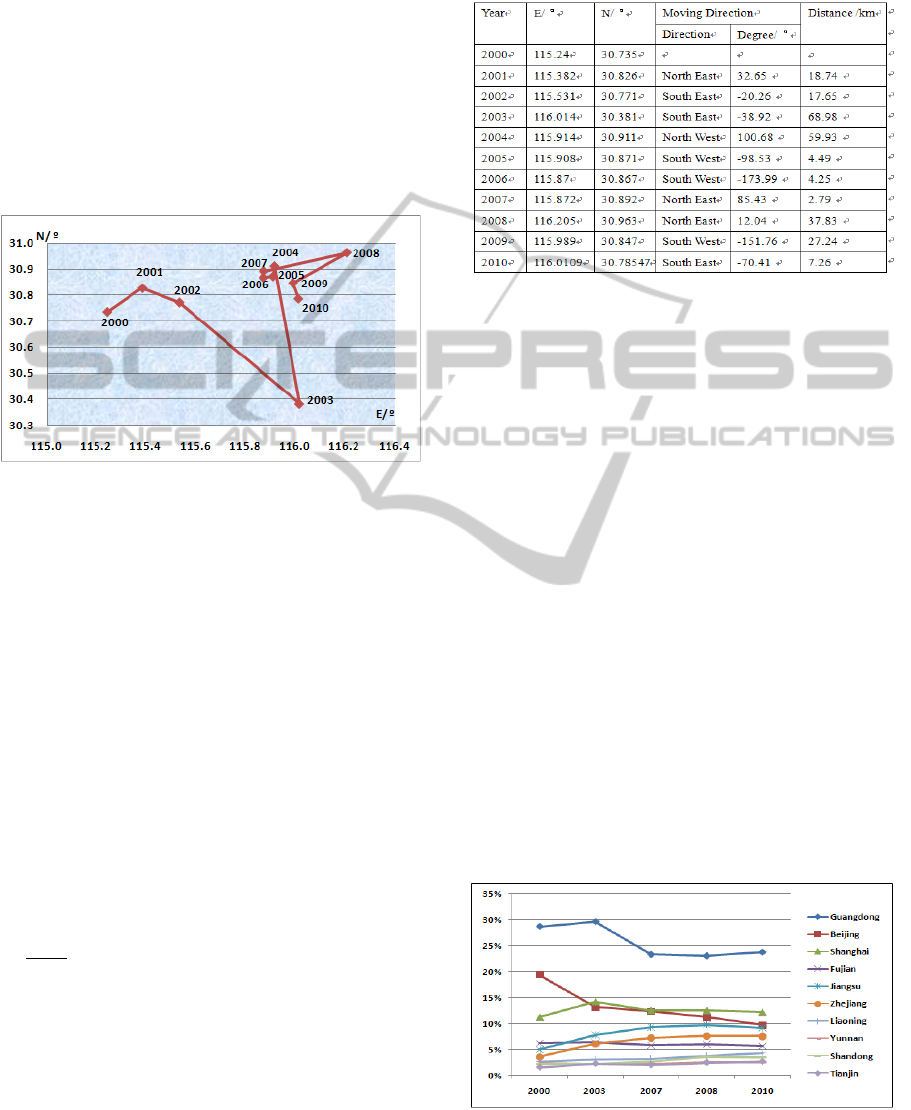
3.1.1 Moving Direction
From the perspective of the moving direction,
starting from 2000, 60% of the movements of the
inbound tourism economic gravity center are
clockwise (negative, as assumed above), the other
40% being counter-clockwise, and no apparent
regular pattern can be found. There is an obvious
eastward tendency in the shifting of inbound tourism
economic gravity center (fig.1, tab.1), as is shown in
Fig1 and Tab1 that the gravity center moves within
the north latitudes of 30.7ºand 30.9º, with the years
of 2003 and 2008 being exceptions. The distinct
situation of these two years might reflect the fact
that inbound tourism is substantially influenced by
the exterior environment.
To look at the issue in details, during the period
between 2000 and 2003, the inbound tourism gravity
center shifts clockwise, revealing a tendency of
moving toward the southeast. The Western
Development Campaign started from October 2000
didn’t alleviate the economic disparity between the
eastern and the western tourism, and the tourism
industry got seriously influenced by the SARS
breakout. The Yangtze River Delta region was an
area that enjoyed a high speed development in
inbound tourism during that period of time (tab2).
The economic gravity center varies within 115.87º-
115.92º of the east longitude, 30.86º-30.92º of the
north latitude during 2004-2007, and annual
distinctions of this period are slight. The movements
ANALYSIS ON THE SPATIAL VARIATION OF THE CENTER OF GRAVITY OF INBOUND TOURISM IN CHINA
443
between 2007 and 2010 remains eastward, with the
direction of the one of 2008 being apparently north
by east, resulting from the influences of the Sichuan
earthquake and Beijing Olympics. In 2009,
《 Instructions on the implementation of Hainan
International Travel Island Building and
Development
》 was released by the State Council
and the development project of the island has been
upgraded to a state strategy, a sign of a larger gap
between the east and the west, a smaller one
between the north and the south though.
Figure 1: China inbound tourism gravity center movement
from 2000-2010.
3.1.2 Shifting Distance
From the perspective of the shifting distance, the
shortest distance of gravity center shifting cor-
responds to the year of 2007, moving by 2.79km,
85.43 º to the north by east, and the longest
corresponds to the 2003, moving by 68.98km,
38.92º to the south by east. Shifting distances in 4
respective years are longer than 20km, reaching
194km, 78% of the total shifting distance, indicating
that the overall gravity center movement slows
down, but the external environment influences are
prominent to inbound tourism in China.
During the studied period of time, the angel of
the gravity center shifting is within the range of (
45º, 135º) or (-45º, -135º), stating that the situation
of
|
|<1 happened in 6 respective years (60%),
indicating a higher variation speed along the
longitude than the latitude from an overall view, and
a fiercer dynamic comparison between the east and
the west than between the north and the south.
Table 1: Direction and distance of China inbound tourism
gravity center movement from 2000-2010.
3.2 Inter-province Comparison of
In-bound Tourism Spatial
Distribution
3.2.1 Comparison of the Inbound Tourism
Scale
The list of Top 10 provinces (autonomous region or
municipality) in inbound tourism income
experiences slight changes during 2000-2003, yet it
stays comparatively stable from 2004, with only a
small number of provinces switching the ranking
positions. Starting from the year of 2004, the
international tourism income of Tianjin has been
ranked top 10 countrywide, yet Shanxi and Guangxi,
former top 10 seat-takers, were pushed out of the top
10 circle in the same year. During the studied deca-
de, the provinces among the top 10 in the
international tourism income that bear an obvious
growing proportion are Zhejiang, Jiangsu, Liaoning,
Shandong and Tianjin (fig.2), this might be an
apparent cause for the eastward tendency of the
movement of the inbound tourism gravity center.
Figure 2: Proportion of Top 10 Provinces in international
tourism income from 2000-2010.
ICEIS 2011 - 13th International Conference on Enterprise Information Systems
444
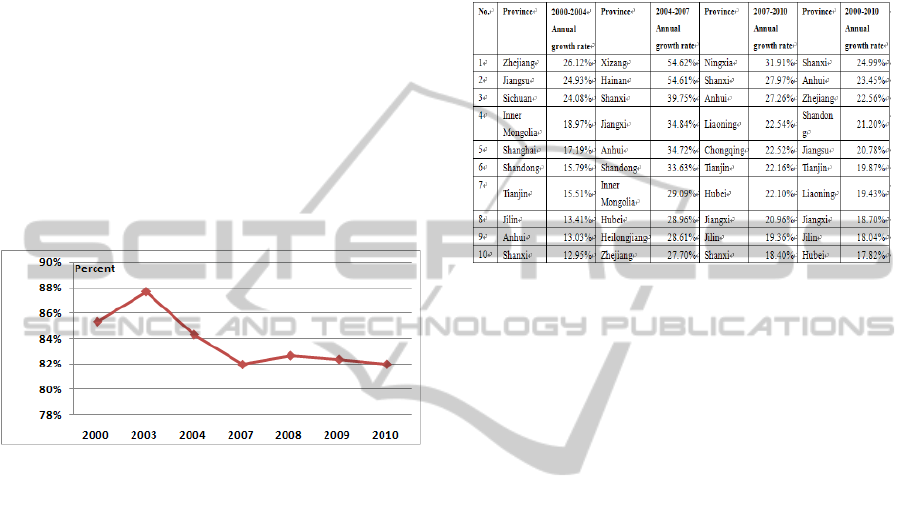
The cumulative proportion of top 10 provinces in
international tourism income declined during 2000-
2010(fig.3). The percentage is 85.34% in 2000, and
climbed to 87.68% in 2003, it decreased to 81.98%
in 2007, which is the lowest one during the past 11
years. The decline of the cumulative proportion of
the Top 10 provinces in international tourism
income reveals that the geographic concentration of
inbound tourism is on the downside. There are some
new and emerging destinations (as Xizang, Hainan,
etc.) coming up because of transportation
development, government supporting polices and
other reasons. Accordingly, the rapid growth rate of
this rising destinations in the west and central region
of China are changing the CoG of inbound tourism
to the southeast slightly in recent years (fig.1, fig.3,
tab.2).
Figure 3: Cumulative proportion of top 10 provinces from
2000-2010.
3.2.2 Comparison of Inbound Tourism
Growth Rate
The annual average growth rates are measured on a
four-period-division basis, the 10 regions with the
highest growth rates in each period are shown in Tab
2 along with the specific figures. The growth rates
are high and uneven, and those during 2004-2007
are the highest. The rates of Sichuan and Hainan
during the same four years are higher than 50%.
From 2007 to 2010, due to the influences of the
financial crisis, growth rates of all areas slow down,
with the one of a western region, Ningxia, being the
highest as over 30%. To compare seeing the country
as a whole, from 2000 to 2010, Shanxi, Anhui,
Zhejiang, Shandong and Jiangsu’s annual average
rates are higher than 20% and are the five highest in
the country.
In the past decade, Gansu province is the only
one holding a negative growth rate of -12.26%, and
the annual average growth rate of Beijing is the
second lowest as 6.19%, while Shanghai and
Guangdong, functioning as the “power sources” for
the tourism industry of the Yangtze River Delta and
the Pearl River Delta, retain annual average growth
rates of 14.67% and 11.65%.
Table 2: Top 10 provinces in international tourism income
growth rate.
3.2.3 Comparison between Regions
Bohai Sea area, Yangtze Delta area and Pearl River
Delta region are the three main region of China
inbound tourism, which has the core city of Beijing,
Shanghai and Guangzhou respectively. In the
beginning of reform and opening up of China, these
areas have seen the fast growth rate of inbound
tourism, but in recent decade, the growth patterns
are different among these regions. Shanghai
surpassed Beijing in 2003 to be the municipality
(province) with the second highest inbound tourism
income countrywide, and three out of the top ten
locate in the Yangtze Delta area, the center of which
is Shanghai, accounting for 30% of the national
inbound tourism income. The proportion of the
foreign exchange income generated by tourism of
Beijing in the national total has been declining since
2000, from 19.32% of 2000 to 9.71% of 2010.
Though the four members (Beijing, Tianjin,
Liaoning and Shandong) from the Bohai Sea area
that surrounds Beijing and Tianjin are among the top
ten list, a gap exists when compared to the Yangtze
Delta area in terms of the growth rate and the total
volume (fig.2, tab.2). The Pearl River Delta region
with Guangdong province as the core area, as a
whole consistently tops the inbound tourism foreign
income chart in the country. The figure of this
region goes down during the period of 2000-2007,
yet its national proportion stays around 23% in
recent years.
ANALYSIS ON THE SPATIAL VARIATION OF THE CENTER OF GRAVITY OF INBOUND TOURISM IN CHINA
445

4 CONCLUSIONS
Base on the previous analysis, in the past decade, in
terms of the shifting direction the inbound tourism
gravity center moves toward the north by east before
2008, and toward the south by west later on; in terms
of the shifting distance, the periods around 2003 and
2008 are when evident movement happens; in terms
of the shifting angel, the variation speed along the
longitude is faster than along the latitude, a
reflection of the situation that the east-west tourism
variation is fiercer than the south-north variation.
Since the gravity center represents a state that takes
the strength coming from all the spots into account,
the gravity center variation mirrors the redistribution
of the strength. Hence in reality it mirrors the
redistribution and variation char-acteristics of the
tourism and related industries of China. Although a
feature of the CoG of inbound tourism started to
move to the south and the west in the development
of the tourism industry in recent years, disparity
between the eastern and western regions is becoming
more and more notable, and the south-eastern coast
clustering overall structure of the inbound tourism
industry stays unchanged.
Having been through more than 30 years of fast
growth, the inbound tourism of the south-eastern
coast area is bound to be engaged in an industry
upgrade. Industry transfer is an important way of
industry upgrade, along with which physical
redistribution of the inbound tourism industry will
come along. Accelerating the inbound tourism
shifting toward the middle and western regions and
the underdeveloped areas in the north means a lot to
enhancing the coordinated development, reducing
the regional development disparity and improving
the industry upgrade in the eastern region. To realize
an even development among the inbound tourism
area and to realize an efficient industry transfer
between regions, first of all, with the high-speed
mass transit network construction in China since
2008, the transportation infrastructure system
requires improvement and expansion in the west and
central region of China, especially the lines between
the international port cities and the central and
western cities, fully bringing out the radiating and
linking effects of the core cities to accelerate the
Chinese tourism industrial development; secondly,
the investment environment of the middle and
western regions and the underdeveloped areas in the
north should be more elaborately established, the
tourism information and service network should be
further enhanced, achieving the paralleling of the
industrial distribution and tourism destination
planning, in the aim of orderly propelling the
tourism industry development in places like Shangri-
La, Ancient Silk Road, Three Gorges, the Qinghai-
Tibet Railroad adjacent areas, the North-eastern Old
Industrial Base, the Bohai Sea area, the Yangtze
River Delta area, the middle region, the Pearl River
Delta area, the coast west to the Taiwan Strait, Beibu
Gulf and the international travelling island of Hainan;
and finally, by means of upgrading the tourism
products realized by encouraging the middle and
western regions to develop eco-tourism and business
conference products, the inbound tourism is able to
develop at a higher speed and gain a stronger risk-
resisting ability.
ACKNOWLEDGEMENTS
This work was supported by the Fundamental
Research Funds for the Central Universities
(No.2011JBM035).
REFERENCES
Carl Von Clausewitz (2009). On War: The Complete
Edition. Wildside Press LLC. p. 144, 151, 253 437,
444.
L. N. Tellier, C. Vertefeuill (1995). Understanding Spatial
Inertia: Center of Gravity, Population Densities, the
Weber Problem, and Gravity Potential, Journal of
Regional Science, Vol.35, p.155-164.
G. F. Mulligan, J. P. Crampton (2005). Population growth
in the world’s largest cities. Cities, Vol. 22, No. 5,
p. 365–380.
Y. H. Bao (1998). Analysis of center of gravity evolution
of arable land and its driving factors in Inner Mon-
golia, Vol.17, No.4, p.47-54
J. H. Wang, etc. (2006).Spatial Distribution and App-
lications of Coal Resource Potential in China. Journal
of natural resources, Vol.21, No.2, p. 225-230.
Fan C, Scott J (2003) . Industrial Agglomeration and
Development:a Survey of Spatial Economic Issues
in East Asia and A Statistical Analysis of Chinese
Regions.Economic Geography, Vol.79, p.354-361.
Y. J. Yu, Y. Q. Lu (2005). Centrality of the Provincial
Cities. Economic Geography, Vol. 25, No. 3, p.
352-357.
Z. X. Feng, J. S. Huang (2005).The Empirical Application
of the Research Method of Gravity Center in
Industries and the Evolution and Characteristics of
Economic Space in China, Social Scientists, Vol.112,
No.2, p.77-83.
ICEIS 2011 - 13th International Conference on Enterprise Information Systems
446

Z. X. Feng, J. S. Huang (2006). Comparison of the
Dynamic Trajectory of Chinese Economic Gravity
Center and its Industrial Gravity Center from 1978 to
2003, Economic Geography, Vol.26, No.2, p.249-254.
G. Z. Cao, T. Liu (2007). Analysis of the Change of the
Employment Distribution in Beijing’s manufacturing,
Urban Development Study, Vol.14, No.6, p. 8-14.
J. J. Zhang, etc. (2009). Dynamic evolution of the center
of gravity of feed industry in China. Cereal and Feed
Industry, No.2, p.31-33
S. M. Wu, etc. (2010). An Analysis of Spatial Distribution
of Manufacturing Industry in China. China soft
science, No.3, p.123-131.
Wen M (2004). Relocation and Agglomeration of Chinese
Industry[J]. Journal of Development Economics,
Vol.73, p.236- 242.
Krugman P (1999). Increasing Returns and Economic
Geography[J]. Journal of Political Economy, Vol.99,
p.357-363.
Kanbur, Anthony J.Venables (2005). Spatial In-equality
and Development [M]. Oxford University Press.
National Tourism Administration of the People’s Republic
of China, “The Yearbook of China Tourism Statistics”
(2000-2009)
ANALYSIS ON THE SPATIAL VARIATION OF THE CENTER OF GRAVITY OF INBOUND TOURISM IN CHINA
447
