
CELLULAR AUTOMATA SIMULATION OF LAVA FLOWS
Applications to Civil Defense and Land Use Planning with a
Cellular Automata based Methodology
Rocco Rongo
1
, Valeria Lupiano
1
, Maria Vittoria Avolio
2
,
Donato D’Ambrosio
2
, William Spataro
2
and Giuseppe A. Trunfio
3
1
Department of Earth Sciences, University of Calabria, Via Pietro Bucci, I-87036 Rende, Italy
2
Department of Mathematics, University of Calabria, Via Pietro Bucci, I-87036 Rende, Italy
3
Department of Architecture, Planning and Design, University of Sassari, Piazza Duomo 6, 07041, Alghero, Italy
Keywords:
Lava flows simulation, Cellular automata, Hazard maps, Land use planning, Mt Etna.
Abstract:
A large number of people live either on or in the surrounding areas of hundreds of worldwide active volcanoes.
For this reason, the individuation of those areas that are more likely to be affected by new eruptive events is
of fundamental importance for diminishing possible consequences in terms of loss of human lives and/or
material properties. We here illustrate a methodology for defining flexible high-detailed lava invasion hazard
maps which is based on a efficient Cellular Automata computational model for simulating lava flowson present
topographic data and on High Performance Parallel Computing for increasing computational efficiency. We
also show the application of the methodology to the entire area surrounding Mt Etna (Italy), Europe’s most
active volcano, showing its suitability for land use planning and civil defence applications. Furthermore,
specific applications to inhabited areas of the volcano are also shown, which demonstrate the methodology’s
applicability in this field.
1 INTRODUCTION
Despite being the most active volcano in Europe, Mt
Etna (South Italy) is home to approximately one mil-
lion people (Behncke and Neri, 2003). Still, the ma-
jority of the events occurred in the last four cen-
turies report damage to human properties in numer-
ous towns on the volcano flanks. In last decades,
the susceptibility of the Etnean area to lava invasion
has increased due to continued urbanization (Dibben,
2008), with the consequence that new eruptions may
involve even greater risks. Different countermeasures
based on embankments or channels were adopted in
recent crises to stop or deflect lava (Barberi et al.,
1993) (Barberi et al., 2003). However, such kinds
of interventions are generally performed while the
eruption is in progress, with the consequence of both
not guarantying their effectiveness, besides inevitably
putting into danger the safety of involved persons.
One response to such challenges is the numerical sim-
ulation of lava flows (Ishihara et al., 1990), (DelNegro
et al., 2008), (Avolio et al., 2006), for the purpose of
individuating affected areas in advance. As a matter
of fact, in 2001 the path of the eruption that threat-
ened the town of Nicolosi on Mt Etna was correctly
predicted by means of a lava flows simulation model
(Crisci et al., 2004), providing at that time useful in-
formation to local Civil Defense authorities. How-
ever, in order to be efficiently and correctly applied,
the above approaches require an a priori knowledge of
the degree of exposure of the volcano surrounding ar-
eas, to allow both the realization of preventive coun-
termeasures, and a more rational land use planning.
Based on an improved version of the SCIARA cel-
lular automata lava flow model (Crisci et al., 2004),
we here illustrate a methodology for the definition
of flexible high-resolution lava invasion hazard maps,
and show results related to Mt Etna. Furthermore, we
show specific applications that can be useful for civil
defense purposes and land use planning.
2 THE SCIARA MODEL
In order to be applied for land use planning and
civil defense purposes in volcanic regions, a com-
putational model for simulating lava flows should be
37
Rongo R., Lupiano V., Avolio M., D’Ambrosio D., Spataro W. and Trunfio G..
CELLULAR AUTOMATA SIMULATION OF LAVA FLOWS - Applications to Civil Defense and Land Use Planning with a Cellular Automata based
Methodology.
DOI: 10.5220/0003575900370044
In Proceedings of 1st International Conference on Simulation and Modeling Methodologies, Technologies and Applications (SIMULTECH-2011), pages
37-44
ISBN: 978-989-8425-78-2
Copyright
c
2011 SCITEPRESS (Science and Technology Publications, Lda.)

well calibrated and validated against test cases to as-
sess its reliability, cf. e.g. (DelNegro et al., 2008)
(Rongo et al., 2008) (Vicari et al., 2007). Another
desirable characteristic should be the model’s effi-
ciency since, depending on the extent of the consid-
ered area, a great number of simulations could be
required (D’Ambrosio et al., 2006), (Crisci et al.,
2010). A first computational model of basaltic lava
flows, based on the Cellular Automata computational
paradigm and, specifically, on the Macroscopic Cel-
lular Automata approach for the modeling of spatially
extended dynamical systems, was proposed in (Crisci
et al., 1982) called SCIARA. In the following years,
the SCIARA family of lava flows simulation mod-
els have been improved and applied with success to
the simulation of different Etnean cases of study, e.g.
(Crisci et al., 2004) (Rongo et al., 2008).
Cellular Automata (CA) (Neumann, 1966) were
introduced in 1947 by the John von Neumann in
his attempt to understand and formalise the under-
ling mechanisms that regulate the auto-reproduction
of living beings. After the publication of his stud-
ies, Cellular Automata quickly came to the attention
of the Scientific Community both as powerful paral-
lel computational models and as convenient tools for
modelling and simulating several types of complex
physical phenomena (Chorpard and Droz, 1998).
Classical Cellular Automata can be viewed as an
n-dimensional space, R, subdivided in cells of uni-
forms shape and size. Each cell embeds an identical
finite automaton (fa), whose state accounts for the
temporary features of the cell; Q is the finite set of
states. The fa input is given by the states of a set
of neighbouring cells, including the central cell it-
self. The neighbourhood conditions are determined
by a geometrical pattern, X, which is invariant in time
and space. The fa have an identical state transition
function τ : Q
♯X
→ Q, where ♯X is the cardinality of
the set of neighbouring cells, which is simultaneously
applied to each cell. At step t = 0, fa are in arbitrary
states and the CA evolves by changing the state of all
fa simultaneously at discrete times, according to τ.
Macroscopic Cellular Automata (MCA) (DiGre-
gorio and Serra, 1999) introduce some extensions to
the classical CA formal definition. In particular, the
Q of state of the cell is decomposed in r substates,
Q
1
, Q
2
,..., Q
r
, each one representing a particular
feature of the phenomenon to be modelled (e.g. for
lava flow models, cell temperature, lava content, out-
flows, etc). The overall state of the cell is thus ob-
tained as the Cartesian product of the considered sub-
states: Q = Q
1
× Q
2
× ... × Q
r
. A set of parameters,
P = {p
1
, p
2
,..., p
p
}, is furthermore considered, which
allow to “tune”the model for reproducing different
dynamical behaviours of the phenomenon of interest
(e.g. for lava flow models, the Stephan-Boltzmann
constant, lava density, lava soldification temperature,
etc). As the set of state is split in substates, also the
state transition function τ is split in elementary pro-
cesses, τ
1
,τ
2
,...,τ
s
, each one describing a particular
aspect that rules the dynamic of the considered phe-
nomenon. Eventually, G ⊂ R is a subset of the cel-
lular space that is subject to external influences (e.g.
for lava flow models, the crater cells), specified by the
supplementary function γ. External influences are in-
troduced in order to model features which are not easy
to be described in terms of local interactions.
In the MCA approach, by opportunely discretiz-
ing the surface on which the phenomenon evolves, the
dynamics of the system can be described in terms of
flows of some quantity from one cell to the neigh-
bouring ones. Moreover, as the cell dimension is a
constant value throughout the cellular space, it is pos-
sible to consider characteristics of the cell (i.e. sub-
states), typically expressed in terms of volume (e.g.
lava volume), in terms of thickness. This simple as-
sumption permits to adopt a straightforward but effi-
cacious strategy that computes outflows from the cen-
tral cell to the neighbouring ones in order to minimize
the non-equilibrium conditions.
Still, owing to their intrinsic parallelism, both CA
and MCA models implementation on parallel com-
puters is straightforward, and the simulation dura-
tion can be reduced almost proportionally to the num-
ber of available processors (D’Ambrosio and Spataro,
2007).
In this work, the latest release of the SCIARA Cel-
lular Automata model for simulating lava flows was
adopted. Specifically, a Bingham-like rheology has
been introduced for the first time as part of the Min-
imization Algorithm of the Differences (DiGregorio
and Serra, 1999), which is applied for computing lava
outflows from the generic cell towards its neighbors.
Besides, the hexagonal cellular space adopted in the
previous releases (Crisci et al., 2004) of the model
for mitigating the anisotropic flow direction problem
has been replaced by a square one, nevertheless by
producing an even better solution for the anisotropic
effect. The model has been calibrated by consider-
ing three important real cases of studies, the 1981,
2001 and 2006 lava flows at Mt Etna (Italy), and on
ideal surfaces in order to evaluate the magnitude of
anisotropic effects. Even if major details of this ad-
vanced model can be found in (Spataro et al., 2010),
we briefly outline it’s main specifications.
In formal terms, the SCIARA MCA model is de-
fined as:
SCIARA =< R, L,X,Q,P,τ, γ > (1)
SIMULTECH 2011 - 1st International Conference on Simulation and Modeling Methodologies, Technologies and
Applications
38

where:
– R is the set of square cells covering the bi-
dimensional finite region where the phenomenon
evolves;
– L ⊂ R specifies the lava source cells (i.e. craters);
– X = {(0, 0),(0,1), (−1,0),(1,0),(0,−1), (−1,1),
(−1, −1),(1, −1), (1,1)} identifies the pattern of
cells (Moore neighbourhood) that influence the
cell state change, referred to cells by indexes 0
(for the central cell) through 8;
– Q = Q
z
× Q
h
× Q
T
× Q
8
f
is the finite set of states,
considered as Cartesian product of “substates”.
Their meanings are: cell elevation a.s.l. (above
sea level), cell lava thickness, cell lava tempera-
ture, and lava thickness outflows (from the central
cell toward the eight adjacent cells), respectively;
– P = {w,t,T
sol
,T
vent
,r
Tsol
,r
Tvent
,hc
Tsol
,hc
Tvent
,δ,
ρ,ε,σ,c
ν
} is the finite set of parameters (invari-
ant in time and space) which affect the transition
function (please refer to (Spataro et al., 2010) for
their specifications);
– τ : Q
9
→ Q is the cell deterministic transition
function, applied to each cell at each time step,
which describes the dynamics of lava flows, such
as cooling, solidification and lava outflows from
the central cell towards neighbouring ones;
– γ : Q
h
× N → Q
h
specifies the emitted lava thick-
ness, h, from the source cells at each step k ∈ N
(N is the set of natural numbers).
As stated before, the new SCIARA model intro-
duces a rheology inspired to the Bingham model and
therefore the concepts of critical height and viscos-
ity are explicitly considered (Park and Iversen, 1984),
(Dragoni et al., 1986). In particular, lava can flow
out from a cell towards its neighbours if and only if
its thickness overcomes a critical value (i.e. the crit-
ical height), so that the basal stress exceeds the yield
strength. Moreover, viscosity is accounted in terms of
flow relaxation rate, r, a the parameter of the distribu-
tion algorithm that influences the amount of lava that
actually leaves the cell, according to a power law of
the kind:
logr = a+ bT (2)
where T is the lava temperature and a and b coef-
ficients determined by solving the system:
logr
Tsol
= a+ bT
sol
logr
Tvent
= a + bT
vent
where T
sol
and T
vent
are the lava temperature at so-
lidification and at the vents, respectively. Similarly,
the critical height, hc, mainly depends on lava tem-
perature according to a power law of the kind:
loghc = c+ dT (3)
whose coefficients c and d are obtained by solving
the system:
loghc
Tsol
= c+ dT
sol
loghc
Tvent
= c+ dT
vent
It is known that, in general, deterministic CA
for the simulation of macroscopic fluids present a
strong dependence on the cell geometry and direc-
tions of the cellular space. In order to solve the prob-
lem, different solutions have been proposed in liter-
ature, such as the adoption of hexagonal cells (Crisci
et al., 2004), (Avolio et al., 1998), (D’Ambrosio et al.,
2003) or Monte Carlo approaches (Miyamoto and
Sasaki, 1997), (Vicari et al., 2007). The first solu-
tion, however, does not perfectly solve the problem
on ideal surfaces, while the second one has the dis-
advantage of giving rise to non-deterministic simula-
tion models. In order to solve the anisotropic prob-
lem, which is typical of deterministic Cellular Au-
tomata models for fluids on ideal surfaces, a fictitious
topographic alteration along diagonal cells is consid-
ered with respect to those “individuated” by the DEM
(Digital Elevation Model). As a matter of fact, in a
standard situation of non-altered heights, cells along
diagonals result in a lower elevation with respect to
the remaining ones (which belong to the von Neu-
mann neighborhood), even in case of constant slope.
This is due since the distance between the central cell
and diagonal neighbors is greater than of the distance
between the central cell and orthogonal adjacent cells
(cf. Figure 1). This introduces a side effect in the
distribution algorithm, which operates on the basis of
height differences. If the algorithmperceivesa greater
difference along diagonals, it will erroneously privi-
lege them by producing greater outflows. In order to
solve this problem, we consider the height of diag-
onal neighbors taken at the intersection between the
diagonal line and the circle with radius equal to the
cell side and centered in the central cell, so that the
distance with respect to the centre of the central cell
is constant for each cell of the Moore neighbourhood
(Figure 1). Under the commonly assumed hypothesis
of inclined plane between adjacent cells (Vicari et al.,
2007), this solution permits to have constant differ-
ences in level in correspondence of constant slopes,
and the distribution algorithm can work “properly”.
Refer to (Spataro et al., 2010) for other specifications
on this issue.
CELLULAR AUTOMATA SIMULATION OF LAVA FLOWS - Applications to Civil Defense and Land Use Planning
with a Cellular Automata based Methodology
39
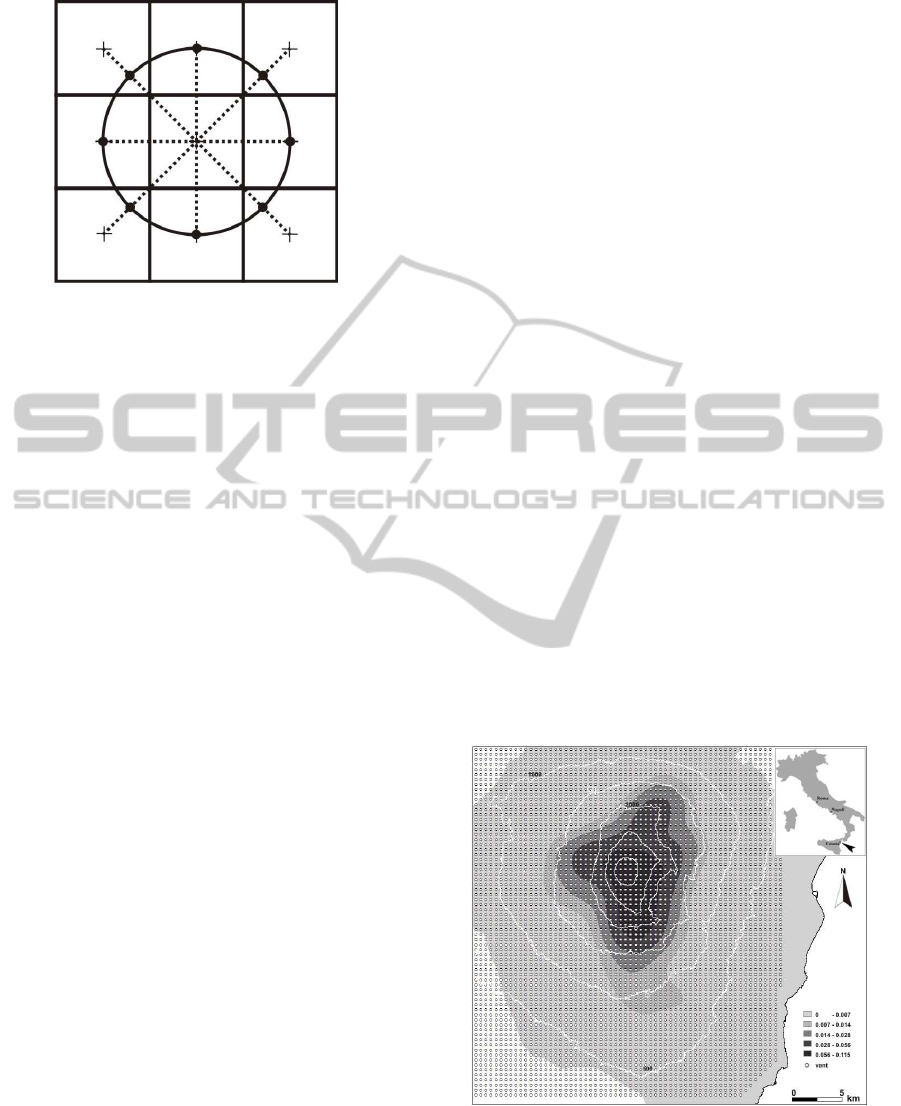
Figure 1: Reference schema for cells altitude determination
in the Moore neighbourhood. Altitudes of cells belonging
to the von Neumann neighbourhood correspond to normal
DEM values, while those along diagonals are taken at the
intersection between the diagonal line and the circle with
radius equal to the cell side, so that the distance with respect
to the centre of the central cell is constant for each adjacent
neighbour.
3 A METHODOLOGY FOR
CREATING HAZARD MAPS
While a reliable simulation model is certainly a valid
instrument for analyzing volcanic risk in a certain area
by simulating possible single episodes with different
vent locations, e.g. (Crisci et al., 1999), the methodol-
ogy for defining high detailed hazard maps here pre-
sented is based on the application of the SCIARA lava
flows computational model for simulating an elevated
number of new events on topographic data. In par-
ticular, the methodology requires the analysis of the
past behavior of the volcano, for the purpose of clas-
sifying the events that historically interested the re-
gion. In such a way, a meaningful database of plau-
sible simulated lava flows can be obtained, by char-
acterizing the study area both in terms of areal cover-
age, and lava flows typologies. Once the simulation
database has been completed (i.e., an adequate, usu-
ally elevated, number of simulations have been car-
ried out), data is processed by considering a proper
criterion of evaluation. A first solution could simply
consist in considering lava flows overlapping, by as-
signing a greater hazard to those sites interested by
a higher number of simulations. However, a similar
choice could be misleading. In fact, depending on
their particular traits (e.g., location of the main crater,
duration and amount of emitted lava, or effusion rate
trend), different events can occur with different prob-
abilities, which should be taken into account in evalu-
ating the actual contribution of performed simulations
with respect to the definition of the overall hazard of
the study area. In most cases, such probabilities can
be properly inferred from the statistical analysis of
past eruptions, allowing for the definition of a more
refined evaluation criterion. Accordingly, in spite of
a simple hitting frequency, a measure of lava invasion
hazard can be obtained in probabilistic terms. In the
following, we show how such approach was applied
to Mt Etna.
3.1 Application of the Methodology to
the Mt. Etna Volcano Area
By adopting a procedure well described in (Crisci
et al., 2010) and (Avolio et al., 2010), which referred
to the Eastern sector of Mt. Etna and which was ap-
plied by employing a previousversion of the SCIARA
CA model, we here show the application to the entire
area of the volcano using the new SCIARA model de-
scribed in Section 2. Firstly, based on documented
past behavior of the volcano, the probability of new
vents forming was determined, resulting in a charac-
terization (thus, a Probability Density Function - PDF
- map) of the study region into areas (Figure 2), that
represent different probabilities of new vents opening
(Cappello et al., 2011), assessed by employing a Pois-
son distribution which considers a spatial density and
a temporal component. The spatial probability den-
sity function was estimated through a Gaussian ker-
nel by considering the main volcanic structures at Mt
Etna, while the temporal rate was evaluated by using
an approach based on the “repose-time method” (Ho
et al., 1991).
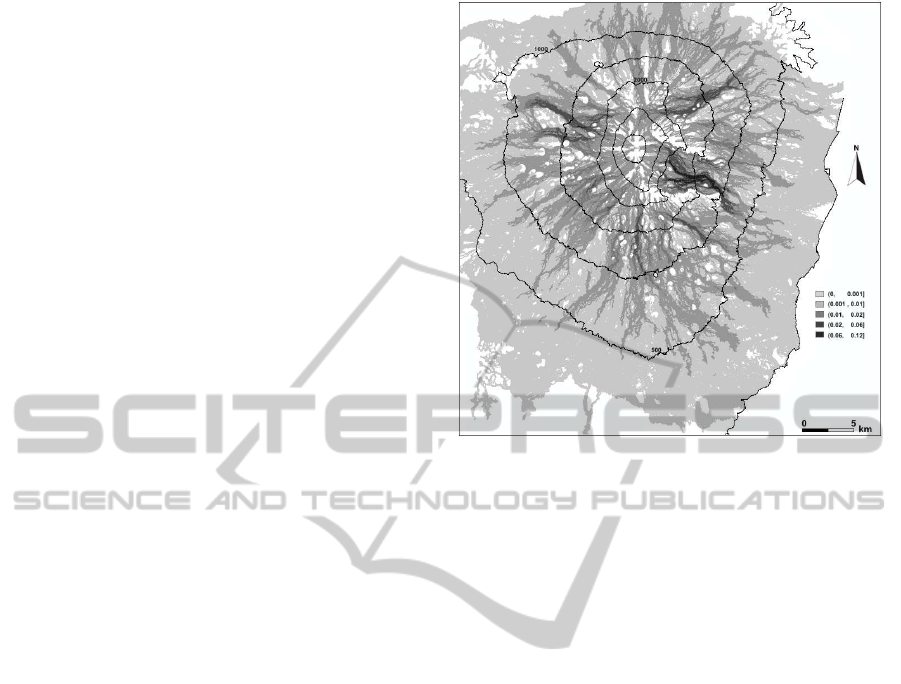
Figure 2: The characterization of new vents forming of the
study region on the basis of historical data (see text), rep-
resenting different probabilities of activation, considered in
this work, together with the grid of 4290 hypothetical vents
defined as the source for the simulations to be carried.
Subsequently, all flank eruptions of Etna since
SIMULTECH 2011 - 1st International Conference on Simulation and Modeling Methodologies, Technologies and
Applications
40
1600 AD were classified according to duration and
lava volume (Crisci et al., 2010) and a representa-
tive effusion rate trend taken into account in order
to characterize lava temporal distribution for the con-
sidered representative eruptions, basically reflecting
the effusive mean behavior of Etnean lava flows. In
fact, with the exception of few isolated cases, a typ-
ical effusive behavior was strongly evidenced by the
analysis of the volcano past activity (Behncke et al.,
2005). As a consequence, it is not a hasty judgment
to suppose that such behavior will not dramatically
change in the near future and thus that the SCIARA
lava flows simulation model, calibrated and validated
on a set of effusive eruptions, be adequate for simulat-
ing new events on Mt Etna. An overall probability of
occurrence, p
e
, was thus defined for each scenario, by
considering the product of the individual probabilities
of its main parameters:
p
e
= p
s
· p
c
· p
t
(4)
where p
s
denotes the probability of eruption from
a given location (i.e., based on the PDF map), p
c
the
probability related to the event’s membership class
(i.e., emitted lava and duration), and p
t
the probability
related to its effusion rate trend.
Once representative lava flows were devised as
above, a set of simulations were planned to be exe-
cuted in the study area by means of the SCIARA lava
flows simulation model. At this purpose, a grid com-
posed by 4290 craters, equally spaced by 500m, was
defined on the considered as a covering for Mt Etna,
as shown in Figure 2. This choice allowed to both
adequately and uniformly cover the study area, be-
sides considering a relatively small number of craters.
Specifically, a subset of event classes which define
6 different effusion rates probabilities, derived from
historical events considered in (Crisci et al., 2010),
were taken into account for each crater, thus resulting
in a total of 25740 different simulations to be carried
out. Owing to the elevated number of SCIARA simu-
lations to be carried out, thanks to the adoption of Par-
allel Computing each scenario was simulated for each
of the vents of the grid. Simulations were performed
on an 80-node Apple Xserve Xeon-based cluster and
were performed in ca. 10 days.
Lava flow hazard was then punctually evaluated
by considering the contributions of all the simulations
which affected a generic cell in terms of their proba-
bility of occurrence. Formally, if a given DEM cell
(and thus, a CA cell) of co-ordinates (x,y) is affected
by n
x,y
≤ N simulations, being N the overall number
of performed simulations, its hazard h
x,y
can be de-
fined as the sum of the probabilities of occurrence of
involved lava flows, p
e
(i) (i=1, 2, ..., n
x,y
):
Figure 3: Hazard map of the study area based on the 25740
simulations. As a compromise between map readability and
accuracy, 5 classes are reported (grey colouring), in increas-
ing order of susceptibility (probability of lava invasion).
h
x,y
=
n
x,y
∑
i=1
p
e
(i) (5)
The obtained lava flow hazard map resulting from
these simulations and the application of equation 5 is
presented in Figure 3, and represents the probability
that future eruptions will affect the entire Etnean area.
Importantly, the methodology for the compilation
of lava flows invasion hazard maps here proposedpro-
vides for, as integrant part, a process for the verifica-
tion of results. A validation procedure was thus con-
templated for the produced hazard map, consisting in
a technique which produces statistical indicators on
which one can quantify the reliability of the results
and, therefore, assess whether the final product can be
confidently used for Civil Protection, for example, for
setting in safety particularly vulnerable areas, and for
Land Use Planning. Refer to (Crisci et al., 2010) for
major details on the methodology validation process.
4 APPLICATIONS FOR CIVIL
DEFENSE AND LAND USE
PLANNING
Apart leading for the definition of general hazard
maps, as the one reported in Figure 3, the method-
ology permits further Civil Defense oriented appli-
cations. For this purpose, the calibrated and vali-
dated SCIARA simulation model has been integrated
CELLULAR AUTOMATA SIMULATION OF LAVA FLOWS - Applications to Civil Defense and Land Use Planning
with a Cellular Automata based Methodology
41
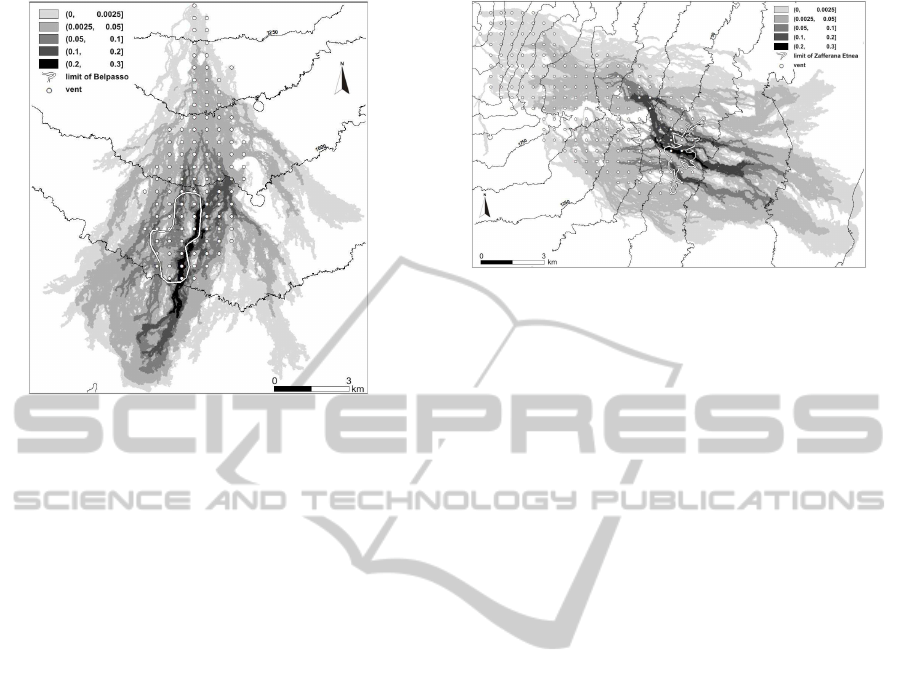
Figure 4: Map showing vents, belonging to the simulation
grid of Fig. 2, which can produce eruptions capable of af-
fecting the urban area of the town of Belpasso, together with
the resulting susceptibility scenario, allowing to immedi-
ately assess the threat posed by an eruption exclusively on
the basis of its source location.
in a GIS (Geographic Information System) applica-
tion that permits to take also into account the effects
of “virtual” embankments, channels, barriers, etc. In
particular, the availability of a large number of lava
flows of different eruption types, magnitudes and lo-
cations simulated for this study allows the instanta-
neous extraction of various scenarios. This is espe-
cially relevant once premonitory signs indicate the
possible site of imminent eruptions, and thus permit-
ting to consider hazard circumscribed to a smaller
area.
A first Civil Defense oriented application regards
the possibility to identify all source areas of lava flows
that are capable of affecting a given area of interest,
such as a town or a major infrastructure. In this case,
this application is rapidly accomplished by querying
the simulation database, by selecting the lava flows
that affect the area of interest and by circumscrib-
ing their sources. For this application we have cho-
sen the towns of Belpasso and Zafferana Etnea, two
important historical and cultural sites, with many ad-
ministrative buildings and tourist facilities. Figure 4
and Figure 5 show vents which can originate erup-
tions capable of affecting the urban areas of Belpasso
and Zafferana Etnea, respectively, together with the
resulting hazard scenario, allowing to immediately as-
sess the threat posed by an eruption exclusivelyon the
basis of its source location.
Etnean eruptions can even comprise complex
events, which for Etna are fairly typical, such as lava
Figure 5: A second example of application of hazard zona-
tion referred to the town of Zafferana Etnea. Even in this
case, the map shows vents which can produce eruptions ca-
pable of affecting the urban area of the town. As before, an
elevated risk is present for the center of the inhabited area
emission from an extensive system of eruptive fis-
sures propagating downslope over a length of several
kilometers. We have performed an analysis for such
an eruption on the east-northeast flank of Etna, not far
from the 1928 eruption site, with lava emission from
a fissure system about 7km long. The eruptive system
was approximated by a subset of vents of the simula-
tion grid and all lava flows originated from them se-
lected from the simulation database (without needing
to perform new simulations). For this application, the
resulting map is shown in Figure 6. The same figure
refers also to a further application regarding temporal
hazard mapping, by evidencing the evolution of the
involved area in time. This application could be of
fundamental importance for assessing, from a tempo-
ral pointof view, howhazard of a specific area evolves
in time (e.g. day by day), so that more specific coun-
termeasures can be considered by responsible author-
ities.
Specifically, Figure 6 also shows the result rela-
tive to 1, 3, 6 and 9 days respectively, of the invaded
areas, with relative probability values of occurrence,
in the case of the activation of the considered fissure
system. This application regards a real-time assess-
ment of lava invasion in confined areas, since the pro-
duced map indicates a temporal evolution of hazard,
in terms of probability, which can be useful in case of
an imminent/new event to Civil Protection to moni-
tor, and eventually intervene, in areas with higher val-
ues of lava hazard, without having information on the
event’s duration and emission rate that take place.
Other examples of applications referred to risk
mitigation can be considered for testing the impact
of human intervention during an eruption, in order to
assess the effect of possible human interventions with
the aim for decreasing hazard in critical areas. For in-
stance, it is possible to evaluate the effect, in terms
SIMULTECH 2011 - 1st International Conference on Simulation and Modeling Methodologies, Technologies and
Applications
42
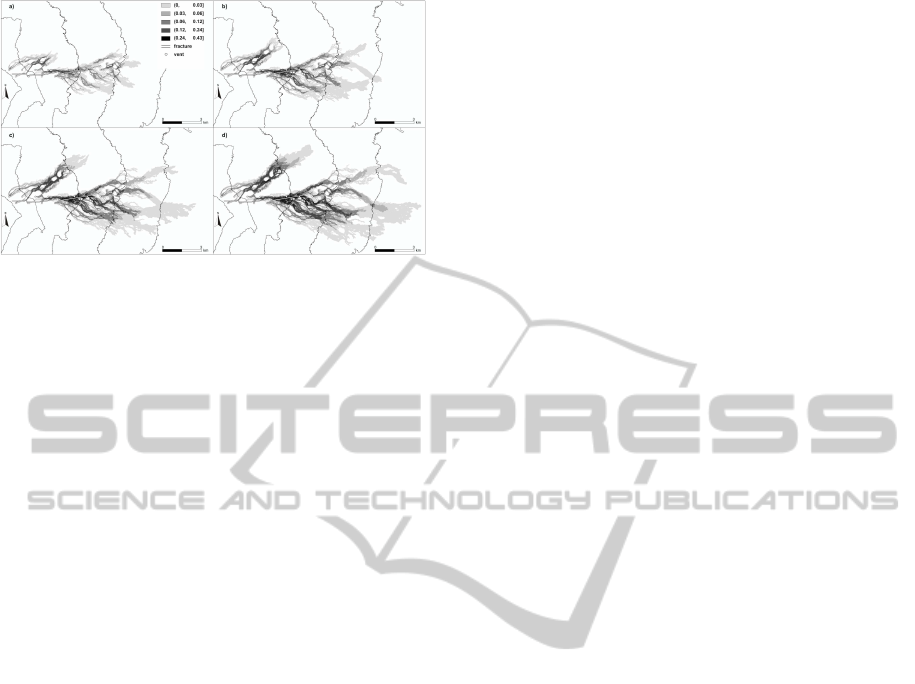
Figure 6: A hypothetical hazard scenario for a system of
eruptive fissures propagating downslope over a length of 7
km on the east-northeast flank of Mount Etna. The figure
refers to lava hazard of the area after 1, 3, 6 and 9 days (a,
b, c, d), respectively. Note that the same scenarios can be
considered as temporal scenario for the area.
of hazard decrease, of barriers or channels built to
protect inhabited areas. Please refer to (Crisci et al.,
2010) for specific examples regarding a case study
performed for evaluating the impact of a barrier to
protect the town of Nicolosi, a strategic town of the
Etnean area.
5 CONCLUSIONS
We have presented an application of Cellular Au-
tomata for defining high-detailed hazard maps which
can be fruitfully applied for land use planning and
civil defense purposes. Based on the adoption of the
latest release of the Macroscopic Cellular Automata
model SCIARA for simulating lava flows, which con-
siders a Bingham-like rheology, the methodology per-
mits the creation of general lava flow hazard maps,
which can be fundamental for land-use and civil
defense planning in the long-term. Regarding the
adopted new computational model, which is at the
basis of the methodology, SCIARA re-introduces a
square tessellation of the cellular space instead of the
previously adopted hexagonal one, which was con-
sidered in the earlier versions to limit the effect of the
anisotropic flow direction problem.
A novelty of the presented methodology, besides
the possibility of assessing the efficiency of protective
measures for inhabited areas and/or major infrastruc-
tures, is that the simulation data permits to produce
general susceptibility maps in unprecedented detail,
and contains each single scenario out of a total of over
thousands of simulated cases. It is therefore no longer
necessary to wait for the next eruption and know its
eruptive parameters and location in order to run ad-
hoc simulations, as has been the practice until now.
Instead, virtually all possible eruption scenarios can
be simulated a priori, from as dense a network of hy-
pothetical vent locations as possible, and extracted in
real time as soon as the need arises, as in the case of
an imminent or incipient eruptions.
The methodology here described can therefore
represent a substantial advance in the field of lava flow
impact prediction and can also have immediate, far
reaching implications both in land use and civil de-
fense planning.
ACKNOWLEDGEMENTS
Authors thank Dr. B. Behncke and Dr. M. Neri from
the INGV - Istituto Nazionale di Geofisica e Vul-
canologia of Catania (Sicily, Italy), who provided to-
pographic maps and the volcanological data. The au-
thors are also grateful to Prof. G.M. Crisci and Prof.
S. Di Gregorio for their precious comments and the
common researches.
REFERENCES
Avolio, M., Crisci, G., S.DiGregorio, Rongo, R., Spataro,
W., and D’Ambrosio, D. (2006). Pyroclastic flows
modelling using cellular automata. Comp. Geosc.,
32:897–911.
Avolio, M., D’Ambrosio, D., DiGregorio, S., Lupiano, V.,
Rongo, R., and Spataro, W. (2010). Evaluating lava
flow hazard at Mount Etna (Italy) by a cellular au-
tomata based methodology. LNCS, 6068:495–504.
Avolio, M., DiGregorio, S., Rongo, R., Sorriso-Valvo, M.,
and Spataro, W. (1998). Hexagonal cellular automata
model for debris flow simulation. In Proceedings of
IAMG, pages 183–188. Litografia Editrice, Naples.
Barberi, F., Brondi, F., Carapezza, M. L., Cavarra, L., and
Murgia, C. (2003). Earthen barriers to control lava
flows in the 2001 eruption of Mt. Etna. J. Volcanol.
Geotherm. Res., 123:231–243.
Barberi, F., Carapezza, M., Valenza, M., and Villari, L.
(1993). The control of lava flow during the 1991-1992
eruption of Mt. Etna. J. Volcanol. Geotherm. Res.,
56:1–34.
Behncke, B. and Neri, M. (2003). Cycles and trends in the
recent eruptive behaviour of Mount Etna (Italy). Can.
J. Earth Sci., 40:1405–1411.
Behncke, B., Neri, M., and Nagay, A. (2005). New data
from a GIS-based study, kinematics and dynamics of
lava flows. Geol. Soc. Am. Spec. Pap., 396:189–208.
Cappello, A., Vicari, A., and DelNegro, C. (2011). A ret-
rospective validation of lava flow hazard map at Etna
volcano. Spec. Issue of Annals of Geophy., To Appear.
Chorpard, B. and Droz, M. (1998). Cellular Automata
Modeling of Physical Systems. Cambridge University
Press, UK.
CELLULAR AUTOMATA SIMULATION OF LAVA FLOWS - Applications to Civil Defense and Land Use Planning
with a Cellular Automata based Methodology
43

Crisci, G., Avolio, M., Behncke, B., D’Ambrosio, D., Di-
Gregorio, S., Lupiano, V., Neri, M., Rongo, R., and
Spataro, W. (2010). Predicting the impact of lava
flows at Mount Etna. J. Geophy. Res., 115(B0420):1–
14.
Crisci, G., DiGregorio, S., Nicoletta, F., Rongo, R., and
Spataro, W. (1999). Analysing lava risk for the et-
nean area: Simulation by cellular automata methods.
Natural Hazards, 20:215–229.
Crisci, G., DiGregorio, S., and Ranieri, G. (1982). A cellu-
lar space model of basaltic lava flow. In Proceedings
International AMSE Conference Modelling & Simula-
tion.
Crisci, G., Rongo, R., DiGregorio, S., and Spataro, W.
(2004). The simulation model SCIARA: The 1991
and 2001 lava flows at Mount Etna. J. Volc. Geoth.
Res., 132:253–267.
D’Ambrosio, D., DiGregorio, S., and Iovine, G. (2003).
Simulating debris flows through a hexagonal cellular
automata model: Sciddica S3-hex. Nat. Haz. Ear. Sys.
Scien., 3:545–559.
D’Ambrosio, D., Rongo, R., Spataro, W., Avolio, M.,
and Lupiano, V. (2006). Lava invasion susceptibil-
ity hazard mapping through cellular automata. LNCS,
4173:452–461.
D’Ambrosio, D. and Spataro, W. (2007). Parallel evolution-
ary modelling of geological processes. Paral. Comp.,
33(3):186–212.
DelNegro, C., Fortuna, L., Herault, A., and Vicari, A.
(2008). Simulations of the 2004 lava flow at Etna vol-
cano using the magflow cellular automata model. Bull.
Volcanol., 70:805–812.
Dibben, C. (2008). Leaving the city for the suburbs - the
dominance of ’ordinary’ decision making over vol-
canic risk perception in the production of volcanic
risk on Mt Etna, Sicily. J. Volcanol. Geotherm. Res.,
172:288–299.
DiGregorio, S. and Serra, R. (1999). An empirical method
for modelling and simulating some complex macro-
scopic phenomena by cellular automata. Fut. Gen.
Comp. Sys., 16:259–271.
Dragoni, M., Bonafede, M., and Boschi, E. (1986). Downs-
lope flow models of a Bingham liquid: Implications
for lava flows. J. Volc. Geoth. Res., 30(3-4):305–325.
Ho, C., Smith, E., Feuerbach, D., and Naumann, T. (1991).
Eruptive calculation for the Yucca Mountain site,
USA: Statistical estimation of recurrence rates. Bull.
Volcanol., 54:50–56.
Ishihara, K., Iguchi, M., and Kamo, K. (1990). Numerical
simulation of lava flows on some volcanoes in Japan.
In IAVCEI Proceedings in Volcanology, pages 174–
207. Springer, Berlin Heidelberg New York.
Miyamoto, H. and Sasaki, S. (1997). Simulating lava flows
by an improved cellular automata method. Comp.
Geosci., 23:283–292.
Neumann, J. V. (1966). Theory of self-reproducing au-
tomata. Univ. Illinois Press, Urbana.
Park, S. and Iversen, J. (1984). Dynamics of lava
flow: Thickness growth characteristics of steady 2-
dimensional flow. Geophys. Res. Lett., 11:641–644.
Rongo, R., Spataro, W., D’Ambrosio, D., Avolio, M., Trun-
fio, G., and DiGregorio, S. (2008). Lava flow hazard
evaluation through cellular automata and genetic al-
gorithms: An application to Mt Etna volcano. Fund.
Inform., 8:247–268.
Spataro, W., Avolio, M., Lupiano, V., Trunfio, G., Rocco,
R., and D’Ambrosio, D. (2010). The latest release
of the lava flows simulation model SCIARA: First
application to Mt Etna (Italy) and solution of the
anisotropic flow direction problem on an ideal surface.
In Proccedings of the International Conference on
Computational Science. ICCS 2010, volume 1, pages
17–26. Procedia Computer Science.
Vicari, A., Herault, A., DelNegro, C., Coltelli, M.,
Marsella, M., and Proietti, C. (2007). Modelling of the
2001 lava flow at Etna volcano by a cellular automata
approach. Environ. Model. Soft., 22:1465–1471.
SIMULTECH 2011 - 1st International Conference on Simulation and Modeling Methodologies, Technologies and
Applications
44
