
Measuring and Improving IT Service Support Processes:
A Case Study
Kai Zhou and Beijun Shen
School of Software, Shanghai Jiaotong University, Shanghai, 200240, China
Abstract. With the rapid development of Information Technologies for many
organizations and the increasing importance of IT, the focus of IT management
has shifted from device-oriented management to service-oriented management.
This paper describes the approach and results of measurement and improvement
of IT service support processes in Bank of China and Nokia Co. The research
applied best practices of Organizational Process Performance Process Area
defined in CMMI to IT service support processes, and the following steps were
adopted: defining the process models, designing their metrics from goals, data
collection, processes evaluation, and the identification and elimination of
bottlenecks. Two research questions concerned with the research approach are
raised and explored in this paper.
1 Introduction
Over the past few years, Information Technology has become one of the most
important roles in an increasing number of companies [1] Accordingly, IT
performance directly affects the business performance. On the other hand, the
emergence of new technologies and the increasing complexities of systems make it
even harder for companies to achieve IT service management goals effectively and
efficiently. Therefore, one of the key points to achieve business goals successfully is
to ensure IT performance and quality.
To improve IT performance and quality, it is of utmost importance to enhance the
maturity of IT service support processes. Due to the increasing role of IT service
management in the enterprise, several standards and best practices – ITIL [2], [3]
ISO20000 [4] and CMMI [5] for service -- provide guidelines for IT service
management and are adopted in IT organizations all over the world. IT service
support processes include the incident management process, problem management
process, configuration management process, change management process and release
management process. The efficiency and quality of IT service support processes
directly influences the user’s perception of service and the business efficiency and
qualities. Thus, efforts are needed to identify and eliminate the bottlenecks to improve
the process performance.
Though the quantitative analysis of IT service support processes is seldom
discussed in ITIL, useful academic researches related to IT service support processes
have been reported in the literature [6], [7], [8]. In addition, other research attempts
have been made to measure and improve software processes [9], [10]. However, there
Zhou K. and Shen B..
Measuring and Improving IT Service Support Processes: A Case Study.
DOI: 10.5220/0003568100280035
In Proceeding of the 1st International Workshop on Evidential Assessment of Software Technologies (EAST-2011), pages 28-35
ISBN: 978-989-8425-58-4
Copyright
c
2011 SCITEPRESS (Science and Technology Publications, Lda.)
is still a lack of a general method for IT service support processes measurement and
improvement. Furthermore, the lack of empirical studies in this field is evident and
must be addressed.
Organizational Process Performance (OPP) process area, which is defined in
CMMI, builds process performance baseline (PPB) to determine if the process quality
and performance objectives have been achieved. Based on PPB, process performance
model (PPM) is established to predict process quality and performance, but the
concrete steps to build PPM are not specified in CMMI.
Under this background, we conducted research on two organizations - Bank of
China and Nokia Co. This case study is continued from our previous work where we
proposed a BPDM-based IT service support process metamodel [11]. This research
utilizes the best practices of Organizational Process Performance (OPP) Process Area
defined in CMMI [12] to measure and improve performance and qualities of IT
service support processes.
In this work, we focus on the measurement and improvement of IT service support
processes in two case organizations. The remaining of the paper is structured as
follows: Section 2 describes the research methods of this study. Section 3 presents the
research results to answer research questions. In section 4, we summarize our results
and point out some limitations in this study.
2 Research Method
This case study is part of work of the research project SOMSMP (Software Operation
and Maintenance Service Management Process) from Shanghai Jiaotong University,
China, funded by the Key Laboratory of High Confidence Software Technologies of
the Ministry of Education of China. This project is a systemic research of software
operation and maintenance service management processes, and this paper makes a
preliminary study of IT service support process measurement and improvement.
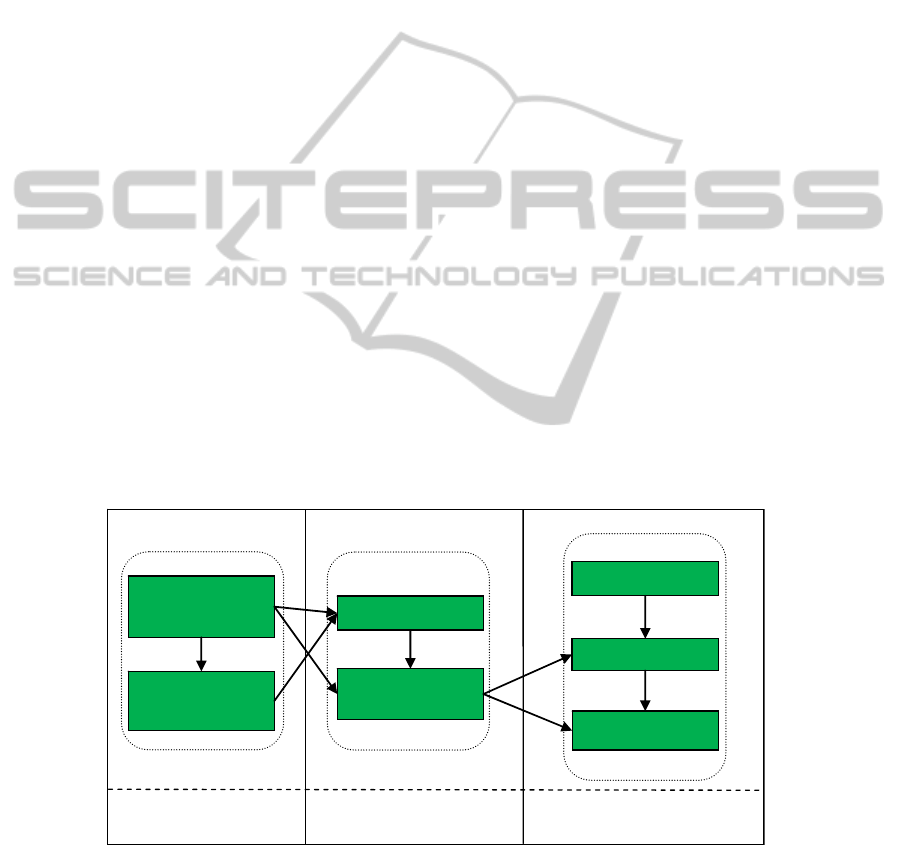
Fig. 1. Framework of the OPP-based approach to measure and improve IT service support
processes.
Process objectives
establishment
Process analysis
and modeling
Modeltheprocesses EstablishMeasuresystem
Model analysis
Metric
determination
Data collection
Data anal
y
sis
prediction model
Evaluateandimprove
29

We choose two research questions related to the IT service support processes
measurement and improvement:
Q1: How is an IT service support process described and how are metrics defined?
Q2: How are the processes evaluated and bottlenecks identified effectively?
OPP [12] is one of the Key Process Areas in CMMI for Development (CMMI-DEV),
which is developed for the improvement of software development processes.
According to the research questions, we propose a method to measure and improve
the IT service support processes based on OPP. The framework of this method is
shown in Fig.1. Firstly, we establish the process objective for each process, since
different IT service support processes have different objectives. According to the
objectives established, we then analyze and model the current processes in the
organization, using an IT service support process BPDM-extension meta-model.
Based on the process model, we design and determine metrics to measure process
performance and qualities. Next, we collect data from the case organizations for each
IT service support process, and evaluate process performance and qualities according
to the metrics defined previously. Finally, a prediction model will be used to predict
the performance and qualities of the processes, but this step is not the focus of this
paper and will be explored in the future.
Two large scale case organizations, Bank of China and Nokia Co., are selected.
Both organizations adopt IT service management processes to manage their IT system,
but it is in our opinion that there is much potential for improvements to be made to the
maturity of their current IT service management processes.
The methods used to collect data include: Direct collection (DC, participation in
support teams and first-hand experience with the daily operation of processes),
Interview (IN, meetings and discussions with different roles), Questionnaire (QU,
questionnaires sent to stakeholders), Access to tools databases (AT, exporting records
from tools and consulting related documents) and Periodic summarization (PS,
collection of periodic summarizations which report some indicators related to
performance or qualities).
3 Research Results
This section presents our main research results of the case organizations involved in
this study. We identify the strengths of the IT service support processes of the case
organizations and present our exploration into the research questions in Section 2.
3.1 Strengths of the IT Service Support Processes
Though the IT service support processes in the case organizations are far from
mature, both organizations possess strengths in certain processes to facilitate the
exploration in this study. The first strength is that the roles and responsibilities of IT
service support processes are clearly documented in the two case organizations. The
second strength is that Service Level Agreement (SLA) in Nokia Co. is explicitly
30

defined in a document called Service Level Definitions, which provides another way
to judge the performance. The third strength is that tools have been adopted in the
organizations to support IT service management, recording detailed data that makes
the analysis easier. The fourth is that the process managers produce periodic
summarization of the performance of each process, which helps to understand and
analyze performance data. Finally, the commitment shown by high level managers is
a strong impetus to improve the process performance and qualities.
3.2 Exploration to the Research Questions
Q1: Process Modeling and Metric Determination. In many organizations, the
objectives of IT service support processes are established by high level managers,
which may neglect the operational realities of processes. To counter this, information
was collected from all stakeholders to establish process objectives which were more
suitable for the case organizations as a whole.
Two types of objectives were identified through interview and questionnaires to
the stakeholders in the case organizations: one being the common objective, and the
other being the process-specified objective. The objectives we summarized are
compatible with ITIL concepts.
Based on the process objectives, we analyzed the IT service support processes in
case organizations and ITIL standards, and then should describe the processes
properly. Because of limited space, we take incident management process modeling
as an example. Fig. 2 shows the process model of incident management in BoC using
BPDM-extension meta-model. In the BPDM-extension meta-model, we extend
BPDM to better reflect the characteristics of IT service support process from three
aspects: activity, resource, and interaction. To generalize the model and to support the
IT service support process model integration, exchange and reuse with other business
processes, we adopt this metamodel. The model in Fig. 2 consists of activities of
incident management process. The most important resource in incident management
process is IR (Incident Record). There are two levels of support groups in the case
organization: the first level being the service desk response for Service Request, and
the second level being the incident support team responsible for Onsite Incident
Solving. Columns indicate the roles in charge of the respective activities: the left
column lists the activities under the purview of a service desk worker, and the right
column includes the activities under the incident support team’s charge.
To define accurate metrics, we first analyzed the models to differentiate trivial
activities and key activities, the former describing activities which have a limited
impact while the latter indicating activities with a significant effect on the
performance and quality of the entire process respectively. We have highlighted the
trivial and key activities of Fig. 2.
Trivial activities included: create IR, record service request information, record
incident solution information, close; key activities included: classify and prioritize,
service request branch, assign, accept, reassign branch, solve correctly branch.
31
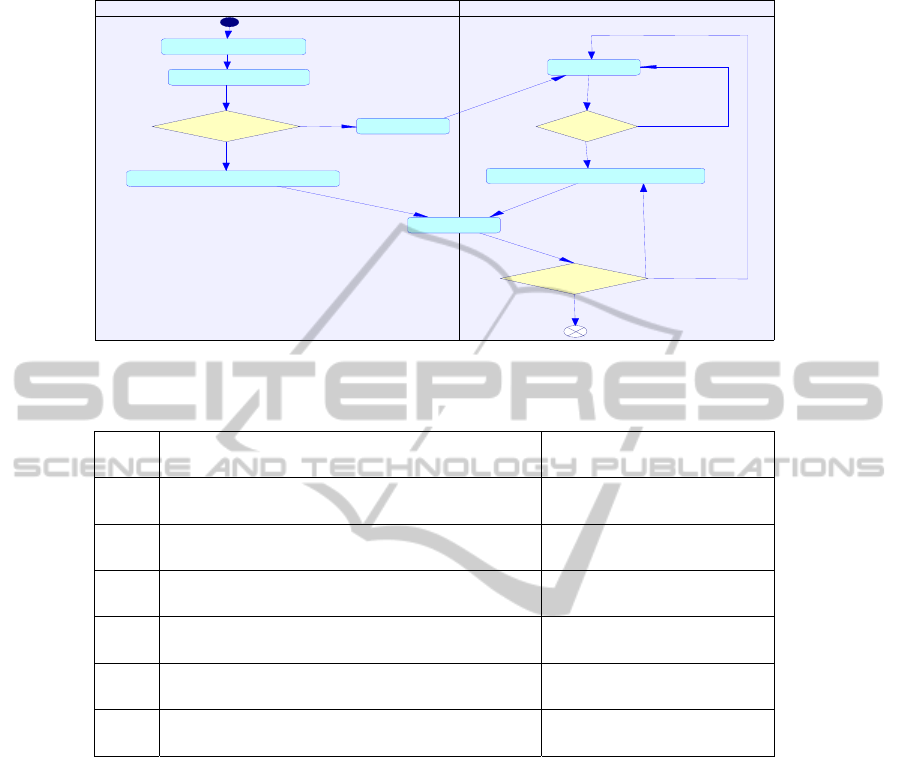
Fig. 2. Incident management process model.
Table 1. Metrics derived from key activities.
Metrics Meaning Derivation activity
M0 the ratio of correct preliminary classification of incidents classify and prioritize
M1 Mean solution time by priorities classify and prioritize
M2 the ratio of service request service request branch
M3 the ratio of solved incidents by one assignment assign &accept &reassign branch
M4 mean times of assignment/reassignment of incidents assign &accept &reassign branch
M5 the ratio of reopen closed incidents solve correctly branch
Our exploration focuses on key activities, since trivial activities are not important
to measure the process performance. According to the key activities and the incident
process objectives we summarized, we define metrics to elaborate the measure
system. Table 1 lists the metrics we defined according to corresponding key activities
to measure performance and qualities.
Q2: Evaluation and Improvement. We obtained process related data against the
metrics defined previously. Resources [11] records of IT service support processes
were collected from tool databases, including: Service Request Record, Incident
Record, Problem Record, Request for Change(RFC), Configuration Item(CI).
Furthermore, we also collected mail summaries and meeting reports which reported
on data relevant to performance or qualities.
Using the previous example, incident management process in BoC, we
demonstrate how to analyze data in our research. We retrieved 6962 Incident Records
service desk incident support team
[yes]
[yes]
[yes]
[no]
[no]
[no, reassign]
[no, slove again]
record service request information
service request?
create incident record
classify and prioritize
sol ve correctl y?
clo se
accept
reassign?
record incident solutioninformation
assign
32

and 13670 Service Request Records spanning January 1, 2010 to October 31, 2010
from the incident management database, and obtained parts of the mail summaries
and some meeting reports since January 1, 2010. We discarded records which had
obvious errors. Table 2 shows values of the key activity metrics of the incident
management process in the case organization.
After getting values for the key activities metrics, we adopted two methods to
determine whether the performance of corresponding key activities is good or not:
Service Level Agreement (SLA) and Process Performance Baseline (PPB). We get
PPB in the both case organizations from the summarizations of the processes
performance for last two years. SLA, which is already documented, is a part of
a service contract. Since some metrics are not defined in SLA or PPB, we combine
the two methods to determine the qualities and performance of processes.
We compared the results in Table 2 to definitions in SLA and PPB, and we
concluded that the qualities and performance of incident management process in BoC
was desirable since all values of these metrics were in the range of SLA or PPB.
However, metric M4, which indicates times of assignment/reassignment of incidents,
in Nokia was not desirable because it did not meet the PPB standard value of 1.2. The
excessive value in this metric implies that the capability of service desk or incident
support team is not ideal.
Through the analysis of key activity metrics we could determine the bottlenecks of
IT service support processes, because the metrics is related to particular activities.
The abnormal values of metrics would make it easy to identify the presence of
bottlenecks. The manager of processes should then take the abnormality into account
and take actions to eliminate the bottlenecks thus improving the whole process
performance and qualities.
We explored one reason why BoC outperforms NC when it comes to IT service
support processes. After comparing the details of IT service processes and IT
departments in these two organizations, a possible reason identified was that the IT
service requirements in NC were more diverse and sophisticated than BoC.
Table 2. Values of key activity metrics of incident management process in case organizations.
Metrics Value in BoC Value in Nokia
M0 93.90% 88.50%
M1
priority 1: 338.9 (min)
priority 2: 80.1 (min)
priority 3: 286.8 (min)
priority 4: 164.75 (min)
priority 5: 78.23 (min)
priority 1: 1313.9 (min)
priority 2: 932.3 (min)
priority 3: 464.3 (min)
priority 4: 203.5 (min)
M2 66.30% 55.00%
M3 93.50% 81.30%
M4 1.16 1.31
M5 0.52% 0.91%
33

4 Discussion and Conclusions
This paper describes the results of a case study focusing on improving IT service
support processes in two case organizations. In this study, we continued our previous
work – a BPDM-based IT service support process metamodel – and adopted an
OPP-based approach to measure and improve performance and qualities of IT service
support processes. The results and procedure of the measurement and improvement of
IT service support processes in case organizations and the exploration of the research
questions are presented.
Measuring and improving IT service support processes was a more difficult task
than previously expected, and some limitations are present in this case study. Some of
metrics appeared neither in PPB nor in SLA. We compared the value of the key
activity metrics to PPB or SLA, but we could not find the revelant data in both PPB
and SLA for some metrics. Another limitation is the lack of high qulity data.
We regard this study as the first step towards a more comprehensive quantitative
measurement and improvement approach. In the future, we will focus on the research
of performance prediction model to propose a elegant model.
Acknowledgements
This research is supported by the Opening Project of Shanghai Key Lab of Advanced
Manufacturing Environment (No. KF200902), and the Opening Project of Key
Laboratory of High Confidence Software Technologies (No. HCST201001).
References
1. Moura, A., Sauve, J., Bartolini, C.: Business-Driven IT Management - Upping the Ante of
IT: Exploring the Linkage between IT and Business to Improve Both IT and Business
Results. IEEE Communications Magazine, Vol. 46, Iss. 10 (2008).
2. Office of Government Commerce (OGC): IT Infrastructure Library. The Stationary Office,
UK (2000).
3. Office of Government Commerce (OGC): ITIL Core Books, The Stationary Office, UK
(2007).
4. International Organization for Standardization: “ISO/IEC 20000-1” & “ISO/IEC 20000-2”
(2005).
5. CMMI product team: CMMI® for Service, Version 1.3. Pittsburgh, PA, Carnegie Mellon
Software Engineering Institute (2010).
6. Marko Jantti, Kari Kinnunen: Improving the Software Problem Management Process: A
Case Study. European Software Process Improvement Conference, LNCS 4257 (2006)
40-49.
7. Liang Ping, Li Jianyang: A Change-Oriented Conceptual Framework Of Software
Configuration Management. International Conference on Service Systems and Service
Management (2007) 1-4.
8. Bartolini, C., Stefanelli, C., Tortonesi, M.: SYMIAN: Analysis and Performance
Improvement of the IT Incident Management Process. IEEE Transactions on Network and
Service Management, Vol. 7, Iss. 3 (2010) 132-144.
34

9. Qing Wang, Mingshu Li: Measuring and Improving Software Process in China.
International Symposium on Empirical Software Engineering (2005) 183-192.
10. Beijun Shen, Dehua Ju: On the Measurement of Agility in Software Process. International
Conference on Software Process, LNCS 4470 (2007) 25-36.
11. Beijun Shen, Xin Huang, Kai Zhou, Wenwei Tang: Engineering Adaptive IT Service
Support Processes Using Meta-modeling Technologies. International conference on
software process, LNCS 6195 (2010) 200-210.
12. CMMI product team: CMMI® for Development, Version 1.3. Pittsburgh, PA, Carnegie
Mellon Software Engineering Institute (2010).
35
