
EFFICIENT INDEXING OF LINES WITH THE MQR-TREE
Marc Moreau and Wendy Osborn
Department of Mathematics and Computer Science, University of Lethbridge
4401 University Drive West, Lethbridge, Alberta, Canada
Keywords:
Spatial access methods, Lines.
Abstract:
This paper presents an evaluation of the mqr-tree for indexing a database of line data. Many spatial access
methods have been proposed for handling either point or region data, with the vast majority able to handle
these data types efficiently. However, line segment data presents challenges for most spatial access methods.
Recent work on the mqr-tree showed much potential for efficiently indexing line data. We identify limitations
of the data sets in the initial evaluation. Then, we further evaluate the ability of the mqr-tree to efficiently
index line sets with different organizations that address the limitations of the initial test. A comparison versus
the R-tree shows that the mqr-tree achieves significantly lower overlap and overcoverage, which makes the
mqr-tree a significant candidate for indexing line and line-segment data.
1 INTRODUCTION
Many applications exist that store and manipulate
spatial data such as objects, points and lines. A spatial
database (Samet, 1990; Shekhar and Chawla, 2003;
Rigaux et al., 2001) contains a large collection of
objects that are located in multidimensional space.
For example, the Geological Survey of Canada main-
tains a repository of spatial data for many geoscience
applications (Geological Survey of Canada, 2006),
while the Protein Data Bank (Research Collaboratory
For Structural Bioinformatics, 2004) contains many
three-dimensional protein structures. An important
issue in spatial data management is to efficiently re-
trieve objects based on their location by using a spatial
access method (i.e., spatial index).
Many spatial access methods have been proposed
in the literature (see (Gaede and G
¨
unther, 1998;
Rigaux et al., 2001; Shekhar and Chawla, 2003) for
comprehensive surveys). Most spatial access meth-
ods that have been proposed handle objects of arbi-
trary shape by utilizing a minimum bounding rectan-
gle that estimates the extent of the object in all its di-
mensions. This works well for point data (a minimum
bounding rectangle of zero area) and for most arbi-
trarily shaped objects. However, minimum bounding
rectangles do not work well when representing lines
or line segments. The problem is that a significant
amount of whitespace is indexed because a potentially
large minimum bounding rectangle is representing a
small amount of data (Lin, 2008a; Lin, 2008b). This
is depicted in Figure 1.
Figure 1: The MBR representation of a Line.
Over many lines, this problem results in signifi-
cant overcoverage of whitespace and overlap of cov-
ered regions in space. One potential solution to
this is to represent an n-dimensional line as a 2n-
dimensional point. Although this would reduce over-
coverage, the spatial locality of the line and its spatial
relationship to other lines would be lost. Therefore
another solution needs to be found.
A recently proposed spatial access method, the
mqr-tree (Moreau and Osborn, 2008; Moreau et al.,
2009), focuses on minimizing overcoverage and over-
lap when indexing arbitrary objects. In addition to ef-
ficiently handling objects of non-zero area, the mqr-
314
Moreau M. and Osborn W..
EFFICIENT INDEXING OF LINES WITH THE MQR-TREE.
DOI: 10.5220/0003554403140319
In Proceedings of the 13th International Conference on Enterprise Information Systems (ICEIS-2011), pages 314-319
ISBN: 978-989-8425-53-9
Copyright
c
2011 SCITEPRESS (Science and Technology Publications, Lda.)
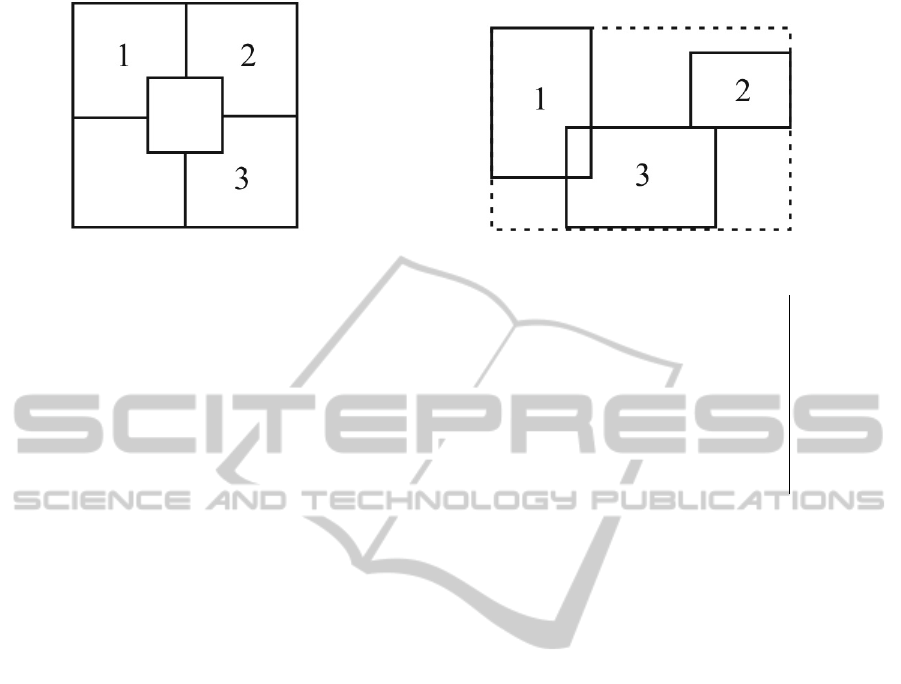
Figure 2: Node with Objects.
tree was show in an initial test to achieve signifi-
cant improvements in overlap and overcoverage over
a benchmark strategy when indexing line data. In ad-
dition, this initial test showed that very low overlap
when indexing line data was achievable.
Therefore, we investigate further the ability of the
mqr-tree to efficiently index line and line segment
data. We identify limitations of the data sets in the ini-
tial evaluation that seemed to lead to the significant re-
sults. Then, we further evaluate the ability of the mqr-
tree to efficiently index line sets of different arrange-
ments that address the limitations of the initial test. A
comparison versus a benchmark strategy shows that
the mqr-tree achieves significantly lower overlap and
overcoverage, which makes the mqr-tree a significant
candidate for indexing line and line-segment data.
2 BACKGROUND
In this section, we present some background on the
mqr-tree (Moreau and Osborn, 2008; Moreau et al.,
2009).
The relative placement of an object in the tree is
determined by using the centroid of its MBR. Figure
2 depicts the layout of the node. A node contains 5
locations. Each location can contain a pointer to ei-
ther another node or an object. A node must have at
least two locations that reference either an object or a
subtree, unless it is the root. The origin of the node
is the centre of the node. The centre is defined by the
centroid of the minimum bounding rectangle for the
node (called the node MBR). A node MBR is con-
tains all objects in the node, and any subtrees of the
node. As objects are added to and removed from the
node, the node MBR may change, and therefore the
centre of the node may change.
Figure 3 depicts the defined orientations, where A
refers to the centroid of a new object, and B refers to
the centre of the node. The orientations (NE, SE, SW,
NW) are defined to include centroids that fall on the
A
x
= B
x
A
x
> B
x
A
y
= B
y
A
y
> B
y
Placement
0 0 0 0 SW
0 0 1 0 SW
0 0 0 1 NW
1 0 0 1 NW
0 1 0 0 SE
1 0 0 0 SE
0 1 0 1 NE
0 1 1 0 NE
1 0 1 0 EQ
Figure 3: Relative orientation of A with respect to B.
axes (E, S, W, N, respectively). Also, an equals (EQ)
orientation is included, to handle two centroids that
overlap.
Figure 2 depicts a node containing three objects.
Object 1 is located northwest of the centroid of the
node MBR (defined by the dashed box on the dia-
gram), while object 2 is located northeast of the cen-
troid of the node MBR. Object 3 is located directly
south of the node MBR centroid, therefore it is placed
in the southeast quadrant.
3 EVALUATION
In this section, we present the results of our empiri-
cal evaluation of the mqr-tree. We compare the per-
formance of the mqr-tree insertion algorithm with the
R-tree insertion algorithm (Guttman, 1984), which is
considered a benchmark strategy for spatial indexing.
We first present the overall framework for evaluation
across all tests, and the evaluation criteria. This is fol-
lowed by the results of some initial tests on line seg-
ment data from road and railroad data sets that was
obtained from (Theodoridis, 2005). Then, we present
our strategy for further evaluation the mqr-tree as a
tool for efficiently indexing line data. We present our
generated data sets followed by the results of our eval-
uation on these data sets.
EFFICIENT INDEXING OF LINES WITH THE MQR-TREE
315

Table 1: Road and Railroad Data.
#lines index #nodes height coverage overcoverage overlap sp. util
mqr-tree 6735 12(9) 1294.95 541.89 2.20 49.87
10,060(MXrrline)
R-tree 3628 6 8834.97 4081.43 3541.75 74.94
mqr-tree 7755 14(9) 248.10 94.13 1.01 49.35
11,381(CArrline)
R-tree 4061 6 9343.56 4441.01 4347.91 75.57
mqr-tree 14118 14(9) 352.01 97.20 4.19 50.93
21,831(CArdline)
R-tree 7806 7 21061.17 9588.49 9495.51 75.38
mqr-tree 23108 14(10) 4324.47 1561.67 18.18 50.36
36,074(CDrrline)
R-tree 12579 7 35258.29 15548.15 14004.79 75.10
mqr-tree 58849 14(10) 2038.99 553.05 16.87 51.40
92,392(MXrdline)
R-tree 32871 8 93818.31 41733.99 41197.96 75.97
mqr-tree 76998 16(11) 9500.39 2925.65 59.95 51.54
121,416(CDrdline)
R-tree 43435 8 133102.54 55875.50 53009.99 75.20
3.1 Tests and Evaluation Criteria
For each data set, we create 100 trees using each al-
gorithm. Each tree was built using randomly ordered
data. The number of nodes, height (both worst-case
and average-case), average space utilization in each
node, total coverage of all minimum bounding rectan-
gles, total overcoverage (i.e., whitespace) of all min-
imum bounding rectangles, and the total overlap be-
tween all minimum bounding rectangles was calcu-
lated for each tree. We discuss 4 of those performance
factors below:
• Average space utilization this is the average
number of minimum bounding rectangles per
node. Ideally, the higher the number of mini-
mum bounding rectangles per node, the lower the
number of nodes and height of the tree. Both the
minimum bounding rectangles encompassing line
segments and those encompassing other minimum
bounding rectangles are included in this calcula-
tion.
• Overcoverage - the amount of white space (i.e.,
area with no lines) that is contains in the minimum
bounding rectangles of a spatial access method.
Ideally, this value should be very low. A higher
overcoverage will result in searches along paths
that will lead to no lines.
• Overlap - the amount of space covered by two
or more minimum bounding rectangles. Overlap
should be zero or very low. Significant amounts of
overlap will cause searches to proceed down mul-
tiple paths of the tree that cover the same area.
This will also likely result in unnecessary search-
ing of space containing no lines.
• Height - The number of nodes from the root to
the leaf node on the longest path of the index.
The shorter the path, the shorter the search from
root to leaf. However, shorter paths may result
in trees with higher overlap and overcoverage.
Since the R-tree is balanced, all paths are the same
length and therefore the worst-case and average
case height will be the same. Since the mqr-tree
is not balanced, both the longest path and the av-
erage path length will be recorded. On all result
tables, this will be indicated by the length of the
longest path, followed by the average path length
in parentheses.
3.2 Initial Results on Road and
Railroad Data
Table 1 shows some initial results for the road and
railroad data. The most significant results from this
test is the significant improvement in overlap. In all
cases, the mqr-tree achieves a 99% improvement in
overlap over the R-tree. In addition, the mqr-tree
achieves an improvement of 85-93% in coverage and
of 86-95% in overcoverage. Although the mqr-tree
has a higher tree height than the R-tree, it is expected
that more efficient searching will be achieved due to
the lower coverage, overcoverage and overlap. In ad-
dition, the space utilization of the mqr-tree is lower
than that of the R-tree, it is still around 50%, which
is considered a minimum space utilization for tree-
based indices.
3.3 Initial Discussion
The results from the indexing of line segment data us-
ing the mqr-tree were very surprising. In particular,
almost zero overlap is achieved when the mqr-tree is
used to index the line segments. Further investigation
has revealed some possible cause for this. First, the
line segments representing roads are very small. Sec-
ond, the data sets tend to have many roads that are
ICEIS 2011 - 13th International Conference on Enterprise Information Systems
316

Table 2: Vertical and Horizontal Lines.
#lines index #nodes height coverage overcoverage overlap sp. util
mqr-tree 57 6(4) 34571.13 12653.28 1309.00 54.74
100
R-tree 39 3 40488.63 13807.45 2463.17 69.84
mqr-tree 293 8(5) 251619.56 67535.15 10782.32 54.06
500
R-tree 194 4 294575.02 85176.98 28424.15 70.73
mqr-tree 587 8(6) 544531.26 132311.38 24121.85 54.04
1,000
R-tree 393 4 692841.56 179163.89 70974.36 70.48
mqr-tree 2914 10(7) 3294526.16 655888.20 137649.08 54.31
5,000
R-tree 1963 6 4949100.35 1205484.20 687245.10 70.38
mqr-tree 5810 10(7) 7001261.27 1292190.54 272790.92 54.42
10,000
R-tree 3928 6 11279666.07 2815631.07 1796231.45 70.30
mqr-tree 28890 12(9) 41092930.57 6506622.52 1444385.16 54.61
50,000
R-tree 19617 7 85868673.52 19473033.51 14410796.21 70.51
mqr-tree 58068 14(9) 87417415.91 13027973.89 2915851.35 54.44
100,000
R-tree 39219 8 205702687.17 47676629.83 37564507.56 70.50
Table 3: Lines of Slope Between -∞ and ∞.
#lines index #nodes height coverage overcoverage overlap sp. util
mqr-tree 59 6(4) 40021.36 11006.88 2441.98 53.56
100
R-tree 39 3 47617.87 12800.31 4280.03 69.81
mqr-tree 289 8(5) 277018.50 56623.55 16207.52 54.53
500
R-tree 197 4 311150.03 70262.15 30377.82 70.18
mqr-tree 572 8(6) 580037.86 108356.88 33389.45 54.93
1,000
R-tree 391 4 776383.87 166387.47 92305.85 70.64
mqr-tree 2903 10(7) 3486989.73 537944.78 184403.61 54.44
5,000
R-tree 1961 6 5137856.52 1063871.31 717682.80 70.45
mqr-tree 5818 10(7) 7371817.91 1051413.82 363377.43 54.37
10,000
R-tree 3922 6 11436671.65 2472594.46 1800878.18 70.42
mqr-tree 28979 12(9) 42915843.65 5285883.19 1887563.59 54.51
50,000
R-tree 19615 7 89757562.40 18564483.16 15266092.75 70.44
mqr-tree 58083 12(9) 91056946.13 10614180.99 3835949.08 54.43
100,000
R-tree 39237 8 213156257.09 45368411.29 38807141.90 70.36
Table 4: Lines of Slope Between -2 and 2.
#lines index #nodes height coverage overcoverage overlap sp. util
mqr-tree 55 6(4) 38648.07 9522.76 2265.87 56.00
100
R-tree 38 3 43818.03 9755.68 2473.23 71.63
mqr-tree 284 8(5) 271315.60 50635.87 15181.68 55.14
500
R-tree 197 4 314879.74 68341.60 33133.60 69.92
mqr-tree 581 8(6) 586703.65 100469.17 34995.16 54.39
1,000
R-tree 394 4 772562.40 160297.46 96321.57 70.02
mqr-tree 2907 10(7) 3506656.31 492314.22 188213.63 54.39
5,000
R-tree 1958 6 5216373.80 1035264.79 741290.20 70.56
mqr-tree 5760 10(7) 7445892.12 978976.22 386760.41 54.72
10,000
R-tree 3920 6 11478278.50 2353996.93 1784494.27 70.55
mqr-tree 28909 12(9) 43421521.54 4935490.51 2017537.17 54.59
50,000
R-tree 19613 7 88260071.68 17518910.22 14743746.56 70.38
mqr-tree 57942 12(9) 91993440.97 9851272.75 4044739.59 54.52
100,000
R-tree 39201 8 206456490.77 42566148.58 37070996.81 70.62
EFFICIENT INDEXING OF LINES WITH THE MQR-TREE
317

predominantly horizontal or vertical (more or less).
This lead to the following questions - what would
happen if:
1. More diagonal line segments are indexed?
2. The line segments are longer?
We are interested to see if the above affect overlap,
overcoverage, and tree height.
3.4 Data Sets
For our follow-up evaluation, we generated collec-
tions of lines that vary in set size and slope. Each line
set contains between 100 and 100,000 lines. We use a
line length of 10 units in all cases. We chose to gener-
ate our own line sets for the follow-up evaluation be-
cause this would allow us to generate data that reflects
the best-case, average-case and worst-case scenarios,
and determine according how the mqr-tree will per-
form for each scenario.
For slope, we test both vertical and horizontal
lines, as well as diagonal lines.
We create three types of files:
• half horizontal, half vertical lines. This is consid-
ered to be the best-case scenario. Every line in
this set will have a minimum bounding rectangle
with an overcoverage of zero. Overcoverage will
still exist in higher-level minimum bounding rect-
angles that encompass the lines.
• equal distribution between horizontal,vertical,
slope of 1/2, slope of 1, slope of 2, slope of -1/2,
slope of -1 and slope of -2. This is considered the
average case. Here we have both lines that can
be contained with a minimum bounding rectangle
with zero overcoverage, lines that will achieve the
worst overcoverage when contained with a mini-
mum bounding rectangle.
• equal distribution between slope of 1/2, slope of
1, slope of 2, slope of -1/2, slope of -1 and slope
of -2. This is considered to be the worst case.
Here, all minimum bounding rectangles that con-
tain lines are all of non-zero overlap.
Using these data sets, we run the same tests as
above for the road and railroad data.
3.5 Evaluation on Vertical and
Horizontal Data Sets
Our first evaluation was to compare the mqr-tree with
the R-tree on indexing the horizontal and vertical line
sets. This is expected to produce the best results since
at the leaf level, the overcoverage of minimum bound-
ing rectangles will be zero and the overlap will be
very low (effectively, the only overlap are the inter-
section points between two lines).
Table 2 presents the results for the horizontal and
vertical line sets. Again, we find the most significant
result to be in the improvement in overlap. The mqr-
tree achieves lower overlap in all cases. Although
the improvement amounts are not as high as with the
road and railroad data, they are still significant, es-
pecially in the data sets with the higher number of
line segments. Overall, we find in the smaller sets an
improvement of approximately 45-50% lower overlap
over the R-tree, while in the larger sets the improve-
ment is as high as 92%. We also find the same trends
for coverage and overcoverage, with improvements
that increase from 3% to 58% for coverage and from
9% to 73% for overcoverage. The height, although
still high in the mqr-tree, is comparable to those ob-
tained in the initial road and railroad data tests.
3.6 Evaluation on Uniform Data Sets
Our next evaluation is to compare the mqr-tree and R-
tree using the uniform data sets, where in each there
are an equal number of vertical and horizontal lines,
and lines of varying slope. Table 3 presents this re-
sults. We find results that are very similar to those
for the horizontal and vertical line sets. We find that
the mqr-tree achieves an improvement in overlap that
ranges from 43% for the smaller data sets to 90% for
the largest one. Similarly, we find improvements in
coverage that fall between 3% and 57%, and for over-
coverage that fall between 14% and 77%. This is
very reassuring because it appears that diagonal lines
(which in this case, make up 3/4ths of each data set)
do not significantly affect the performance criteria.
3.7 Evaluation on Sloped Lines Only
Our last test is to compare the performance of the
mqr-tree and R-tree on data sets containing only
sloped lines, and no horizontal or vertical lines. This
is considered to be our worse-case scenario because at
the leaf level, all minimum bounding rectangles will
have significant overcoverage. However, we still find
in Table 4 that for the most part the performance im-
provements of the mqr-tree over the R-tree are as sig-
nificant as those found in the other evaluations. The
only improvement that is not as significant is in the
overlap decrease for the smallest test set. However,
the mqr-tree still achieves lower overlap in this case.
ICEIS 2011 - 13th International Conference on Enterprise Information Systems
318

4 CONCLUSIONS AND FUTURE
WORK
In this paper, we present our investigation into the in-
dexing of line and line-segment data using the mqr-
tree, based on initial results that showed its potential
for efficiently indexing such data. Our experiments
showed that the mqr-tree outperforms the R-tree for
indexing line data by achieving significantly lower
overlap, coverage and overcoverage.
Future work includes the following. First, the
mqr-tree was evaluated for coverage, overcoverage
and overlap via multiple insertions. It is equally im-
portant to determine if significant reductions in these
performance criteria are still possible after updates
and deletions are performed. Second, the mqr-tree
needs to be evaluated for its ability to be utilized
for region and exact-match searches in the presence
of line data. This would also be compared with the
searching ability of the R-tree and other benchmark
strategies. Third, although we compared the mqr-tree
with the R-tree, its performance also needs to be com-
pared with other proposed strategies, such as (Hoel
and Samet, 1991; Lin, 2008a; Lin, 2008b). Finally,
our most important goal is to both decrease the height
and increase the node size (i.e., node capacity) of the
mqr-tree without sacrificing its improvement in over-
coverage and overlap.
REFERENCES
Gaede, V. and G
¨
unther, O. (1998). Multidimensional access
methods. ACM Computing Surveys, 30:170–231.
Geological Survey of Canada (2006). Geoscience Data
Repository, http://gdr.nrcan.gc.ca/index e.php. (vis-
ited March 2006).
Guttman, A. (1984). R-trees: a dynamic index structure
for spatial searching. In Proceedings of the ACM
SIGMOD International Conference on Management
of Data, pages 47–57.
Hoel, E. and Samet, H. (1991). Efficient processing of spa-
tial queries in line segment databases. In Proceedings
of the Second International Symposium on Advances
in Spatial Databases (SSD ’91).
Lin, H.-Y. (2008a). Efficient and compact indexing struc-
ture for processing of spatial queries in line-based
databases. Data and Knowledge Engineering, 64(1).
Lin, H.-Y. (2008b). Using b+-trees for processing of line
segments in large spatial databases. Journal of Intelli-
gent Information Systems, 31(1).
Moreau, M. and Osborn, W. (2008). Revisiting 2DR-tree
insertion. In Proceedings of the 2008 Canadian Con-
ference on Computer Science and Software Engineer-
ing.
Moreau, M., Osborn, W., and Anderson, B. (2009). The
mqr-tree: Improving upon a 2-dimensional spatial ac-
cess method. In Proceedings of the 4th IEEE Inter-
national Conference on Digital Information Manage-
ment (ICDIM 2009).
Research Collaboratory For Structural Bioinformatics
(2004). Protein data bank, http://www.rcsb.org/pdb.
(visited May 2004).
Rigaux, P., Scholl, M., and Voisard, A. (2001). Spa-
tial databases: with application to GIS. Morgan-
Kauffman.
Samet, H. (1990). The design and analysis of spatial data
structures. Addison-Wesley.
Shekhar, S. and Chawla, S. (2003). Spatial databases: a
tour. Prentice Hall.
Theodoridis, Y. (2005). R-tree Portal, http://www.rtreeport
al.org/. (visited March 2008).
EFFICIENT INDEXING OF LINES WITH THE MQR-TREE
319
