
MUTUAL INTERDEPENDENCE OF STOCK MARKETS
BASED ON SUPPORT VECTOR MACHINE
Minghao Zhu and Jie Li
School of Economics and Management, Beijing Jiaotong University, Beijing, China
Keywords: Stock index, Mutual prediction, Nonlinear dependence, Support Vector Machine.
Abstract: China's market economy continues to advance, which makes the transparency of information of stock
market increasing, the information between the stock market flows faster, a variety of interactions between
the stocks increasingly significant. In this paper, support vector machine method is used to study the stock
market in the nonlinear discontinuous time series, through the establishment of different support vector
machine model, respectively to predict for the Shanghai A shares index, the Shenzhen A share index, the
Shanghai B share index and Shenzhen B share index, analyze their absolute error and relative error, it was
found there is a strong nonlinear interdependence in the same stock market and a strong dependence of
different securities markets, the Shanghai index has a larger effect compare to the Shenzhen index slightly.
1 INTRODUCTION
By studying the interaction between the predictive
ability of stock to analyze the interdependence of the
stock market, stock prediction is the use of mutual
support vector machines for the training data using
different indexes to predict changes in other stock
indices open space and trends, through analysis the
error between models to study the predicted
relationship between stock index, which can analyze
the dependence between the stock market, mainly to
describe the mutual coordination of the stock index
between the various elements of the situation is good
or bad, to measure the phase transition
characteristics and laws between the two indexes.
According to the basic principles of coordination
theory, the coordination degree determines which
sequence and structure the system will reach when it
comes to a critical region or the trend from
disorderly to orderly.
The main methods of researches between stocks
are stock co-integration (Daimin, 2002; Yu et al.,
2004; Guang and Yang, 2010; Xiyu and Yufang,
2004) and prediction
(Pi-e and Yanhua, 2000; Ping
et al., 2003; Xing et al., 2001; Yuchuan and
Zuoquan, 2007). Co-integration analysis is used to
study relationship and co-integration of the stock
index, futures, options, mutual stock fluctuations and
so on, by the methods of ADF, Johansen, Granger
Test, but all of these methods cannot describe the
nonlinear characteristics. There is a lot of studying
on a short-term or long-term prediction of a stock
index, but less about mutual prediction. Support
Vector Machine (SVM) theory is based on statistical
learning theory, and the approximately realize of the
minimization structural risk, the effective prediction
of stock index by the method of SVM regression
prediction gives powerful message about the overall
change in the stock market, which makes sense for
index prediction. The mutual authentication and
prediction of different stock index as the training
data gives us a new method to understand the
relevance and synergy of securities market change.
China's stock market is still in "weak efficient
market", which is not a simple linear and orderly
market; it is the financial market with complex
nonlinear characteristics. Not only investors is
irrationality with overreaction occurs or lack of
reflect, but also the market is often unstable. With
the internal features of nonlinear, discontinuous, the
time-series of the stock market and SVM methods
have similar characteristics. The paper establishes
SVM neural network model, with the Shanghai A
Share Index and Shenzhen A Share Index as the
training data, then it analyzes other indexes
(including the Shanghai A Shares Index and
Shenzhen A Shares Index) for regression predict. By
analyzing the predicted results and the forecast error,
we study the correlation and collaboration between
218
Zhu M. and Li J..
MUTUAL INTERDEPENDENCE OF STOCK MARKETS BASED ON SUPPORT VECTOR MACHINE.
DOI: 10.5220/0003552702180221
In Proceedings of the 13th International Conference on Enterprise Information Systems (ICEIS-2011), pages 218-221
ISBN: 978-989-8425-54-6
Copyright
c
2011 SCITEPRESS (Science and Technology Publications, Lda.)
different indexes.
2 MANUSCRIPT PREPARATION
2.1 Basic Principles
Support Vector Machine (Cortes and Vapnik, 1995)
which is proposed by Vapnik firstly, establishes a
separating hyper plane as a decision surface to
maximize interval edge between the positive cases
and the counter cases, , its learning strategy is a
structural risk minimization principle (minimize the
expected risk, and also minimize the empirical risk
and confidence interval). Practical issues will be
converted by a nonlinear transformation to high-
dimensional feature space; in the high-dimensional
space it constructs linear decision function to realize
the nonlinear decision function of the original
spaces. The key of SVM learning algorithm is the
concept of inner product kernel between the support
vector x (i) and the input control vector x. SVM is
composed with small subset which is extracted from
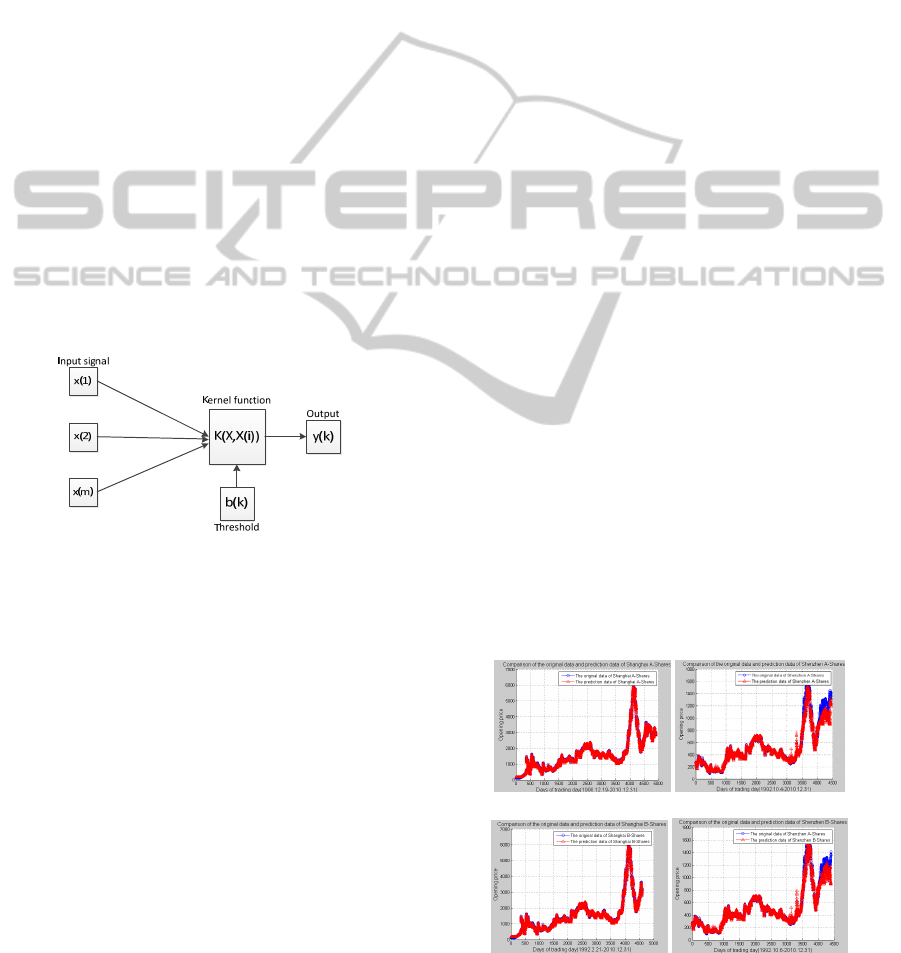
the training data by the algorithm. SVM neural
network system is shown in Figure 1.
Figure1: SVM neural network system.
The method of Kernel Function avoids the
specific form of nonlinear mapping, so that the field
of linear learning achievements can be naturally
extended to non-linear learning areas, with the
kernel function instead of the linear term of linear
equations, it can make the original linear algorithm
"nonlinear", which can do linear regression. The
class of Kernel Function mainly includes linear
kernel, polynomial kernel function, radial basis
function and the two-sensor kernel function.
2.2 First Section
(1) Data selection: Select the opening index, the
closing index, total volume, total turnover, the
highest index, the lowest index of a stock index
trading day (as the penultimate trading day) as
independent variables, and the opening index of the
corresponding trading day ( from the second date) as
the dependent variable.
(2) Data normalization: Using the mapminmax
function of Matlab, it normalizes, of the independent
variables and dependent variable respectively.
(3) Parameters selection: it optimizes the penalty
parameters c and kernel function parameters g of
SVM by genetic algorithm.
(4) Training and prediction: it uses the best
parameters c and g to train SVM model, and uses
different index to do regression prediction for
studying the regression results and errors.
3 EMPIRICAL STUDY
In this paper, the research object includes the
Shanghai A Share Index from December 19, 1990 to
December 31, 2010, the Shenzhen A Share Index
from October 4, 1992 to December 31, 2010, the
Shanghai B Share Index from February 21, 1992 to
December 31, and the Shenzhen B Share Index from
October 6, 1992 to December 31, 2010, it remove
unreasonable data and select the opening index, the
closing index, total volume, total turnover, the
highest index, the lowest index as major indicators,
it uses different stock index as the training data to
study the mutual predictability and interoperability
of them.
3.1 Mutual Predictability of the
Shanghai A Share Index and Other
Share Indexes
The Shanghai A share index is the training data in
model 1, it respectively predicts the Shanghai A
share index, Shenzhen A share index, Shanghai B
share index, Shenzhen B share index, it comes to
c = 67.6781, g = 25.5882 through training.
(1) (2)
(3) (4)
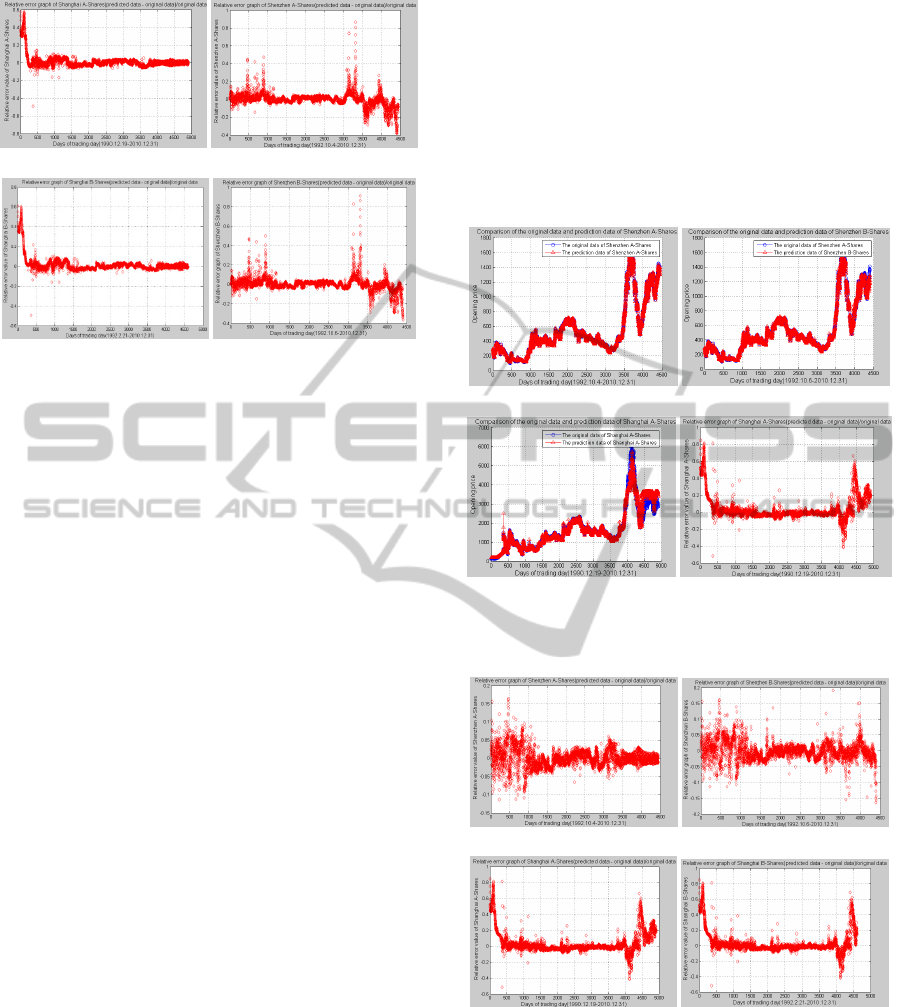
Figure 2: Comparisons of the original data and prediction
data in Model 1.
MUTUAL INTERDEPENDENCE OF STOCK MARKETS BASED ON SUPPORT VECTOR MACHINE
219
(1) (2)
(3) (4)
Figure 3: Relative error in Model 1.
For each share index, it use Shanghai A share
index SVM neural network forecasting model to
predict. Figure 2 shows the results of the regression
prediction and the original data of the Shanghai A
share index, Shenzhen A share index, Shanghai B
share index, Shenzhen B share index, Figure 3
shows the relative error of each index, it can be seen
that Shanghai A share index has the mean square
error of 3.0629e-005, the correlation coefficient of
99.898%; Shenzhen A share index has the mean
square error of 0.00142668, the correlation
coefficient of 97.9941%; Shanghai B share index
has the mean square error of 3.13279e-005
correlation coefficient of 99.8898%; Shenzhen B
share index has the mean square error of
0.000907803, the correlation coefficient of
98.4753% by calculating. It shows that the
predictability between Shanghai A share index and
B share index is strong, investors in Shanghai Stock
Exchange have the same expectations between A
share and B share, they have strong nonlinear
interdependence. The Shanghai A share index,
Shenzhen A share index and Shenzhen B share
index also can mutual predict with a certain degree
of interdependence, but week than The Shanghai A
share index and The Shanghai B share index. The
degree of interdependence between Shenzhen Stock
Exchange and Shanghai Stock Exchange is
relatively low, investors always focused on a
particular stock investment in the same exchange
market; it has poor coordination between different
markets.
3.2 Mutual Predictability of the
Shenzhen A Share Index and Other
Share Indexes
The Shenzhen A share index is the training data in
model 2, it respectively predicts the Shenzhen A
share index, Shenzhen B share index, Shanghai A
share index, Shanghai B share index , it comes to
c = 2.48966, g = 75.2551 through training.
(1) (2)
(3) (4)
Figure 4: Comparisons of the original data and prediction
data in Model 2.
(1) (2)
(3) (4)
Figure 5: Relative error in Model 2.
For each share index, it use Shenzhen A share
index SVM neural network forecasting model to
predict. Figure 4 shows the results of the regression
prediction and the original data of the Shenzhen A
share index, Shenzhen B share index, Shanghai A
share index, Shanghai B share index. Figure 5 shows
the relative error of each index, it can be seen that
ICEIS 2011 - 13th International Conference on Enterprise Information Systems
220

Shenzhen A share index has the mean square error
of 2.82236e-005, the correlation coefficient of
99.9429%; Shenzhen B share index has the mean
square error of 1.42277 e-004, the correlation
coefficient of 99.7345%; Shanghai A share index
has the mean square error of 0.00186936, the
correlation coefficient of 93.9273%; Shanghai B
share index has the mean square error of 0.00173146
correlation coefficient of 93.9391% by calculating.
It shows that the Shenzhen A share index and
Shenzhen B share index have strong mutual
predictability, it has a strong nonlinear
interdependence, but less than index in the Shanghai
Stock Exchange, the Shenzhen B share index is
more affected by Shenzhen A share index. Mutual
prediction between the Shanghai A share index
Shenzhen A shares and B share index is week than
indexes in the same stock market, but they also have
some interdependence, the results of the previous
model is verified by model 2, consistent with the
actual situation.
4 CONCLUSIONS
With the gradual development of socialist market
economy, investors gradually obtain a reasonable
expectation by historical data and portfolio analysis,
so that investment is increasingly rational, and any
changes in a stock market information will affect
other securities market, cooperatively of stock
markets becomes the more and more stronger. In the
paper, it establishes two SVM neural network
regression prediction model to analyze mutual
predictability and cooperatively of Shanghai A
shares, Shanghai B shares, Shenzhen A shares and
Shenzhen B Share Index, we know that two indices
in a same stock exchange have a strong nonlinear
interdependence, the index of the various exchanges
also have a certain dependence, Shanghai Stock
Exchange affect Shenzhen Stock Exchange
relatively larger.
ACKNOWLEDGEMENTS
This paper was supported by “the Fundamental
Research Funds for the Central Universities
(2011YJS028)”.
REFERENCES
Shi Daimin. Research of Co-integration for the Stock
Index Fluctuation of Shanghai and Shenzhen Stock
Markets [J], Quantitative And Technical Economics,
2002, 19 (9) _3.
Wei-Bin Yu, Ying Fan, Yi-Ming Wei, etc. The co-
integration Analysis of the Brent Futures Market [J].
Application Of Statistics And Management, 2004, 23
(5) _7.
Qin Wei Guang, Rei-Cheng Yang. Study on Linkage
between Chinas Stock Market Index and Main Index
for International Stock Market: Based on Co-
integration Analysis [J]. Technology Economics, 2010,
29 (11).
Cheng Xiyu, Chen Yufang. Non-linear Co-integration
Analysis on Dowjones Index and Nasdaq Index [J].
Systems Engineering--Theory & Practice, 2004, 24
(7)_5.
Zheng Pi-e, Ma Yanhua. Rbf Neural Network-Based
Stocks Market Modeling And Forecasting [J]. Journal
Of Tianjin University, 2000, 33 (4) 4.
Chen Ping, Wang Chengzhen, Zhou Jun and so on.
Prediction and Analysis for the Index of Shanghai
Stock Exchange by SAS System on Monthly Data [J].
Systems Engineering-Theory & Practice, 2003, 23
(6)_7.
Chen Xing, Meng Weidong, Yan Taihua and so on.
Forecasting Stock Market Quotations via Fuzzy
Neural Network Based on TS Model [J]. Systems
Engineering - Theory & Practice, 2001, 21 (2)_7.
Zhang Yuchuan, Zhang Zuoquan. Application of Support
Vector Machines in Stock Price Predicting [J]. Journal
Of Beijing Jiaotong University, 2007, 31 (6)_4.
Corinna Cortes and V. Vapnik, "Support-Vector
Networks, Machine Learning, 20, 1995
MUTUAL INTERDEPENDENCE OF STOCK MARKETS BASED ON SUPPORT VECTOR MACHINE
221
