
PREDICTIVE MODEL OF RAIL CONSUMPTION FOR
BEIJING SUBWAY LINE 2
Lin-rong Pang, Yi-hong Ru
School of Economics
&
Management, Beijing Jiaotong University, Beijing 100044, China
Zi-kui Lin
School of Economics
&
Management, Beijing Jiaotong University, Beijing 100044, China
Keywords: Beijing Subway Line 2, Steel Rail Consumption, Fuzzy Time Series Prediction Model.
Abstract: This paper focus on the rare researched project, the consumption of subway steel rail based on quantitative
analysis; make a Fuzzy Time Series Prediction Model for the aggregate consumption of the steel rail
expended in subway. Set Beijing Subway Line.2 as a case object, make an analysis and give a prediction,
conclude the rule of steel rail consumption, the result provides a scientific basis for management of Beijing
subway steel rail maintenance.
1 INTRODUCTION
As the development of science and urbanization, the
effective rail transportation plays more and more
important roles in modem cities nowadays. The
transportation development history in western
countries shows us that the only way to better the
urban traffic fundamentally is to adopt urban track
transportation or so called mass transit (made up of
subway and light rail). Great traffic volume, fast,
safe, punctual, eco-friendly, energy saving, subway
release great pressure of urban traffic, accelerating
the city development as an essential part of mass
transit.
From domestic and international practice, as the
improvement of traffic volume and vehicles there
exist many problems that is exigent to be solved in
urban subway Operation. One of the most important
problem is how to manage the consumption of
materials in subway scientifically.Subway materials
consumption increase year by year, requires a large
amount of money on subway line maintenance. In
such a realistic condition, metro lines material costs
budget is becoming more and more important
2 REVIEWS
As the main bearing parts of urban rail transit, rail
bares the reciprocal action of train wheels directly.
The statues of the steel rail affect the whole urban
transit, and the relations between the two had been
studied for a long time. But most of the researches
are based on main line railway. Even though there
are many similarities between subway and main line
railway, there do exist some differences that can’t be
ignored. The main line railway is fast, low traffic
volume, heavy loaded while the subway run high
traffic volume, light loaded and mostly concentrated
on safety.
The last decade saw the start of studies on urban
rail transit; the studies endure a period that is
focused on main line railway. Starting with
quantitative analysis on steel rail consumption(Cao
Minghua, Chen Yonggui, 2008; Matsumoto K, Suda
Y, et al., 2006), several scholars are looking into the
cause of the consumption(YU Chunhua, 2007).
And some scholars turn to the area of the
management steel rail maintenance. It aims to lower
the consumption and cost, while the urban transit
runs smoothly. This project has been divided into
two levels, on one hand is to replace the badly
fatigue damaged steel rail, maintain the rail with oil
on time (Liu Canlong, 2008; Matsumoto K, Suda Y
489
Pang L., Ru Y. and Lin Z..
PREDICTIVE MODEL OF RAIL CONSUMPTION FOR BEIJING SUBWAY LINE 2.
DOI: 10.5220/0003550904890492
In Proceedings of the 13th International Conference on Enterprise Information Systems (ICEIS-2011), pages 489-492
ISBN: 978-989-8425-56-0
Copyright
c
2011 SCITEPRESS (Science and Technology Publications, Lda.)

et al., 2008
[
), one the other hand is to look into the
management skills (ZhouYu, XuYude, 2008;
Bozyslaw et al., 2003) ,technology and method (YU
Chunhua, 2007) adopted in rail maintenance.
We can draw a conclusion that, the current
domestic and overseas scholars are mainly focused
on two aspects: the causes of the rail consumption
and the maintenance of the rails and related
management work. Few have been tried to discuss it
based on quantitative analysis, which is of great
value from the materials management. Realized this
we will make a Fuzzy Time Series Prediction Model
for the aggregate consumption of the steel rail
expended in subway, Set Beijing Subway Line 2 as a
case object, make an analysis and give a prediction,
conclude the rule of steel rail consumption, and test
it in the end.
3 THE FORECAST OF RAIL
CONSUMPTION ON BEIJING
SUBWAY LINE 2
3.1 Fuzzy Time Series Prediction
Model
3.1.1 Source Data into the Fuzzy
Source data of the Steel rail consumption is a real
number set, x
1
, x
2
,…,x
T
. Use the set defined in A
fuzzy set, SV
1
, SV
2
,…,SV
T
, to restore the original
data’s uncertainty.
Preset: U
t
=max(x
t-1
,x
t
,x
t+1
), V
t
=min(x
t-1
,x
t
,x
t+1
),
t=2,3, … T-1, V
1
=min(x
1
,x
2
) , U
1
=max(x
1
,x
2
),
V
T
=min(x
T-1
,x
T
), U
T
=max(x
T-1
,x
T
).
Define SV
t
(x) as follow:
If x belongs to [V
t
,U
t
], then SV
t
(x)=1-∣x-a
t
∣/c
t
;
otherwise, SV
t
(x)=0, And c
t
=(U
t
-V
t
)/2, a
t
=(U
t
+V
t
)/2,
t=1,2,…,T.
3.1.2 The Order of the Fuzzy Time Series
According to the figure of the Steel rail consumption
scatterplot, it was observed that the curve of these
consumption numbers approximate to a linear
diagram or a conic diagram. So we could determine
that the function of the fuzzy time series is first
order or second order.
3.1.3 Fuzzy Coefficient
Define: p
i
is Triangular Fuzzy Number and p
i
` is p
i
’s
estimated value.
Then we determine (ß
i
,S
i
) With the fuzziness of
the tendency equation as small as possible. The
ambiguity S of the tendency equation is S=∑
i
k
w
i
S
i
,
including w
i
is S
i
’s weight. The ambiguity S can be
determined by linear regression method.
We can suppose that the linear regression
equation of the original sequence is like this:
SV
t
`=a
0
`+a
1
`*t+a
2
`*t
2
+…+a
k
`*t
k
(1)
And a
i
` is real number, for i=0,1,2,…,k.
Define: w
i
=∣a
i
`∣/∑∣a
i
`∣. The closeness between
SV
t
and SV
t
` can be expressed by h
t
, h
t
=(SV
t
, SV
t
`)
,t=1,2,3,…,T. suppose h
t
is not less than a given
number h
0
. So the question to make the ambiguity S
of the tendency equation minimum can be changed
into a linear programming problem as follows:
Min S=∑w
i
S
i
(2)
s.t. h
t
≥h
0
, t=0, 1, 2,…T
For SV
t
`=p
0
`+p
1
`*t+p
2
`*t
2
+…+p
k
`*t
k
, SV
t
` is the
triangular fuzzy number by (∑ß
i
t
i
,∑S
i
t
i
). So h
t
can
be expressed by:
h
t
=(SV
t
,SV
t
`)=1-∣a
t
-∑ß
i
t
i
∣/(c
t
+∑S
i
t
i
)
(3)
And if h
t
is not less than h
0
, the only way it can
happen is as follow:
∑ß
i
t
i
-(1-h
0
)∑S
i
t
i
≤ a
t
+c
t
(1-h
0
), t=1,2,3,…T
∑ß
i
t
i
-(1-h
0
)∑S
i
t
i
≥ a
t
-c
t
(1-h
0
), t=1,2,3,…T
S
i
≥0,i=0,1,2,…k
After these operations, we can get p
i
’s estimated
value p
i
`, for i=0, 1, 2, … , k, and the tendency
equation:
SV`(t)=p
0
`+p
1
`*t+p
2
`*t
2
+…+p
k
`*t
k
(4)
If t is bigger than T, the value of SV`(t) is a
Triangular Fuzzy Number too. When time changes,
the Equation graphic of SV`(t) is not only one curve
but also curve clusters with border curves f
1
(t) and
f
2
(t) and a central curve f
0
(t), for
f
1
(t)=ß(t)+S(t) (5)
f
2
(t)=ß(t)-S(t)
and
(6)
f
0
(t)=ß(t) (7)
3.1.4 Error Regulation
Using the tendency equation from above, we can get
a Series value x
t
` which can compare with the Actual
value x
t
and calculate the mean error ð by the
ICEIS 2011 - 13th International Conference on Enterprise Information Systems
490
function: ð= ∑ (x
i
-x
i
`)^2/n. based on the central
curve f
0
(t), it can be regulated to two forecast
curves:
g
1
(t)=ß(t)+ð (8)
g
2
(t)=ß(t)-ð (9)
3.2 Forecasting Results
Through the investigation into Beijing Subway
Group, we got a Series data of Rail Consumption
shown in the table 1.
Table 1: Rail Consumption (Unit: ton).
year Rail Consumption
2003 0.00
2004 23.44
2005 3.86
2006 7.73
2007 0.00
2008 78.30
2009 62.26
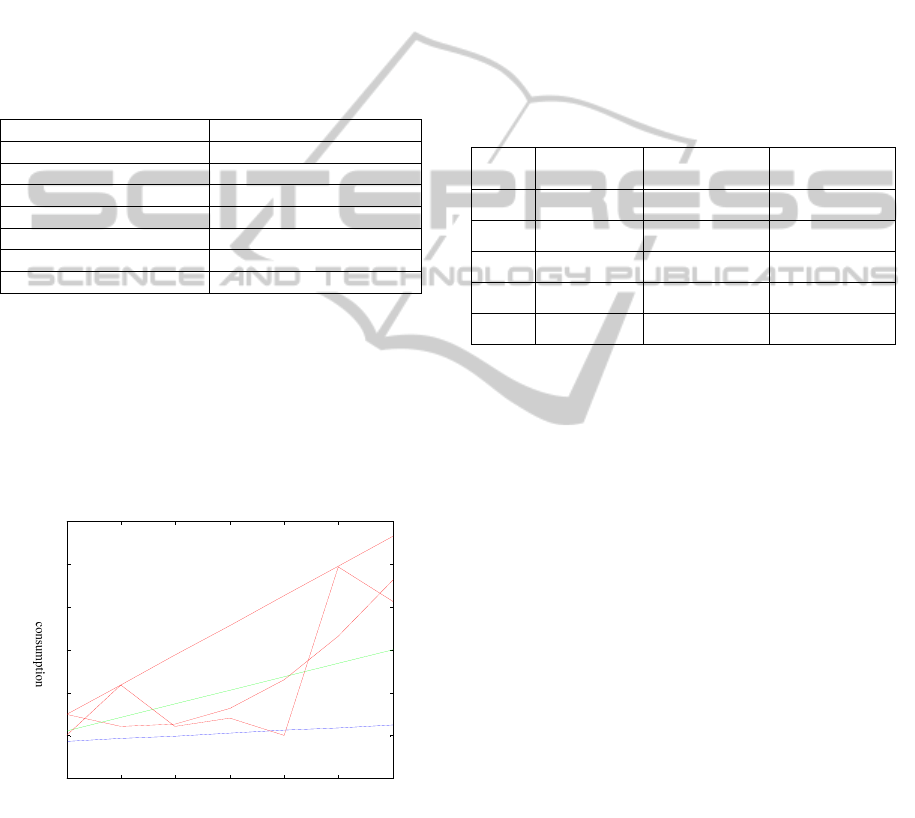
From consumption data curve, it was observed
that it presented upswing change tendency but not
around centre line fluctuating. For this kind of data,
we can use Fuzzy Time Series Prediction Model
predict its change.
In This paper, MATLAB has been used to
program for the proposed model. Finally got the
predicting curves shown as below:
Figure 1: 2003-2009’s Rail consumption fitting curve.
Functions of fitting curves are as follow:
The top curve: f
1
(t)= -4.2087+13.8521*t.
The central curve: f
0
(t)= -4.2087+6.2847*t.
The under curve: f
2
(t)= -4.2087+1.2827*t.
The conic function: f
3
(t)=21.6786-15.1486*t+3.2*t
2
.
Shown in the Fig.1, The changing trend of the
conic is closer to the real one. So use the conic
function forecast rail consumption. as a result we
can get a Series value and the mean error ð. through
calculation, the value of ð is 15.2325. Based on the
central curve f
3
(t), it can be regulated to two forecast
curves:
The top curve: g
1
(t)=36.9111-15.1486*t+3.2*t
2
;
The central curve: g
2
(t)=f
3
(t)=21.6786-
15.1486*t+3.2*t
2
;
The under curve: g
3
(t)=6.4461-15.1486*t+3.2*t
2
;
And the value of t takes 2003 as the starting
point, namely t was equal to 1 in 2003.
According to the final prediction curve function,
we can forecast rail consumption in the next five
years as the follow table.2.
Table 2: forecasting rail consumption in (unit: ton).
year
the top
curve
the central
curve
the under
curve
2010 120.5223 105.2898 90.0573
2011 159.7737 144.5412 129.3087
2012 205.4251 190.1926 174.9601
2013 257.4765 242.244 227.0115
2014 315.9279 300.6954 285.4629
According to Beijing Subway Group's operation
Management, it needs to make a budget plan of
materials consumption for the next year at the end of
each year. Therefore, the model in this article is
important to the manager.
3.3 Optimize the Model
As all the method we adopt to predict can no escape
from relative error, and the sample data is so limited,
it is quite important to apply operational change
management. Having proved the method is effective,
we can dig into a new round of consumption rule by
enlarge the sample data volume. To make the
prediction more reliable, the Beijing subway group
may take measures to collect the specific data along
the whole rail line, with which the model will work
better.
4 CONCLUSIONS
This paper gives three prediction line based on
Fuzzy Time Series Prediction Model, Get an annual
interval consumption of rails. On one hand, this
interval provides the material manager a way to
check whether the rail purchase plan is reasonable.
On the other hand, The Purchasing Department can
1 2 3 4 5 6 7
-20
0
20
40
60
80
100
time
年消耗 量总
PREDICTIVE MODEL OF RAIL CONSUMPTION FOR BEIJING SUBWAY LINE 2
491

just make ends meet as been more acknowledged of
the sum amount rail that is needed, which, cut the
cost as a result.
REFERENCES
Cao Minghua Chen Yonggui, 2008. Causes of Rail
Damages and Rail Maintenance on Guangzhou M etro
Line 2. Urban Rapid Rail Transit.
Matsumoto K, Suda Y, et al., 2006. The optimum design of
an onboard friction control system between wheel and
rail in a railway system for improved curving
negotiation, Vehicle System Dynamics. Taylor &
Francis Inc.
Yu Chunhua, 2007.An Assumption of Standardization of
Track Facilities for Urban Rail Transit. Journal of
Railway Engineering Society.
Liu Canlong, 2008. A Study on Metro Wheel-Rail s Wear.
Urban Mass Transit.
Matsumoto K, Suda Y et al., 2008. Wheel/rail friction
control with feedback system detecting yaw moment
of wheelset, Vehicle System Dynamics. Taylor &
Francis Inc.
ZhouYu,XuYude, 2008. 11le Life Cycle Maintenance
Strategy of Rail in Urban Mass Transit. Urban Mass
Transit.
Bozyslaw Bogdaniuk, Andrzej Massel, Rafal Radomski,
2003. Increasing rail life by forecasting fatigue
failure, NDT&E Internationa. Elsevier SCI LTD.
ICEIS 2011 - 13th International Conference on Enterprise Information Systems
492
