
LOGISTICS OPERATION SIMULATION IN BEIJING
OLYMPIC GAMES STADIUM
Xiaochun Lu and Zheng Ni
School of Economics and Management, Beijing Jiaotong University, Beijing, China
Financial Department, Ministry of Railways, Beijing, China
Keywords: The 29th Olympic Games, Sports stadium, Logistics optimization, Simulation.
Abstract: In 2008, the 29th Olympic Games was held successfully in Beijing. It was the largest scale games in the
history, and achieved amazing results. The experience of the Olympic Games is worth to summary. Statics
and analyse of logistics operation volumes in an Olympic Games stadium are made in this paper. A
simulation model about stadium logistics system based on discrete event is developed by using Anylogic
software. With the simulation model, the logistics resource dispatching is discussed. We find logistics
coefficient that 3.2 order sheets for a fork truck and 1.6 orders sheets for a worker are proper burden. These
coefficient could help us to plan logistics resources readily. The paper is useful for us to improve logistics
system in a stadium.
1 INTRODUCTION
In 2008, the 29th Olympic Games were held in
Beijing. High level logistics service of the Olympic
Games was required. The sports equipments,
grocery and other things for competition were
delivered by logistics system. The well done
logistics system ensured the sports games carried on
smoothly. It proves that the logistics system of
Beijing Olympic Games could run smoothly.
As the uncertainty of the transportation in
Beijing, it was difficult for logistics system to be run
accurately, effectively and quickly. It is very useful
to study logistics system operation in Beijing. In this
paper, the simulation model is developed to
investigate the logistics operation in a stadium. It
can help us to understand how to make logistics run
better in sports games.
2 REVIEW ON OLYMPIC GAMES
LOGISTICS SYSTEM
STUDYING
The issues of communication and information
system on Olympic Games were discussed in many
theses. But fewer people have studied Olympic
Games logistics thoroughly. Some papers have
reviewed logistics of Atlanta Olympic Games and
Sydney Olympic Games logistics.
John Mascaritolo (1996) introduced the function
of logistics department of Atlanta Organizing
Committee for the Olympic Games. The challenge
and problems occurred in Atlanta Olympic Games
were illustrated in his paper as well.
Trunick (2004) summarized the Olympic Games
logistics organization of Sydney. In his report the
various logistics problems, such as the problems of
international logistics, the information technology
application, and the cargo transportation during the
Olympic Games held were put forward.
Ioannis (2006)
wrote a paper focused on the
design of the organization, processes, and systems of
Olympic logistics. In his paper, a systematic
methodology has been developed to design the
strategy and tactics of logistics operations for the
Athens 2004 Olympic Games. It is the first time that
a systematic view of Olympic logistics is dealt with,
as opposed to experiential knowledge with local
applicability that has been used in the past to plan
similar operations.
In China, the studying on Olympic logistics
became hotter after Beijing was elected host city for
the 2008 Olympic Games. Most researching
concentrated on such aspects: the logistics market
development, the company’s strategy around
404
Lu X. and Ni Z..
LOGISTICS OPERATION SIMULATION IN BEIJING OLYMPIC GAMES STADIUM.
DOI: 10.5220/0003550404040409
In Proceedings of the 13th International Conference on Enterprise Information Systems (ICEIS-2011), pages 404-409
ISBN: 978-989-8425-55-3
Copyright
c
2011 SCITEPRESS (Science and Technology Publications, Lda.)
Olympic, the operation of Olympic logistics and the
Olympic logistics system planning.
Xianliang Shi, Keming Zhang (2003) forecasted
the quantities of delivery, the transportation, the
storage, and the distribution for the Beijing Olympic
Games logistics.
Olympic logistics system will be studied on the
actual operation data in this paper.
3 THE LOGISTICS OPERATION
ANALYSIS OF A BEIJING
OLYMPIC GAMES STADIUM
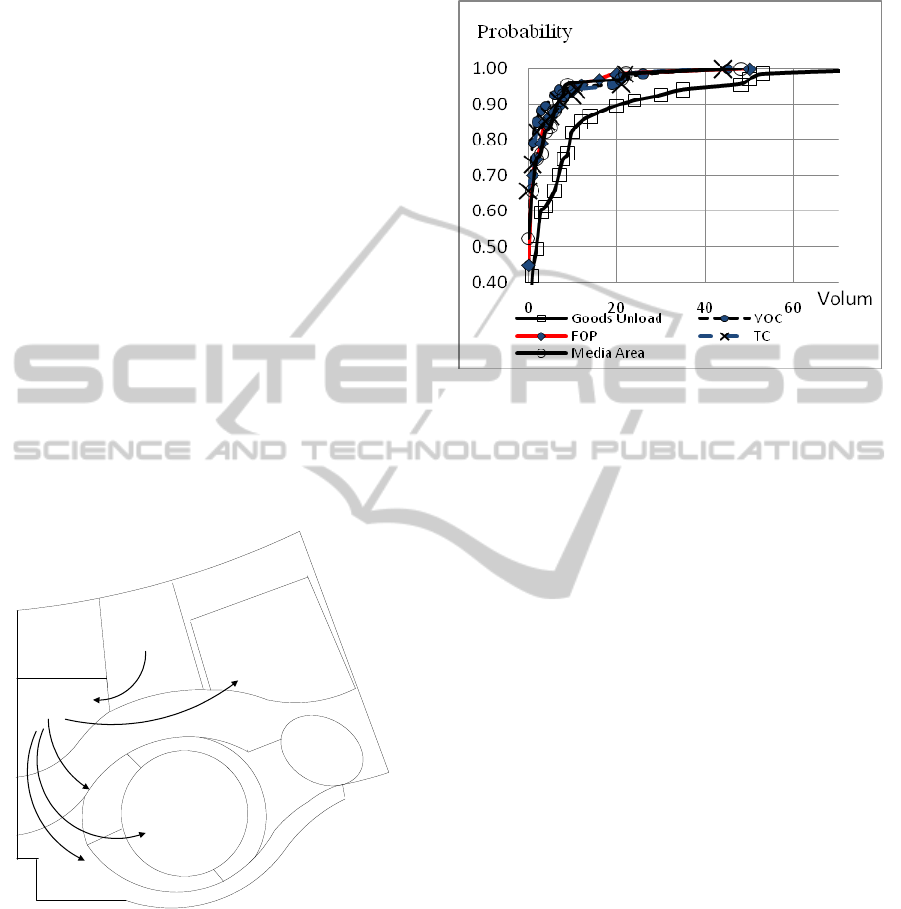
We have studied the logistics operation in an
Olympic Games stadium. This stadium is divided
into five regions: goods unload area, VOC (Venue
Operation Centre), FOP (Field Of Player), TC
(Temporary Construction), media area, shown as in
Fig.1. The logistics department responded for
service in these regions, and also provided fork
trucks lending for other departments as well. We
have taken statistical analysis of the logistics
operation and have used it in model.
FOP
(Field Of Player)
Warehouse
VOC
(Venue Operation Center)
Unload Area
Media
Area
TC
(Temporary Construction)
Figure 1: Regions of a Beijing Olympic Games Stadium.
3.1 Operation Volume of Goods
Unload
During the Olympic Games in August 2008, the
goods arriving schedule was changing from time to
time due to the influence of traffic.
According to the operational standards of the
United Parcel Service (UPS), which provided
Olympic Games logistics sevice, we got handling
volumes statistics in each area. It is shown in Fig.2.
It is found that the burden in each region normally is
no more than 10 pieces.
Figure 2: the Probability of the Operating Volume in Each
Region.
3.2 Logistics Operation Time
By analyzing this stadium, we got the operation time
of manual fork trucks, and found that the average
operation time for a fork truck is half an hour. The
variance is about 0.16 hour, meaning operation time
is 0.5 ± 0.16 hour.
In this stadium, the logistics service is mainly
provided to BOCOG (Beijing Organizing
Committee for the Games of the 29th Olympiad) and
sponsors for materials handling. But other
department’s workers often borrowed tools from
logistics department. According to the stipulated
process, other department’s workers should put
forward an application in 24 hours in advance. The
tools borrowed were non-power devices, such as
trolleys, manual fork trucks, etc. When tools were
occupied by other departments, it might cause urgent
task postpone. So it is important to study tools
lending time and frequency. Because fork trucks are
key devices, so we studied fork trucks lending
regular.
The fork trucks lending time is shown in Fig. 3.
We found that the lending time is about 4.6 hours,
and its standard deviation is 13.4.
We analyzed the frequency of the forklift
lending. It is shown in Fig. 4.
By using the software SPSS, We carried One-
Sample Kolmogorov-Smirnov Test. The frequency
of the forklifts lending obey the
Poisson distribution
(mean λ =5.023), and asymptotic significant (2-
tailed) is 0.784
LOGISTICS OPERATION SIMULATION IN BEIJING OLYMPIC GAMES STADIUM
405
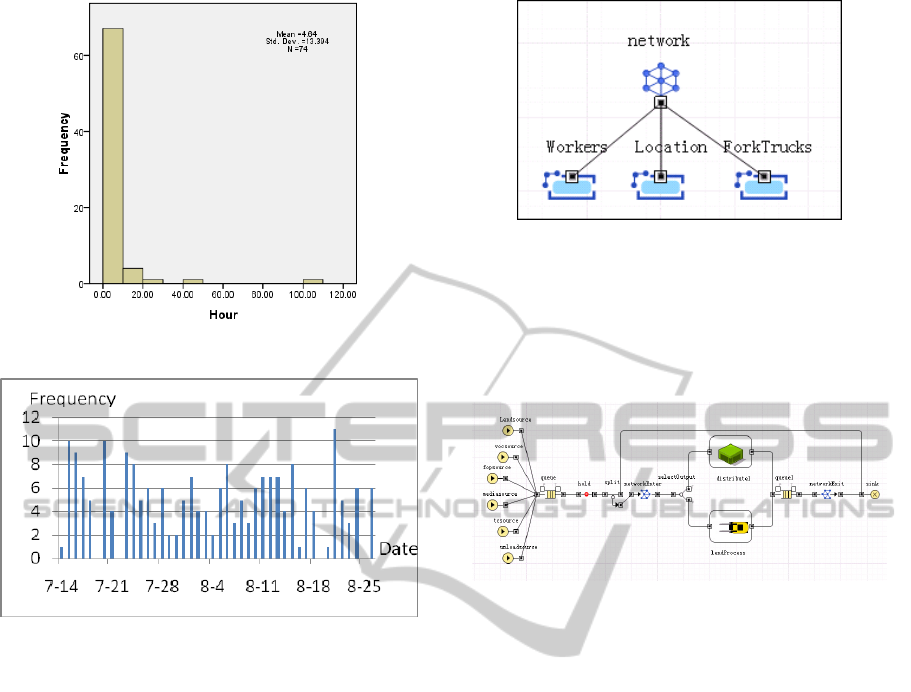
Figure 3: the Lending Time of Forklifts.
Figure 4: the Frequency of Forklifts Lending.
4 THE SIMULATION MODEL
OF LOGISTICS OPERATION
4.1 The Simulation Model
In this paper, we take Anylogic (a simulation
software of XJ technology Company) to establish
the simulation model of logistics operation in the
stadium. The model includes two parts of module:
the resources network module and the logistics
operation module.
In the resources network module, the application
of resources is defined. The process of logistics
service is simulated in the logistics operation
module.
Network objects in Anylogic mainly are used for
maintaining the topological structure and resources
management. There are three kinds resources are
defined in the paper: workers, fork trucks, and the
location. The resources network structure of the
model is shown in Fig. 5.
Figure 5: The Model of Resources Network.
The logistics operation in the stadium is
simulated in this module. The operation process
includes 2 sections: materials receiving and
distribution, the forklifts lending .This model is
shown in Fig. 6.
Figure 6: the Module of Logistics Operation.
(1)The Module of Material Receiving and
Distribution
In this venue, a work group (fork truck and
worker) could start material handle working when
they got a working-sheet from logistics department.
In our model, the network resources are used to
simulate the materials receiving and distribution.
The module is shown in Fig. 7.
In this model, the waiting tasks in 5 regions and
application of forklifts lending are presented by
queues. But the tasks in 5 regions priority are higher
than the task of forklifts lending.
(2)The Module of Fork Trucks Lending
The amount of fork trucks in this venue is 6. But
these trucks couldn’t be all lend out. If a fork truck
was ideal, the other departments could borrow it.
But if all fork trucks were busy, the other
departments must fill an application form and wait
till a fork truck was ideal.
The fork trucks lending must be treated specially.
So we build a sub-model to deal with the fork trucks
lending. This model is shown in Fig. 8.
When a lending application appears, firstly it
waits in queue to size the resources (shown as the
object of ‘Network Seize1’ in Fig.8). The action is
that a fork truck can be lent only if staffs register it.
ICEIS 2011 - 13th International Conference on Enterprise Information Systems
406
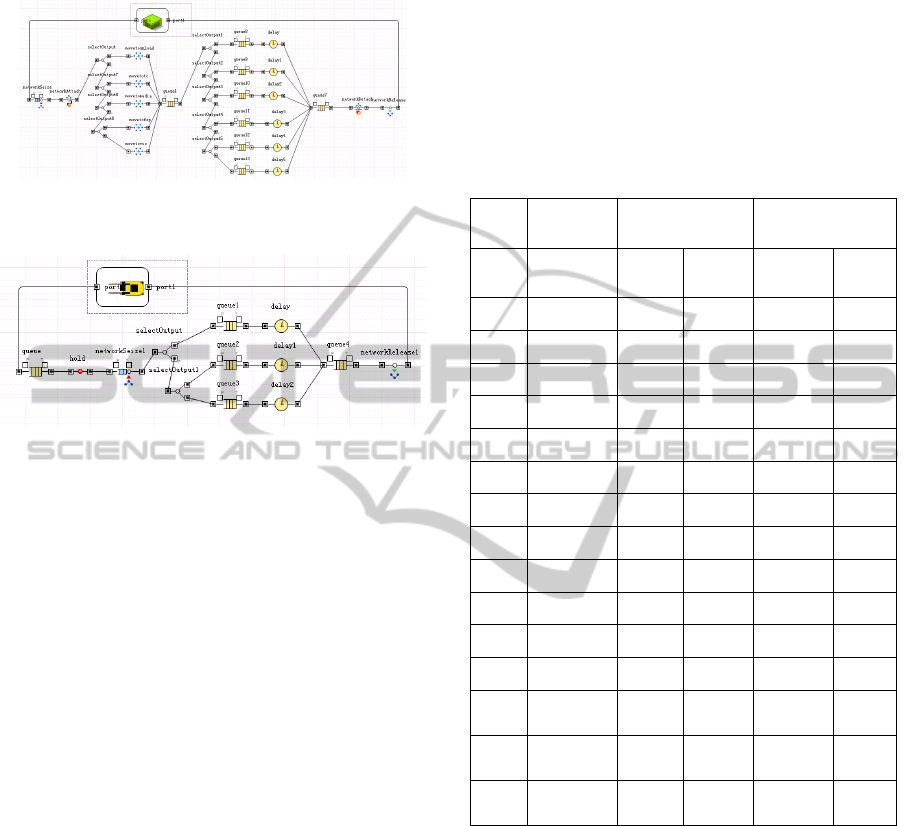
So the lending process can be carried when there is a
fork truck is ideal.
Figure 7: the Module of Material Receiving and
Distribution.
Figure 8: the Module of Fork Trucks Lending.
4.2 The Model Parameters
With the consideration of the actual situation in the
stadium, the model parameters are set as follow:
(1) The working-sheets priority. According to the
actual logistics operation in the stadium, the
working-sheets of materials delivered in should be
given the highest priority. The working-sheets of
materials distribution were given a normal priority.
The working-sheets of lending forklifts were given
the lowest priority. When the staffs were busy in
working with receiving goods or distributing goods,
the forklifts must be provided for them and forklifts
couldn’t be lent out.
(2) The resources occupancy. In accordance with the
logistics service standards, when a forklift was in
operating state, an operation occupies three workers
and a truck.
(3) The simulation length. In this model, the
simulation time is set as minute. A working day is 8
hours. The simulation length is set as 120 working
days.
(4) The number of workers. In this stadium, 11
workers were working for logistics department and
the number of forklifts was 6.
5 SIMULATION RESULT
ANALYSIS
In this paper, the model has been simulated for ten
times. The forklift lending, material receiving and
distribution results has been analyzed. It is shown in
table 1. The simulation result shows data in the
range of 95% confidence.
Table 1: the Simulation Result.
Exp.
Forklifts
Lending
Material Receiving
and Distribution
Resource Utilization
No.
Waiting Time
(hour)
Over-time
Freq.
Operation
(hour)
Workers’
Load Rt.
Forklifts’
Util.
1 0.49 11.7% 3.5 35.3% 30.9%
2 0.46 11.6% 3.0 35.0% 30.3%
3 0.45 11.9% 3.1 32.8% 30.7%
4 0.55 11.4% 3.4 33.6% 31.9%
5 0.52 11.2% 3.2 32.4% 29.7%
6 0.46 11.8% 3.3 33.6% 32.8%
7 0.48 11.8% 3.3 34.1% 29.5%
8 0.54 11.1% 3.8 34.5% 30.6%
9 0.51 11.1% 3.3 31.1% 29.8%
10 0.47 11.4% 3.6 33.3% 30.3%
Mean 0.51 11.5% 3.3 33.0% 30.2%
Variance 0.04 0.3% 0.2 1.3% 1.0%
95%
Conf.
0.03 0.2% 0.2 0.9% 0.7%
Upper
Bound
0.54 11.7% 3.5 33.9% 30.9%
Lower
Bound
0.48 11.3% 3.2 32.1% 29.5%
5.1 Submodel Simulation Results
(1) The model of material receiving and distribution
simulation result.In the case of 11 workers, the
simulation result shows that the time spending on
material receiving and distribution is 3.3 hours. It
means that to carry the material handling usually
needs a half working day. The probability of over-
time work is 11.3%~11.7%(the mean is 11.5%).It
indicates that, when the quantity of material
handling work is quite large, there will be 11.5%
tasks beyond the normal working hours.
By the simulation result, we find that it can meet
the need of work with 11 workers. Actually, due to
the large amount of unexpected tasks before the
LOGISTICS OPERATION SIMULATION IN BEIJING OLYMPIC GAMES STADIUM
407
Olympic Games helding, the staffs of logistics
department often has to work overtime.
(2) Forklifts lending simulation result. Under the
circumstances of 6 forklifts, the simulation result
shows that average waiting probability of trucks
lending is 3.2%. The waiting time of forklifts
lending is about 0.51 hours. It indicates that the
process of trucks lending is relatively smooth. Other
departments can borrow forklifts nearly without
waiting. It can meet the needs of other departments
very well.
5.2 Resources Utilization Optimization
From the simulation results, it is found that there is
room for improvement in the logistics resources
planning in this stadium. There is lot of work to do
on optimizing resources so as to improve resource
utilization rates.
From the simulation result, we find that the load
rate of workers and forklifts utilization are lower.
The load rate of workers is only 33%, their work rate
could be improved.
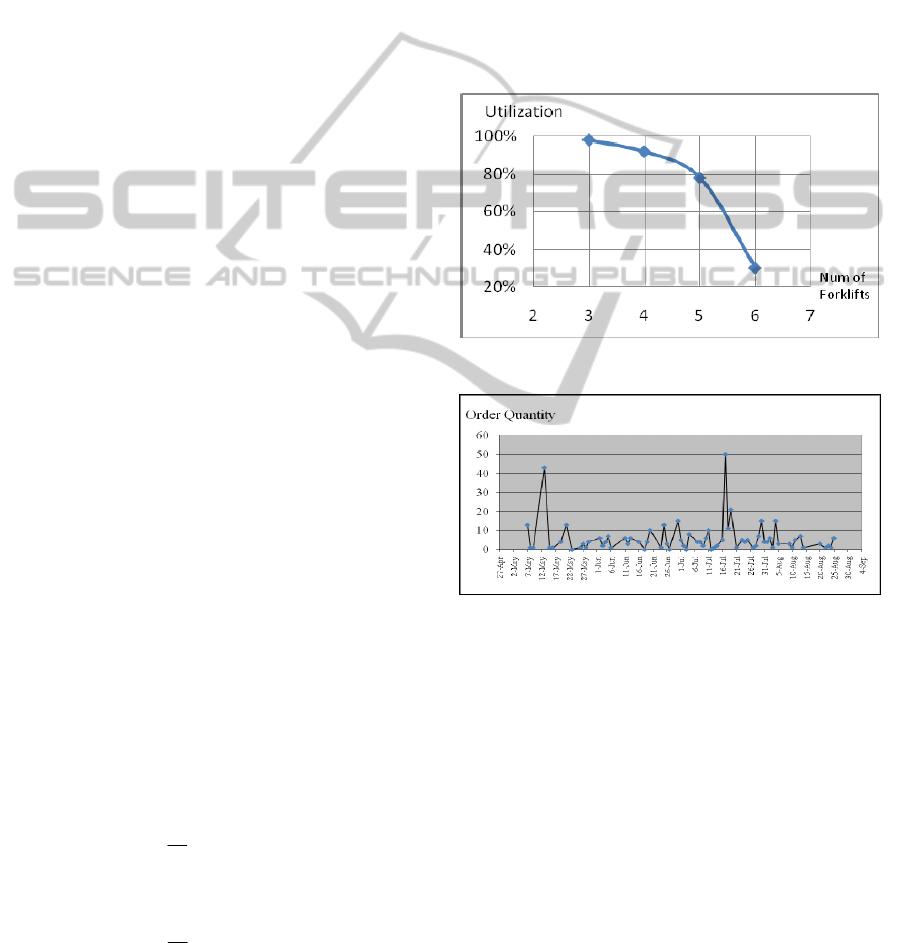
The number of forklifts is 6. In this situation, it
may be considered to streamlining appropriately.
But the utilization of fork trucks is only about 30.2%.
We set the number of fork trucks from 6 to 5. In this
solution, the utilization could be improved to 78%.
The optimization work on forklifts’ utilization
has been made. When the number of forklifts is 4,the
simulation result shows that the utilization of
forklifts is 92%. When the number of forklifts is 3,
the utilization is 98%. The result is shown as Fig.9.
So we think that 5 forklifts are better for this
stadium. The forklifts could be working in a good
state.
We have got received order quantity of this
stadium, which is shown as Fig.10. To this stadium,
order quantity median value is 4 sheets a day. Its
mean value is 6 sheets and stand deviation is 8.
Considering 90% probability, this stadium received
order quantity is under 16 sheets .
So we can get coefficient to determine numbers
of fork trucks and workers in a stadium.
Fork truck coefficient is:
16
3.2
5
=
Worker coefficent is:
16
1.6
10
=
So we think that in this stadium, 3.2 order sheets
for a fork truck and 1.6 sheets for a worker are
proper durden. By using these logistics cofficent, we
can get numbers of fork trucks and workers in a
stadium easily.
6 CONCLUSIONS
The logistics system of this stadium, there is certain
of balance between fork trucks lending services and
material handling. The logistics department's main
task is to receive and delivery material, in order to
maintain the high efficiency of this service, it is
bound to occupy quite a lot of material resources.
Figure 9: Forklifts’ Utilization Optimization.
Figure 10: Received Order Quantity of this Stadium.
Based on the analysis above, this paper considers
that the proportion of workers and fork trucks could
be adjusted. The number of workers can be cut down
to 10 and the fork trucks can be cut down to 5. In the
Olympic stadiums, the configuration ratio of actual
workers and logistics tools is fixed, which is due to
operational efficiency and safety. If we can
flexibility adjusts the amount of forklifts and
workers based on actual situation, the overall
flexibility of the system can be enhanced, which
makes the system efficiency improve. By studying
simulation results, we think that 3.2 order sheets for
a fork truck and 1.6 orders sheets for a worker are
proper burden coefficient. These coefficient could
help us to plan logistics resources readily.
ICEIS 2011 - 13th International Conference on Enterprise Information Systems
408

REFERENCES
Ioannis Minis, Eric Keys, Theodore Athanasopoulos, 2006.
Contribution to the design of the Athletes Bus
Network during the Athens 2004 Olympic Games.
Transportation Research Part A: Policy and Practice.
2006-11, 40(9): 776-791
Ioannis Minis, Marion Paraschi, Apostolos Tzimourtas,
2006. The design of logistics operations for the
Olympic Games. International Journal of Physical
Distribution & Logistics Management. 2006, 36(8):
621 – 642. Emerald Group Publishing Limited
Jinghai Sun, 2004. The Research on Beijing Olympic
Games Organization Based on P-A-C4ISR Theory.
Conference of Sports Science (Chinese). Beijing:
Sports Science,2004:22
John Mascaritolo, 1996. Logistics at the 1996 Olympic
Games. Annual Conference Proceedings, Council of
Logistics Management.OAK BROOK, ILL: 1996.
263-276
Trunick, Perry A, 2004. Going for Logistics Gold:
Apparel maker Roots prepares for the challenge of
outfitting the 2004 Summer Olympics. Logistics
Today. Penton Media, Inc: 2004. Vol 45; Part 3: 25-26.
Xuejun Tian, 2007. Logistics at Beijing Olympic Games:
The opportunity and Challenge. Logistics Technology
(Chinese), 2007(6):8-13
Xianliang Shi, Keming Zhang, 2003. Forecast of Logistics
of Beijing Olympic Games in 2008. Quantitative and
Technical Economics (Chinese). 2003(10):151-154
Zheng Bai, 2005. The studying on Logistics System
Planning of Beijing Olympic Games. Journal of
Chengdu Sports University (Chinese). 2005, 31(6):
18-21
LOGISTICS OPERATION SIMULATION IN BEIJING OLYMPIC GAMES STADIUM
409
