
INCREMENTALLY DEFINING ANALYSIS PROCESSES USING
SERVICES AND BUSINESS PROCESSES
Weisi Chen and Fethi A. Rabhi
School of Computer Science and Engineering, University of New South Wales, Sydney 2052, Australia
Keywords: Tick data, Data-intensive analysis, Event study, Web services, Business process, SOA.
Abstract: Increasingly, the idea of using SOA and BPM principles is being applied outside the enterprise computing
context. One potential area is the use of reusable services to facilitate the definition, composition and
execution of analysis processes over large distributed repositories of heterogeneous data. However, it is hard
to see how such a solution can be applied when users are already engaged in performing the same tasks
using their own tools and processes. This paper studies the problem in more detail and proposes a simple
method in which the initial analysis process is iteratively refined into a service-based one. The methodology
relies on an ADAGE architecture which gives the flexibility to define data analysis processes in an
incremental way. As a case study, the approach is demonstrated on the process of conducting event studies
using the SAS package together with different data sources (e.g. Thomson Reuters Tick History-- TRTH).
The case study demonstrates that the resulting process is substantially more efficient and effective than the
original one.
1 INTRODUCTION
The concept of a Service-Oriented architecture
(SOA) has gained significant attention as a means of
developing flexible and modular systems.
This
concept has traditionally been used in the context of
inter-enterprise or intra-enterprise integration.
Increasingly, the idea of using SOA in other
application areas is gaining momentum. This work is
part of a larger effort in developing a service-
oriented framework to facilitate the definition,
composition and execution of analysis processes
over large distributed repositories of heterogeneous
data (Guabtni et al. 2010). The key component of the
framework is a Service-Oriented Architecture (SOA)
called ADAGE that provides the underlying
infrastructure upon which analysis processes are
defined. This paper is mainly concerned with how to
provide suitable guidance to users in defining and
automating analysis processes.
In this paper, we propose a simple method
which allows an existing process to be iteratively
transformed into an improved service-based process.
At any time, the current process can be used so this
method allows a new solution to be introduced
gradually. As a case study, this method is applied to
the data analysis process required when conducting
an event study in the financial domain.
2 BACKGROUND AND RELATED
WORK
The motivation behind this work is that often, data-
intensive analysis tasks are performed by non-IT
experts from different application domains (e.g.
biology, physics, health) who mostly use libraries
and packages from a variety of sources and manage
the analysis process by themselves. Due to the wide
choice of libraries available, navigating this large
design space has become its own challenge.
Many approaches have been suggested for
supporting data analysis processes. For example,
workflow technology can be used to control the
interaction of computational components and
provide a means to represent and reproduce these
interactions in scientific workflow systems for grid
computing such as Triana (Churches et al. 2006) and
Taverna (Oinn et al. 2004). Yu and Buyya (2006)
have surveyed many scientific workflow systems
and note they lack standardization in workflow
specification syntax and semantics. On the other
hand, due to the iterative and interactive nature of
485
Chen W. and A. Rabhi F..
INCREMENTALLY DEFINING ANALYSIS PROCESSES USING SERVICES AND BUSINESS PROCESSES.
DOI: 10.5220/0003549904850488
In Proceedings of the 13th International Conference on Enterprise Information Systems (ICEIS-2011), pages 485-488
ISBN: 978-989-8425-56-0
Copyright
c
2011 SCITEPRESS (Science and Technology Publications, Lda.)
the analysis process, any workflow-like system
needs to be flexible and support process change at
run time. In Business Process Management Systems
(BPMS) (Weber et al. 2008), users are provided with
the flexibility to develop their own processes but
still have to manage and handle different data
formats as well as find ways of integrating existing
software packages and tools. Due to these
limitations, the ADAGE approach (Guabtni et al.
2010) has been specifically proposed to apply SOA
and BPM concepts to the definition, composition
and execution of analysis processes over large
repositories of distributed data. One limitation of
ADAGE is that users are already conducting large-
scale data analysis using their own processes and
tools so they consider this new approach as
potentially disruptive and risky. This has motivated
us to study ways of providing formal guidance to
users in defining and executing analysis processes.
3 PROPOSED METHOD
We first describe the ADAGE architecture then
describe our solution which provides a gradual
evolution of an existing analysis process into a
service-based one.
3.1 ADAGE Framework
The main idea of the ADAGE framework is to use a
service-oriented architecture (SOA) for
decomposing the analysis processing into distinct
activities that can be implemented separately. A
SOA enables different technologies (e.g., Web
services) to provide facilities such as run time
messaging, service composition and choreography,
process modelling, discovery, semantic support and
run time management. In addition, the functionality
provided by existing software programs (e.g. legacy
systems or application packages) need not be
redeveloped; the software program’s functionality
can be exposed as a service through some wrapper
code. The ADAGE system architecture consists of
the four following layers.
• Data Source layer: allows access to data
repositories (including Web repositories) via
standardized APIs, publicly known file formats
and/or access protocols.
• ADAGE service layer: contains services
referred to as ADAGE services, each of which
typically provides the functionality required to
perform one specific task in the analysis
process.
• Service composition layer: facilitates the
composition of several invocations to the
ADAGE services, either manually or
automatically.
• User Interface layer: allows users to interact
with the system, usually through a graphical
user interface (GUI).
3.2 Analysis Process Transformations
The proposed approach works under two
assumptions. Firstly, there are some domain experts
who are already engaged in performing some kind of
analysis using their own tools and data sources.
Secondly, there is already an ADAGE
implementation that provides some of the
functionality needed in that particular application
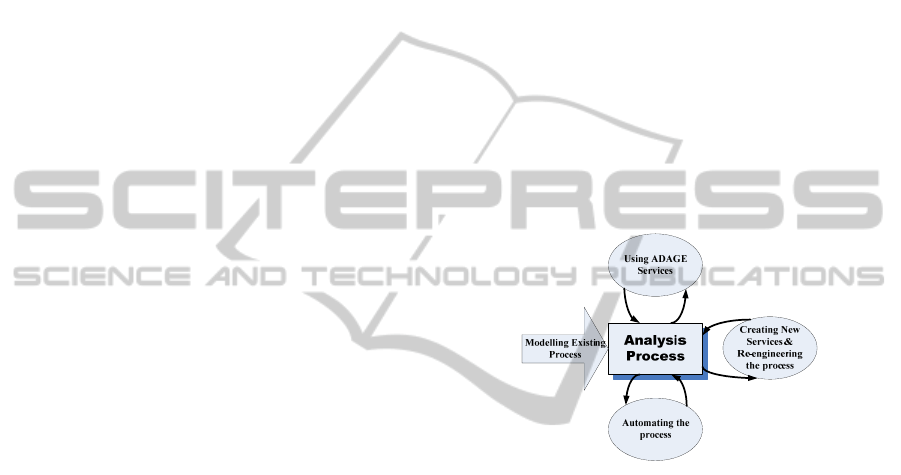
domain. Given these assumptions, we suggest the
following approach (illustrated in Figure 1).
Figure 1: Modelling and implementation of an existing
analysis process.
• Formalizing the existing process using some
workflow notation
• Replacing some tasks with existing ADAGE
services. The invocation of these services will
still be largely under the analyst’s control
• Creating new ADAGE services to eliminate
particular areas where manual intervention is
still needed. This is usually followed by a re-
engineering of the analysis process
• Automating selected parts of the process using
service composition technologies (e.g. BPMN)
These transformations can be applied iteratively
until a desired level of automation has been achieved.
This method is now demonstrated via a case study in
the rest of the paper.
4 CASE STUDY
We now show a step by step application of different
ICEIS 2011 - 13th International Conference on Enterprise Information Systems
486
types of process transformations described in
Section 3 to a case study, which assumes a number
of finance researchers interested in conducting event
studies. In addition, we assume that users are
interested in processing non-US data from the
Thomson Reuters Tick History (TRTH) system
available from Sirca (http://www.sirca.org.au).
According to Binder (1998), an event study
should proceed as follows:
1. Collect multiple occurrences of a specific type
of event for firms that fit a certain criteria;
2. Find stock price changes for those firms in
periods around the event date as well as
changes in a market-wide index;
3. Look for abnormal returns compared with
usual returns or returns adjusted for market rate
of return;
4. Run further regressions for explain the
abnormal returns
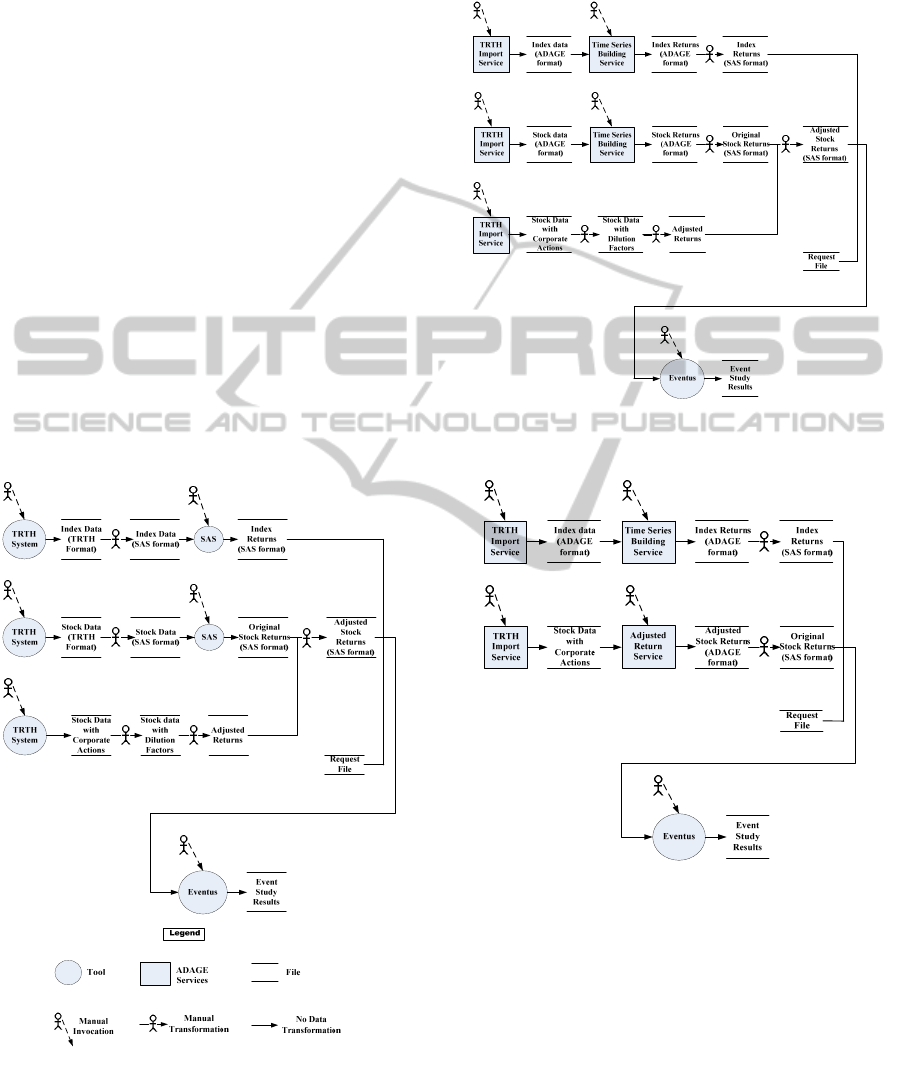
In Step 1, the basic process of conducting an
event study is modelled, as illustrated in Figure 2. In
this process, users get index returns, stock returns
and request file (with a list of events) ready in SAS
format in order to call Eventus by many manual
transformations.
Figure 2: Modelling the existing Process of Event Study.
Figure 3 describes Step 2, the first
transformation, which replaces some manual access
to data and transformations with assumed existing
ADAGE Services, namely TRTH Import Service,
Time Series Building Service, Download Service.
Figure 3: Including Using ADAGE Services into the
Existing Process.
Figure 4: The Re-engineered Process Using a New
ADAGE Service.
One major problem in both previous processes is
that the user needs to manually compute adjusted
returns for non-US stock data. Since no previously
defined ADAGE services can calculate dilution
factors and adjusted returns, a new service called
Adjusted Return Service is created. Then in Step 3,
the process can be re-engineered as Figure 4 shows.
Step 4 is to automate several invocations to
ADAGE services into a business process, which we
call “Event Study Pre-processing”. Figure 5
INCREMENTALLY DEFINING ANALYSIS PROCESSES USING SERVICES AND BUSINESS PROCESSES
487
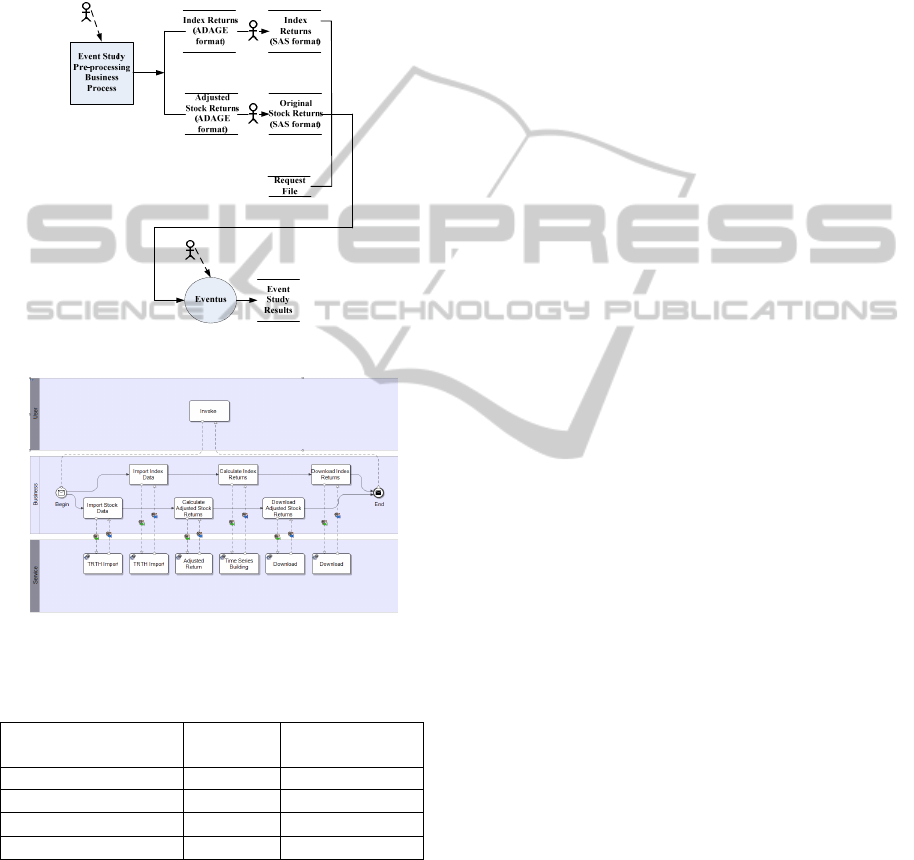
illustrates new analysis process which significantly
reduces the time it takes to invoke services
individually. Only one manual transformation is
needed here. Figure 6 shows this business process
modelled in BPMN (White, Miers 2008) using
Intalio Designer. In the next transformation, one
could develop a service wrapper around Eventus to
automate the entire Event Study analysis process.
Figure 5: The Automated Process.
Figure 6: Event Study Pre-processing Business Process.
Table 1: Comparison between old and re-engineered.
processes.
Country
(Number of stocks)
Manual
process
Re-engineered
process
Qatar (2) 1 day 9 minutes
Qatar (10)
2 days
10 minutes
Indonesia (30) 4 days 13 minutes
Malaysia (221) 15 days 16 minutes
To compare between the old process (Figure 2)
and the re-engineered process (Figure 4), we carried
out some event studies and recorded the approximate
time for each process, as illustrated in Table 1. We
used the Qatar index with 10 stocks, Indonesian
index with 30 stocks and Malaysian index with 221
stocks to get 4 studies of increasing complexity. All
studies used the same event date.
5 CONCLUSIONS AND FUTURE
WORK
This paper discussed the challenges non-IT experts
from different domains face when data-intensive
analysis tasks are conducted and provided gradual
way for users to move away from existing manual
processes towards automated service-based ones.
The proposed technique was tested on a case study
involving the process of conducting an event study
in the financial domain.
There are still many challenges that need to be
tackled. Firstly, automating an analysis process
makes it less understandable by the user. This is
important for example when justifying the use of a
particular technique or when dealing with business
process exceptions. In addition, given many
different process transformations available at any
point in time, it is not always clear how to choose
the best one. More work needs to be done in
formalising the approach and explaining the various
cost-benefit trade-offs to the users.
REFERENCES
Bellamy, D., 1998. The calculation of the dilution factors
for the SIRCA ASX Daily Data (preciously known as
CRD), Sirca.
Binder, J., 1998. Event Study Methodology since 1969. In
Review of Quantitative Finance and Accounting.
Churches, D., Gombas, G., Harrison, A., Maassen, J.,
Robinson, C., Shields, M., Taylor, I., Wang, I., 2006.
Programming scientific and distributed workflow with
Triana services. In Concurrency and Computation:
Practice and Experience, John Wiley & Sons, Ltd.
Oinn, T., Addis, M., Ferris, J., Marvin, D., Senger, M.,
Greenwood, M., Carver, T., Glover, K., Pocock, M.R.,
Wipat, A. and Li, P., 2004. Taverna: a tool for the
composition and enactment of bioinformatics
workflows. In Bioinformatics.
Guabtni, A., Kundisch, D., Rabhi, F.A., A User-Driven
SOA for Financial Market Data Analysis. To appear in
Enterprise Modelling and Information Systems
Architectures.
Thomson Reuters, 2011. Thomson Reuters Tick History,
https://tickhistory.thomsonreuters.com/TickHistory/.
Weber, B., Reichert, M., Rinderle-Ma, S., 2008. Change
patterns and change support features - Enhancing
flexibility in process-aware information systems. In
Data and Knowledge Engineering, Elsevier Science.
White, S. A., Miers, D., 2008. BPMN Modeling and
Reference Guide. Future Strategies Inc.
Yu, J., Buyya, R., 2006. Scheduling scientific workflow
applications with deadline and budget constraints
using genetic algorithms. In Scientific Programming,
IOS Press.
ICEIS 2011 - 13th International Conference on Enterprise Information Systems
488
