
ATMOSPHERE CONTROL BY CHEMORESISTIVE
POLYMER COMPOSITES
Gita Sakale, Maris Knite, Marika Novada, Elina Liepa, Santa Stepiņa
Institute of Technical Physics, Riga Technical University, Azenes Street 14/24, Riga, Latvia
Velta Tupureina
Institute of Polymer Materials, Riga Technical University, Azenes Street 14/24, Riga, Latvia
Keywords: Chemoresistive composite, Volatile organic compounds, Carbon nanoparticles.
Abstract: This work reports about polymer-nanostructured carbon composite (PNCC) and it possible application for
relative humidity registration and volatile organic compound (VOC) detection in the air. PNCC have been
produced using high structured carbon black (HSCB) nanoparticles and polyisoprene (PI), ethylene-
vinylacetate (EVA) copolymer, polyvinylacetate (PVAc), polyethylene glycol (PEG) and polyvinylalcohol
(PVA). Matrix material for composite production has been selected with respect to desired analyte to bee
tested. Composites show selective response to particular species of analytes vapour. It has been found that
humidity sensing mechanism changes from proton conductivity to electron tunnelling by addition of HSCB
to PVA matrix. Plasticizer effect on PVAc-NCC ethanol vapour sensitivity has been evaluated.
1 INTRODUCTION
In the spotlight of scientific research are different
kind of sensor materials for odour detection and
inspection. Metal oxide (ZnO, SnO ect.) sensor
materials are already proved themselves as good
sensing materials for detection of ethanol, CO
2
, etc.
and are widely utilized (Yang et al., 2009; Trinh et
al., 2011). Conductive polymers and chemoresistive
polymer composites show multiple VOC selectivity
at room temperature (Kang et al., 2010; Wang et al.,
2010). The greatest selectivity with possibility to
distinguish even individual odour molecules can be
obtained by molecularly imprinted polymers and
biosensors (Van Dorst et al., 2010). With increasing
sensitivity of produced sensor materials,
consequently, application field also enlarges from
environmental control (VOC leakage detection in
chemical and petrochemical industry) to agricultural
(diagnosis of plant disease), food industry (food
quality, storage life, freshness) and medicine
(diagnosis of disease). Mahmoudi (Mahmoudi,
2009) has reported that microbial organisms such as
fungi and bacteria can grow and generate VOC
including different alcohols, aldehydes, ketones,
aromatic compounds, amines, terpenes, chlorinated
hydrocarbons and sulphuric compounds while
metabolizing nutrients. It means that VOC can be a
biomarker for early stage diagnostic of human
diseases or microbial organism discovery in food
and wood.
It is already a well known practice to impart to
polymer conductivity by dispersing conductive
particles in it. When conductive particles are
dispersed in isolating matrix, continuous conductive
network through matrix is formed either by
geometrical or tunnelling contact between particles.
If the composite is exposed to VOC, particles
aggregate forming conductive network are
withdrawn from each other by VOC induced
isolating polymer matrix swelling. Consequently,
electrical resistance of the composite increases and
the presence of VOC can be detected.
Here is presented a polymer/HSCB composite
film capability to selectively detect different VOC or
register relative humidity of the environment. The
influence of structural state of composite matrix
material (rubbery, viscoelastic, crystalline) on VOC
sensitivity is analyzed. Two different relative
humidity sensing mechanisms existing in PVAc-
NCC are described. Also attempts to improve
PVAc-NCC ethanol vapour sensitivity by addition
370
Sakale G., Knite M., Novada M., Liepa E., Stepina S. and Tupureina V..
ATMOSPHERE CONTROL BY CHEMORESISTIVE POLYMER COMPOSITES.
DOI: 10.5220/0003544603700375
In Proceedings of the 8th International Conference on Informatics in Control, Automation and Robotics (ICINCO-2011), pages 370-375
ISBN: 978-989-8425-74-4
Copyright
c
2011 SCITEPRESS (Science and Technology Publications, Lda.)

of plasticizer are demonstrated.
2 MATERIALS AND METHODS
Polymers for PNCC production were selectively
chosen. PI has been selected as highly non-polar
matrix with a purpose to detect non-polar VOC. On
the contrary PEG, PVAc was selected as highly
polar matrix to detect polar VOC like methanol,
ethanol, propanol, butanol, formamide, acetone,
methyl ethyl ketone etc. PVA was chosen for highly
polar solvent vapour presence determination. As
EVA copolymer contains non-polar part – ethylene
and polar part - 29.7% vinyl acetate, it was picked
up to produce composite, which could sense both
polar and non-polar solvents.
For all produced composites high structured
carbon black PRINTEX XE2 (mean diameter 30 nm,
DBP absorption - 380 ml/100 g, BET surface area -
950m
2
/g) as conductive filler was used. Firstly,
HSCB was dispersed in appropriate solvent using
Hielscher UP200S ultrasound homogenizer. Specific
power 1W/ml was applied for 5 minutes. Secondly,
the HSCB dispersion in solvent was added to a
polymer solution in the same solvent. Magnetic
stirring for 1 to 24 hours were applied. After
magnetic stirring polymer-HSCB mixture was
coated on epoxy laminate substrate with copper or
brass wire (in case of PI-NCC) electrodes. The
composite layer on epoxy laminate substrate was
obtained by repeated immersion of the epoxy
laminate into the mixture and subsequent solvent
evaporation from the film. Immersion-evaporation
cycles were repeated up to 4 times. PI-NCC after
solvent evaporation was cured under 30 atm pressure
at 150
o
C for 15 minutes. Brass wire electrodes were
selected for PI-NCC production because at the time
of curing chemical bonds between polyisoprene
rubber and brass wires are formed, which ensures
excellent composite adhesion to electrodes.
Produced samples were in size 10x14mm (width x
length) and with varying thickness.
For PVA-NCC production slightly different
production method was used. Firstly, PVA was
dissolved in water for 6h at 80
o
C. Secondly, HSCB
was dispersed in distilled water using Hielscher
UP200S ultrasound homogenizer. Specific power
2.5W/ml was applied for 5minutes. Thirdly, HSCB
suspension in water was added to 20ml of 10% PVA
solution in water. Obtained mixture was stirred with
glass beads for 10 minutes. The mixture was purred
out in Petri dishes. To obtain hydrogel from the
mixture, it was subjected to repeated freezing (12h at
-12
o
C) and thawing (12h at +25
o
C) cycles. Cycles
were repeated 3 times. Samples with dimensions
5x50x0.3mm were used for measurements. At the
time of freezing and thawing hydrogen crosslinks
are formed in PVA (Stasko, J., Kalnins, M., Dzene,
A., Tupureina, V., 2009). These physical crosslinks
prevents PVA from dissolution in water.
HSCB content in PI-NCC was varied form 2.2 to
6.6 phr (parts per hundred rubber). In case of PEG-
NCC, PVAc-NCC, EVA-NCC HSCB was held
constant 10 parts per hundred polymer (php) and
9php for PVA-NCC, respectively.
3 RESULTS AND DISSCUSION
3.1 Evaluation of Polymer Matrix
Structural State
PEG with molecular weight 40000 was used for
PEG-NCC production. Hydroxyl end groups in
chemical structure of PEG determine it polar nature
(ε =3.37), and single polymer backbone without side
branches ensures highly crystalline (92%) structure
formation.
PVAc with molecular weight 101600 was used
for PVAc-NCC production. PVAc has relatively
large acetate side groups, which act as steric
hindrance for three dimensional structure formation
of PVAc. As a result PVAc has amorphous
structure. EVA copolymer structure is composed of
ethylene and vinylacetate repeating units.
Introduction of vinylacetate in ethylene structure
leads to reduced copolymer crystallinity.
Differential scanning calorimetry (DSC) was used
for matrix material structural state analyzes, when it
is pure as well as in composite content. DSC
measurements were carried out only for composites
indented for detection of polar VOC (see Table 1).
Glass transition temperature (T
g
) and crystallinity
has been chosen as parameters for evaluation
because both greatly influence the composite VOC
sensitivity. T
g
indicate how flexible are polymer
macromolecules at room temperature. As lower
value of Tg as more rubbery like amorpous polymer
is and more flexible are polymer macromolecules.
Therefore more rapidly segmental motions of the
polymer can be performed by absorption of analyte.
VOC molecule absorption and polymer swelling
would be more favourable by hyperelastic than by
stiff and brittle matrix. Segmental motions can be
made more easily in amorphous structure than in
closely packed crystalline. It is seen in Table 1, that
crystallinity of EVA and PEG decreases, when
ATMOSPHERE CONTROL BY CHEMORESISTIVE POLYMER COMPOSITES
371
HSCB are introduced in polymer matrix. It seems
like that electroconductive grid formed by HSCB
particles in matrix acts as hindrance for polymer
crystallization. Crystallinity of EVA and EVA-NCC
has been calculated using heat of fusion of 100%
crystalline polyethylene 293.6 J/g (on line data
base). Crystallinity of PEG and PEG-NCC has been
determined using heat of fusion of 100% crystalline
PEG 196.8 J/g (Nalawade, Picchioni, Janssen,
2007). HSCB addition to EVA and PEG has no
significant effect on T
g
. On the contrary addition of
HSCB to PVAc matrix has notable effect on T
g
,
which changes from 39.07
0
C to 3.28
0
C. It means
that PVAc chain mobility enhances with addition of
HSCB. Similar decrease of T
g
by addition of B
2
O
3
,
Al
2
O
3
or SiC to polymer have been observed by
Sundar and others (Sundar, Selladurai, 2006;
Ahmad, et. al 2009; Koo Choi, Hee Shin, 1996).
Table 1: DSC results of pure polymers and composites.
Material T
g
,
0
C Crystallinity, %
PVAc 39.07 -
PVAc-NCC 3.28 -
EVA -25.35 7.4
EVA-NCC -25.99 1.5
PEG -60.55 92
PEG-NCC -59.47 67.5
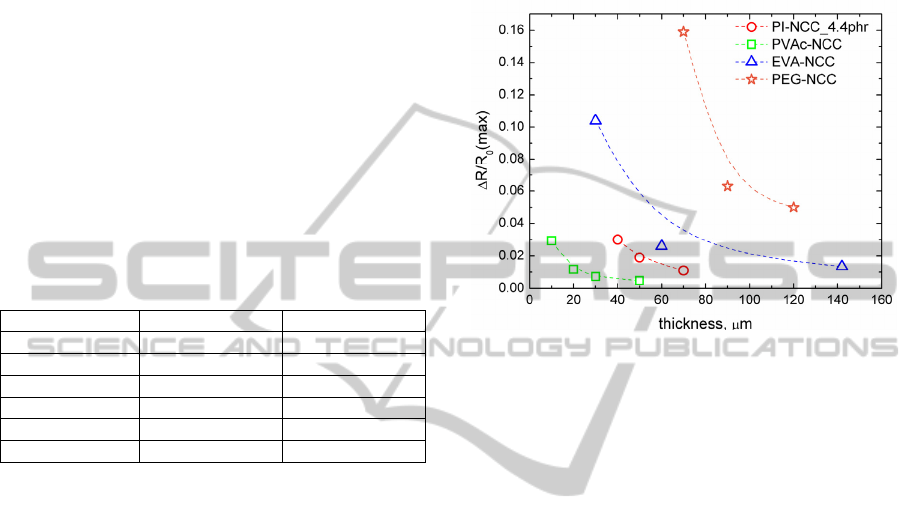
3.2 Composite Film Thickness Impact
on Sensitivity
PI-NCC, PEG-NCC, EVA-NCC and PVAc-NCC
electrical resistance response to VOC has been
determined (Fig.1). PI-NCC was exposed to non-
polar solvent - toluene, but PEG-NCC, EVA-NCC
and PVAc-NCC to polar solvent - ethanol vapour.
Data available in Fig.1 indicate that the best ethanol
vapour sensitivity has PEG-NCC followed by EVA-
NCC and PVAc-NCC. It can be seen that PEG-NCC
and EVA-NCC change in thickness has greater
impact on vapour sensitivity than PVAc-NCC and
PI-NCC.
Let us analize now VOC sensitivity of
composites versus thickness regarding its structural
state. As determined by DSC the EVA-NCC is
slightly crystalline and the PEG-NCC is highly
crystalline. Both these composites show greater
thickness impact on VOC sensitivity, than
amorphous polymer composites like PVAc-NCC
and PI-NCC. Explanation could be as follows. If the
composite film is rather thick, then larger crystalline
structures have been grown during formation of the
sample. These larger crystalline structures are harder
to dissolve by absorbed VOC. In amorphous
polymer structures exist a lot of free volume
cavities, where diffusion of analyte occurs. But in
crystalline polymer structures there are remarkably
less free volume cavities. Analyte diffusion in the
composite can take place only by dissolution of
crystalline structure, molecule rearrangement and
free volume cavities formation.
Figure 1: Relative electrical resistance change in VOC
versus composite thickness. PI-NCC samples exposed to
toluene (0.008ml/l). PVAc-NCC, EVA-NCC and PEG-
NCC samples exposed to ethanol (0.1ml/l).
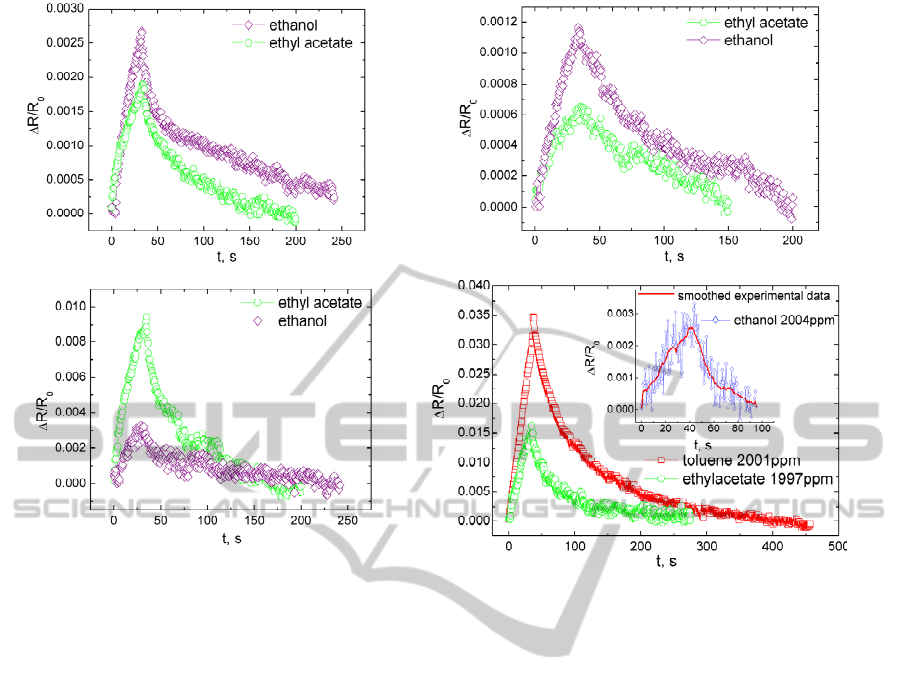
3.3 Selective Detection of VOC
PEG-NCC, PVAc-NCC, EVA-NCC and PI-NCC
selectivity to one specific class of solvents (polar or
non-polar) has been determined. Relative electrical
resistance change of PEG-NCC, PVAc-NCC and
EVA-NCC exposed to the same concentration
(~9100ppm) of polar (ethanol) vapour and weakly
polar (ethyl acetate) vapour is shown in Fig.2 (a, b, c).
Because of PEG-NCC and PVAc-NCC polar
matrix nature greater electrical resistance change can
be observed, when composites are exposed to
ethanol vapour. EVA-NCC shows sufficient
sensitivity to both ethanol and ethyl acetate vapour.
It is related to dual nature of EVA matrix. Rather
great part of EVA is ethylene (70.3%), therefore also
good sensitivity to ethyl acetate is observed. In Fig.2
(d) can be seen that PI-NCC has high sensitivity to
non-polar VOC, but electrical resistance response to
polar VOC is weak and dissipated.
Advantage of our produced composites
comparing to other polymer/conductive filler
composites is good sensitivity and fast reversibility
even if the composite is exposed to quite large VOC
concentrations (~9100ppm) (Choudhury, 2009).
Obtained results in Fig.2 evidence that grater role
plays matrix material compatibility with VOC than
the structural state of matrix material. PEG-NCC is
ICINCO 2011 - 8th International Conference on Informatics in Control, Automation and Robotics
372
b
)
)
d)
a
)
Figure 2: PEG-NCC (a), PVAc-NCC (b), EVA-NCC (c) relative electrical resistance change versus time, when samples
exposed to ethanol (9069ppm) and ethyl acetate (9105ppm). PI-NCC (d) relative electrical resistance change versus time,
when sample exposed to different VOC. Thickness of tested samples were as follows: PEG-NCC 110µm, PVAc-NCC
40µm, EVA-NCC 80µm and PI-NCC 40µm.
the most crystalline of all tested composites, but it
shows unexpectedly good VOC sensitivity due to
more polar like nature than PVAc-NCC and EVA-
NCC.
If we compare PI-NCC and PEG-NCC, PVAc-
NCC and EVA-NCC ethyl acetate sensitivity, then
we can observe that PI-NCC has greater relative
electrical resistance change than PEG-NCC, PVAc-
NCC and EVA-NCC. Even the PI-NCC is exposed
to reduced ethyl acetate concentration. But electrical
resistance relaxation time for PI-NCC is similar to
other tested composites. It is a challenge in future to
produce sensor material on the base of polymer
composite with highest possible sensitivity and with
as short as possible relaxation time. Fast recovery of
sensor material after analyte detection is very
important for alarm systems to exclude delayed
warning of VOC leakage. More adequate
comparison of PEG-NCC, EVA-NCC, PVAc-NCC
and PI-NCC responses will be made, when
percolation threshold for PEG-NCC, EVA-NCC,
PVAc-NCC will be determined and the most
sensitive polymer/HSCB composition found.
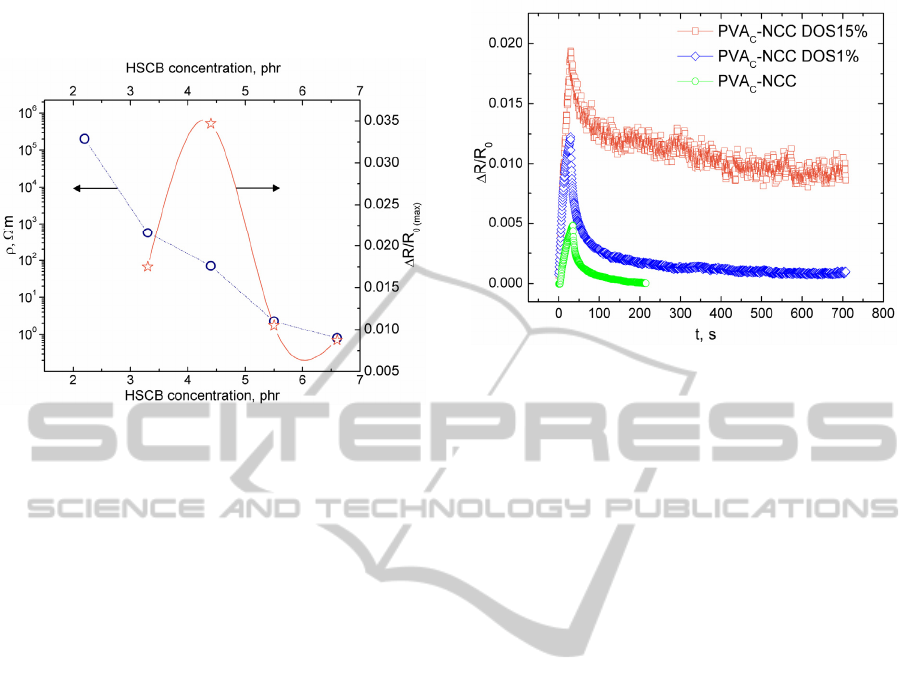
3.4 PI-NCC VOC Sensitivity Versus
HSCB Content
PI-NCC has been produced varying content of
HSCB from 2.2 to 6.6phr. PI-NCC transition from
isolator to electro conductive composite is shown in
Fig.3. PI-NCC specific electrical resistance
decreases with development of percolative HSCB
structure. Maximal relative electrical resistance
change of PI-NCC exposed to toluene vapour is also
displayed in Fig.3. Samples were held in vapour for
30s and then left in the air for electrical resistance
relaxation. Maximal relative electrical resistance
change is the highest obtained value of ΔR/R
0
, when
PI-NCC sample exposed to toluene vapour for 30s.
PI-NCC response to vapours are immediate,
electrical resistance starts to increase at the moment
of samples introduction to vapour. VOC sensor
effect of PI-NCC is reversible. Electrical resistance
of the composite PI-NCC_4.4phr shows the best
sensitivity. It is characteristically for
polymer/conductive nanoparticle composites to
exhibit the highest sensitivity in vicinity of isolator-
ATMOSPHERE CONTROL BY CHEMORESISTIVE POLYMER COMPOSITES
373
conductor transition (slightly above percolation
threshold).
Figure 3: PI-NCC specific resistance versus HSCB
concentration and PI-NCC toluene vapour sensitivity
(ΔR/R
0(max)
) versus HSCB loading in the composite.
Thickness of samples is 40µm. Toluene vapour
concentration is 2001ppm.
3.5 Plasticizer Impact on PVAc-NCC
Sensitivity
The worst ethanol vapour sensitivity has been
determined for PVAc-NCC despite the fact that
PVAc-NCC samples were produced with the
smallest thickness (Fig.1). It is not clear why EVA-
NCC shows better ethanol vapour sensitivity than
PVAc-NCC? Copolymer for EVA-NCC production
contains only 29.7% vinyl acetate. This can be
explained as fallow. When in a flexible (ethylene)
backbone stiff units (vinyl acetate) are introduced,
the stiff units are able to move, rearrange faster
under external influence.
We decided that PVAc still has insufficient
polymer chain mobility. Plasticizers can improve it.
1% and 15% of plasticizer di-n-octyl sebacate
(DOS) was added to PVAc-NCC and ethanol sensor
effect has been determined. Obtained results are
summarized in Fig.4. All tested samples were
exposed to ethanol vapour for 30s and then left in
the air for electrical resistance relaxation. The
plasticizer addition to the composite significantly
improves PVAc-NCC ethanol vapour sensitivity.
But PVAc-NCC electrical resistance reversibility
worsens at high plasticizer loadings.
Figure 4: Relative electrical resistance change for PVAc-
NCC with different DOS content. Thickness of samples is
50µm. Ethanol vapour concentration is 0,11ml/l.
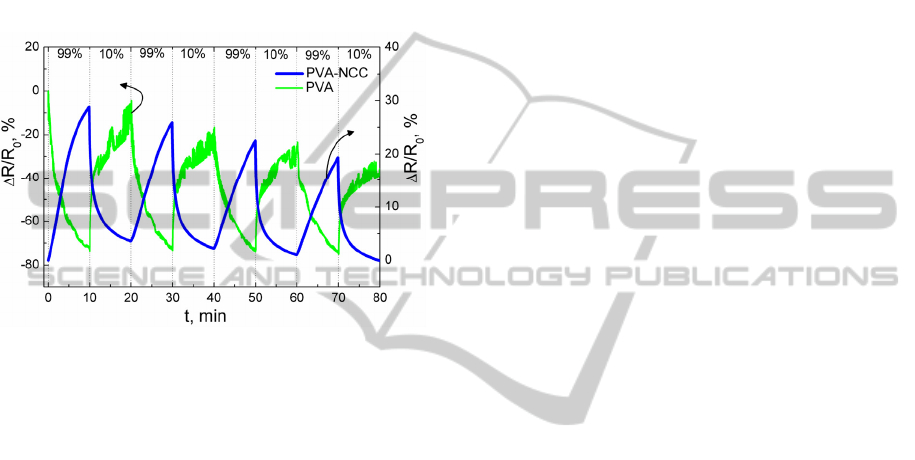
3.6 PVA-NCC Sensitivity to Relative
Humidity
Pure PVA and PVA-NCC electrical resistance
change was registered sequentially exposing samples
to 99% and 10% relative humidity (RH) (Fig. 5).
99% and 10% RH was obtained by using K
2
SO
4
and
ZnCl
2
oversaturated salt solution in water. Electrical
resistance of pure PVA decreases, when it is
exposed to 99% RH. On contrary, PVA-NCC
electrical resistance increases. Totally different RH
sensing mechanisms can explain such difference in
electrical resistance responses.
PVA consists of [–CH
2
-CH(OH)-]
n
repeating unit.
OH side group attached to the second C atom
determines PVA high hydrophilicity. If PVA is
exposed to high RH, water molecules adsorbe on the
surface by bonding to PVA OH side groups. It is
known that water normally exists as a mixture of
molecules, hydroxide ions (OH
-
) and hydronium
ions (H
3
O
+
). The third H
+
ion of hydronium ion can
perform hopping between adjacent adsorbed water
molecules. As a result proton conductivity is
realized in PVA and electrical resistance of pure
PVA at elevated RH decreases.
PVA-NCC case is more complicated. It is believed
that in PVA-NCC coexist two sensing mechanisms,
which counteract to each other. The first sensing
mechanism is the same as for pure PVA, that is,
proton conductivity. The second sensing mechanism
is charge tunnelling. There we should remember that
the composite consists of PVA with homogenously
dispersed HSCB. The HSCB nanoparticles form
conductive network throughout PVA matrix. When
ICINCO 2011 - 8th International Conference on Informatics in Control, Automation and Robotics
374
water molecules are adsorbed by highly hydrophilic
PVA, it swells and HSCB aggregates are withdrawn
from each other. As a result tunnelling currents in
thin layers of PVA between HSCB aggregates
decreases and PVA-NCC electrical resistance
increases.
For both PVA and PVA-NCC RH sensitivity
decreases with each measuring cycle. It can be
related to PVA great hydrophilic nature, at the time
of electrical resistance relaxation not all water
molecules are desorbed from PVA matrix.
Figure 5: Relative electrical resistance change versus time
of pure PVA and PVA-NCC, when samples were
sequentially exposed to 99% and 10% RH.
4 CONCLUSIONS
In this work possibility to use polymer
chemoresistive composites for VOC detection and
RH registration have been presented and following
conclusions can be made. Selectivity of the
composite can be managed with respect to desired
analyte. Sensitivity of the composite with stiff
polymer matrix can be greatly increased by addition
of plasticizer. The most sensitive VOC sensor
material can be obtained by choosing composite
with composition at the vicinity of percolation
threshold. In PVA-NCC two electrical resistance
change mechanisms exist, which compete to each
other. Composite matrix compatibility with analyte
vapour has greater influence on composite
sensitivity than composite material structural state.
Future research work would be devoted to
percolation transition determination for PEG-NCC,
PVAc-NCC and EVA-NCC.
ACKNOWLEDGEMENTS
This research was supported by Latvian National
Programme in Materials Science.
This work has been supported by the European
Social Fund within the project “Support for the
implementation of doctoral studies at Riga Technical
University”.
REFERENCES
Yang, Z. et al., 2009. Ethanol gas sensor based on Al-
doped ZnO nanomaterial with many gas diffusing
channels. Sensors and Actuators B: Chemical, 140(2),
pp.549-556.
Trinh, T. T. et al., 2011. Improving the ethanol sensing of
ZnO nano-particle thin films—The correlation
between the grain size and the sensing mechanism.
Sensors and Actuators B: Chemical, 152(1), pp.73-81.
Kang, N. K. et al., 2010. Evaluation of the limit-of-
detection capability of carbon black-polymer
composite sensors for volatile breath biomarkers.
Sensors and Actuators B: Chemical, 147(1), pp.55-60.
Wang, Y. et al., 2010. Flexible gas sensors with assembled
carbon nanotube thin films for DMMP vapor
detection. Sensors and Actuators B: Chemical, 150(2),
pp.708-714.
Van Dorst, B. et al., 2010. Recent advances in recognition
elements of food and environmental biosensors: a
review. Biosensors & Bioelectronics, 26(4), pp.1178-
1194.
Mahmoudi, E., 2009. Electronic Nose Technology and its
Applications. Sensors & Transducers Journal, 107 (8),
pp. 17-25.
Stasko, J., Kalnins, M., Dzene, A., Tupureina, V., 2009.
Poly(vinyl alcohol) hydrogels. Proceedings of the
Estonian Academy of Sciences, 58 (1) pp. 63–66.
Online data base http://athas.prz.rzeszow.pl/Default. aspx?
op=db
Nalawade, S., Picchioni, F. & Janssen, L., 2007. Batch
production of micron size particles from poly(ethylene
glycol) using supercritical CO
2
as a processing
solvent. Chemical Engineering Science, 62(6),
pp.1712-1720.
Sundar, M., Selladurai, S., 2006. Effect of fillers on
magnesium–poly (ethylene oxide) solid polymer
electrolyte. Ionics, 12 (4-5), pp.281-286.
Choudhury, A., 2009. Polyaniline/silver nanocomposites:
dielectric properties and ethanol vapour sensitivity.
Sensors and Actuators B, 138, pp. 318–325.
Ahmad, A., et. al 2009. Preparation and characterization
of PVC-Al
2
O
3
-LiClO
4
composite polymeric
electrolyte. Sains Malaysiana, 38 (4), pp.483–487.
Koo Choi, B., Hee Shin, K., 1996. Effects of SiC fillers on
the electrical and mechanical properties of
(PEO)
16
LiClO
4
electrolytes. Solid State Ionics, 86-88
(1), pp. 303-306.
ATMOSPHERE CONTROL BY CHEMORESISTIVE POLYMER COMPOSITES
375
