
ANOMALY DETECTION USING FIREFLY HARMONIC
CLUSTERING ALGORITHM
Mario H. A. C. Adaniya, Moises F. Lima, Lucas D. H. Sampaio,
Taufik Abr˜ao and Mario Lemes Proenc¸a Jr.
Department of Computer Science, UEL, State University of Londrina, Londrina, Brazil
Keywords:
Anomaly detection, Data clustering, Firefly algorithm, K-harmonic means.
Abstract:
The performance of communication networks can be affected by a number of factors including misconfigu-
ration, equipments outages, attacks originated from legitimate behavior or not, software errors, among many
other causes. These factors may cause an unexpected change in the traffic behavior, creating what we call
anomalies that may represent a loss of performance or breach of network security. Knowing the behavior
pattern of the network is essential to detect and characterize an anomaly. Therefore, this paper presents an
algorithm based on the use of Digital Signature of Network Segment (DSNS), used to model the traffic behav-
ior pattern. We propose a clustering algorithm, K-Harmonic means (KHM), combined with a new heuristic
approach, Firefly Algorithm (FA), for network volume anomaly detection. The KHM calculate a weighting
function of each point to calculate new centroids and circumventing the initialization problem present in most
center based clustering algorithm and exploits the search capability of FA from escaping local optima. Pro-
cessing the DSNS data and real traffic adata is possible to detect and point intervals considered anomalous
with a trade-off between the 90% true-positive rate and 30% false-positive rate.
1 INTRODUCTION
Nowadays the network is a vital part of any com-
pany and even an important part of our daily life.
Technology innovations brought us a facility to gather
and share information, to communicate our ideas with
others, the opportunity to work from home and other
small gestures that have become part of everyday life
and it would be impossible without the Internet. The
infrastructure behind the convenience, in most cases,
are monitored to prevent possible failures and loses
performance. The causes can be a simple misconfig-
uration to attacks that can harm the system, among
many other causes. One of the causes that may affect
the operation of the network is the anomaly behavior,
which has a focus on areas such as Network Traffic,
Data Mining, Image Processing, Credit Card Trans-
actions and other pointed in (Chandola et al., 2009).
In (Chandola et al., 2009) and (Patcha and Park,
2007), the authors provide a structured and compre-
hensive overview of the research on anomaly de-
tections summarizing other survey articles and dis-
cussing the importance and the applications in de-
tecting abnormalities. The basis of techniques and
the manner how they are applied in some domains.
Still a challenge in detecting anomalies, specially in
Network Traffic, is to identification what could be
consider an anomaly or not. In our work, we con-
sider anything anomaly that is outside a threshold
value of the Digital Signature of Network Segment
(DSNS) generated by GBA tool (Automatic Back-
bone Management) presented in (Proenc¸a et al., 2006)
and briefly described in the section 3. The threshold
value is discussed in the section 4.
Clustering is a technique where is possible to find
hidden patterns that may exist in datasets and it is
possible to infer better conclusions. Clustering tech-
niques are applied in Data Mining and known as “vec-
tor quantization” when dealing with Speech and Im-
age data (G¨ung¨or and
¨
Unler, 2007). The most pop-
ular Clustering algorithm is K-means (KM) because
it can deal with a large amount of data (MacQueen,
1967), is fast in most cases and it is simple to imple-
ment. The main basic idea is to partition the dataset
into K clusters. Two weak aspects of KM is the sensi-
tivity to initialization and convergence to local optima
(Selim and Ismail, 1984). To solve the initialization
sensitivity Zhang proposed in 2000 the K-Hamornic
means (KHM) (Zhang et al., 1999), minimizing the
63
H. A. C. Adaniya M., F. Lima M., D. H. Sampaio L., Abrão T. and Lemes Proença Jr. M..
ANOMALY DETECTION USING FIREFLY HARMONIC CLUSTERING ALGORITHM.
DOI: 10.5220/0003525800630068
In Proceedings of the International Conference on Data Communication Networking and Optical Communication System (DCNET-2011), pages 63-68
ISBN: 978-989-8425-69-0
Copyright
c
2011 SCITEPRESS (Science and Technology Publications, Lda.)

harmonic mean average of all points of N in all cen-
ters of K. In section 5 is discussed the clustering and
K-Harmonic in details.
It is found in the literature heuristic methods
where the main advantage pointed out by the authors
is the characteristic of not converge rapidly to local
optima. Tabu Search, Simulated Annealing, Particle
Swarm Optimization, Ant Colony Optimization are
examples of such methods. Firefly Algorithm (FA)
is a relatively new method developed by Yang (Yang,
2008) in 2008. FA is inspired by the behavior of fire-
flies, the intensity of the lights and the attraction are
the keys to the proper functioning of the algorithm. In
section 6 the algorithm is described in more detail.
In this paper we proposed a hybrid data cluster-
ing algorithm based on KHM and FA, called Firefly
Harmonic Clustering Algorithm (FHCA) described in
section 7. Exploring the advantages of both algorithm
to apply it to detect anomalies in real network traffic
is possible to achieve. A trade-off between the 90%
true-positive rate and 30% false-positive rate.
In Section 2 some related works are discussed in
the literature using heuristic, clustering and both tech-
niques applied to detect anomalies. Section 3 de-
scribes the GBA tool. Section 4 describes the context
anomaly adopted. Section 5 introduces KHM clus-
tering. Section 6 is relative to the Firefly Algorithm.
Section 7 is about the proposed algorithm. Section
8 presents the results achieved by the proposed algo-
rithm. Section 9 presents the conclusion and future
improvements.
2 RELATED WORK
The anomaly detection receives special attention in
Network Traffic, because it concern directly to qual-
ity and security of service provide to end-users, com-
panies and other services are directly affected. In
(Zhang et al., 2009) is presented a survey on anomaly
detection methods: statistical, based on classifier, ma-
chine learning and use of finite state machines. Ac-
cording to this classification, our model is based on
a classifier, where the anomaly detection depends on
the idea that normal characteristics behavior can be
distinguished from abnormal behavior. Digital Signa-
ture of Network Segment (DSNS) generated by GBA
(Automatic Backbone Management) tool is assumed
as a normal traffic.
Techniques of clustering have the characteristic of
grouping data objects into clusters, where the objects
in each cluster are similar and different from others
cluster. Through clustering is possible to find new
patterns in datasets that may need a new way to obser-
ve to make new . In (Patcha and Park, 2007), the
authors pointed out the ability to learn from the data
set without the need to describe the various anomalies
types, resulting in a reduction of time spent in train-
ing.
In (Sequeira and Zaki, 2002), the method concen-
trates on user command-level data and the authors
proposeda system with host-based data collection and
processing. The author’s justification to adopt clus-
tering are: a cluster presenting low variance is effi-
ciently represented by its center, with a constraint on
the cluster support is possible to reduce noise and re-
tain more relevant clusters and if the intra-cluster sim-
ilarity threshold.
Clustering and heuristics to form a hybrid solution
with better results is not new in literature, is found
in (Pham et al., 2007) where the authors make use
of the Bee Algorithm to overtake the K-means (KM)
local optima problem, but there is still the initial-
ization problem. In (Yang et al., 2009), the authors
make use of Particle Swarm Optimization (PSO) and
in (G¨ung¨or and
¨
Unler, 2007) the authors use Simu-
lated Annealing (SA), but the adopted clustering al-
gorithm is the K-Hamornic Means (KHM).
The use of clusters and heuristics combined in the
area of anomaly detection is also found in the litera-
ture. Lima (Lima et al., 2010) uses the PSO algorithm
with the K-means clustering for detecting anomalies
using as regular data the DSNS generated by BLGBA
(Proenc¸a et al., 2006). The system seeks to find the
distances between points and their centroid, and for a
given threshold value the system triggers alarms for
the network administrator.
3 TRAFFIC
CHARACTERIZATION:
BLGBA AND DSNS
The first step to detect anomalies is to adopt a
model that characterizes the network traffic effi-
ciently, which represents a significant challenge due
to the non-stationary nature of network traffic. Thus,
the GBA tool is used to generate different profiles of
normal behavior for each day of the week, meeting
this requirement. These behavior profiles are named
Digital Signature of Network Segment (DSNS), pro-
posed by Proenc¸a in (Proenc¸a et al., 2006) and applied
to anomaly detection with great results in (Zarpel˜ao
et al., 2009).
Hence, the BLGBA algorithm was developed
based on a variation in the calculation of statistical
mode. In order to determine an expected value to a
DCNET 2011 - International Conference on Data Communication Networking
64
given second of the day, the model analyzes the val-
ues for the same second in previous weeks. These
values are distributed in frequencies, based on the
difference between the greatest G
aj
and the smallest
S
aj
element of the sample, using 5 classes. This dif-
ference, divided by five, forms the amplitude h be-
tween the classes, h = (G
aj
− S
aj
)/5. Then, the limits
of each L
Ck
class are obtained. They are calculated
by L
Ck
= S
aj
+ h∗ k, where C
k
represents the k class
(k = 1... 5). The value that is the greatest element in-
serted in the class with accumulated frequency equal
or greater than 80% is included in DSNS.
The samples for the generation of DSNS are col-
lected second by second along the day, by the GBA
tool. The DSNS generated is the bl-7 consisting of
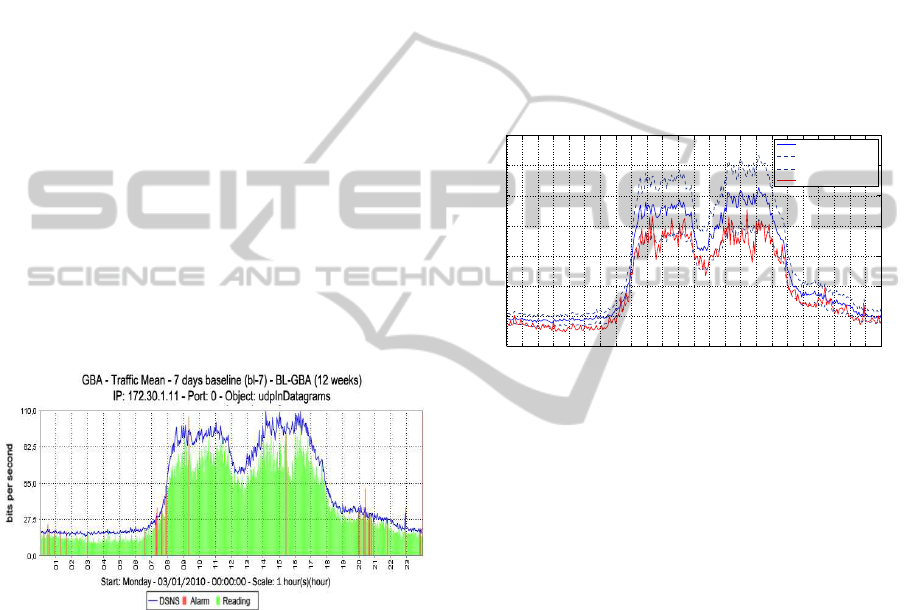
one DSNS for each day of the week. Figures 1, shows
chart containing one day of monitoring of UEL net-
work. Data were collected from SNMP object udpIn-
Datagrams, at the University’s Proxy server. The data
collected are represented in green and the respective
DSNS values by the blue line. The charts show that
traffic has a periodic behavior, where traffic levels are
higher during the working hours, from 8 a.m. to 6
p.m. It is possible to observe a great adjustment be-
tween the behavior of real traffic and the DSNS.
Figure 1: DSNS and real traffic collected from GBA of
03/01/2010.
4 ANOMALY DEFINITION
We define anomaly in our context based on the vol-
ume, the definition helps to characterize if an interval
found by the proposed algorithm could be classified
as an anomaly, or not. Given the parameters: ∆ and
λ, where, ∆ is the hysteresis interval adopted, λ is
the threshold value acceptable inside the ∆ interval,
anomaly is defined as described in 1.
A(x) =
1,x ∈ λ
0,c.c.
(1)
The λ parameter is a representation of the varia-
tion occurred in the DSNS. In our work, λ takes the
value of standard deviation of the DSNS data. The
range of threshold using λ equals to the standard de-
viation of DSNS, is possible to create a range to com-
pare sets of data that may have the same mean but a
different range, in other words, the real traffic is ex-
pected to follow the DSNS in a different scale. In
figure 2, the blue line represents the DSNS, and the
drawn lines represent the acceptable range created
from DSNS, representing λ up and down. The real
traffic is the red line, inside the threshold range and
we can observe most of the real traffic points inside
the threshold range and other points outside of the
range, these intervals outside are considered anomaly.
0 1 2 3 4 5 6 7 8 9 10 11 12 13 14 15 16 17 18 19 20 21 22 23 24
0
20
40
60
80
100
120
140
Time [Hour]
Volume [bits per second]
DSNS, Threshold range and Real Traffic
DSNS
Threshold
UP
Threshold
DOWN
Real Traffic − 03/01/2010
Figure 2: The DSNS, Threshold range and real traffic
within.
5 K-HARMONIC MEANS
CLUSTERING
A method of unsupervised classification of patterns
into groups is called Clustering. In analyzing the data,
the clustering problem has combinatorially character-
istic. The existing clustering techniques are classi-
fied according to some features: agglomerative vs.
divisive, monothetic vs. polythetic, hard vs. fuzzy,
deterministic vs. stochastic, incremental vs. non-
incremental (Jain et al., 1999). Another important as-
pect in clustering is the similarity measure that define
how similar a given data x is to a cluster.
In (Zhang et al., 1999), Zhang proposed the K-
Harmonic means (KHM), where the main idea is
throught of the harmonic mean distance between a
data point to all the centers. The author demonstrate
that KHM is insensitive to the initialization of the cen-
ters. Assuming the KHM the optimization function in
equation 2. Assuming the notation founded in (Yang
et al., 2009):
X = {x
1
,. . . , x
n
} : the data to be clustered;
ANOMALY DETECTION USING FIREFLY HARMONIC CLUSTERING ALGORITHM
65

C = {c
1
,. . . , c
k
} : the set of cluster centers;
KHM(X,C) =
n
∑
i=1
k
∑
k
j=1
1
kx
i
−c
j
k
p
(2)
where p is an input parameter of KHM and as-
sume p ≥ 2.
The KHM calculate the membership function
(equation 3) describing the proportion of data point
x
i
that belongs to center c
j
:
m(c
j
|x
i
) =
kx
i
− c
j
k
−p−2
∑
k
j=1
kx
i
− c
j
k
−p−2
, (3)
and the weight function (equation 4) defining hoe
much influence data point x
i
has in re-computing the
center parameters in the next iteration:
w(x
i
) =
∑
k
j=1
kx
i
− c
j
k
−p−2
(
∑
k
j=1
kx
i
− c
j
k
−p
)
2
(4)
6 FIREFLY ALGORITHM
Firefly Algorithm (FA) was designed by Yang (Yang,
2008) in 2008. FA was developedbased on the behav-
ior of fireflies and the behavior of light emitted. Many
biologists still debate the importance and usage of the
flashes used by fireflies, but it is known that is used to
attract partners for mating, some cases to attract future
prey, often as a security mechanism. Some important
features are the length of the brightness, the bright-
ness level and rhythm. It is known that the brightness
level of I is inversely proportional to the distance r,
and I ∝ 1/r
2
, the brightness decreases with distance
from the observer (Yang, 2009).
The proposed algorithm follows three rules: 1) all
fireflies are unisex and can attract and be attracted,
2) The attractiveness is proportional to the brightness
by moving the firefly fainter toward the brighter, 3)
The brightness is directly linked to the function of
the problem treated. Two important issues must be
addressed: the variation of light intensity and the for-
mulation of attractiveness. The author suggests a sim-
plifying assumption that the attractiveness of a firefly
is determined by its brightness, which in turn is as-
sociated with the objective function encoded (Yang,
2009). The pseudo-code presented by (Yang, 2008) is
implemented as follow:
Objective function
f(x), x = (x
i
,..., x
d
)
T
Initialize a population of fireflies
x
i
(i = 1, 2, ..., n)
Define light absorption coefficient
γ
while
(t < MaxGeneration)
for
i = 1:n all n fireflies
for
j = 1:n all n fireflies
Light intensity
I
i
at
x
i
is determined
by f(
x
i
)
if ( I
j
> I
i
)
Move firefly i towards j in all d
dimensions
end if
Attractiveness varies with equation
(9)
Evaluate new solutions and update
light intensity
end for
end for
Rank the fireflies and find the current best
end while
Postprocess results and visualization
7 FIREFLY HARMONIC
CLUSTERING ALGORITHM
Presented the K-Harmonic means (KHM) algorithm
to clustering data in section 5 and the heuristic Firefly
Algorithm (FA) in section 6, this section will be dis-
cussed the implementation of Firefly Harmonic Clus-
tering Algorithm (FHCA).
Merging and using the benefits of the two algo-
rithms we propose the FHCA and applied it to the
volume anomaly detection of network traffics. The
first step is almost the same as presented in 5, adding
a step after (2), where we use the FA to optimize the
equation 2.
1. Initialize the algorithm with randomly
choose the initial centers;
2. Calculate the objective function value
according to equation (4);
3. Optimize the equation (4) with FA;
4. For each data point
x
i
compute the
membership value according to equation (5);
5. For each data point
x
i
, calculate
the weight function according to equation (6);
6.For each center
c
j
, recompute its
location based on the equations (5) and (6):
c
j
=
∑
n
i=1
m(c
j
|x
i
)w(x
i
)x
i
∑
n
i=1
m(c
j
|x
i
)w(x
i
)
7. Repeat steps 2-6 until KHM(X,C) does not
change or predefined number of iterations;
8. Assign data point
x
i
to cluster j
with the biggest
m(c
j
|x
i
)
.
Once the centroids are defined the classification
part comes into action to label the intervals in anoma-
lous or normal. The following steps describe the pro-
cess:
1. Calculate the distance (dist_dsns) between
the DSNS (D) points and the centroids (C);
DCNET 2011 - International Conference on Data Communication Networking
66

2. M = max(dist_dsns), M is only the highest
distance from all centroids;
3. Calculate the distance (dist_traf) between
the real traffic (T) points and
the centroids (C);
4. MT = max(dist_traf), MT is the highest
traffic distance from all centroids;
5. To classify each
∆
interval
calculate the
λ
of D;
6. Compare M and MT, if MT > M, then cont+1;
7. if cont > (
λ
* size of MT) then
the interval is classified as anomaly
else is classified as anomaly
8 RESULTS
To validate the proposed algorithm were real data col-
lected from the Proxy server of the network environ-
ment from State University of Londrina (UEL) which
receive traffic from 5,000 computers connected to its
network. One week starting from 03/01/2010 (Mon-
day) until 03/05/2010 (Friday) and the MIB object
udpInDatagrams represent the total number of UDP
datagrams delivered to UDP users was collected.
To measure if the proposed approach is feasible or
not, the metrics adopted are classical and discussed in
(Fawcett, 2005). Changing the nomenclature to our
context, the metric is composed of several variables:
• True Positive. If the instance is anomaly and is
classified as an anomaly;
• False Positive. If the instance is normal and is
classified as an anomaly;
Through the declared variables can be calculated:
False-positive rate =
False Positive
Number of Normal Data
(5)
True-positive rate =
True Positive
Number of Anomaly Data
(6)
Precision =
True Positive
True Positive + False Positive
(7)
Equation (5) describes how much of the inter-
val pointed by the FHCA was classified wrongly.
Equation (6) describes the successes of FHCA al-
gorithm classifying. Equation (7) is the percentage
of corrected data classified throughout all the data
classified. The Receiver Operating Characteristics
(ROC) graph is a technique to visualize the perfor-
mance based on the parameters and demonstrated the
better trade-off between false-positive rate and true-
positive-rate.
For the KHM parameters, p = 2 and FA param-
eters, γ = α = 0, 2 and β
0
= 1 and the population,
N = ∆/2. For the number of centroids where adopted
K = 2,3 and 4. The number of cluster formed in the
dataset is an important characteristic, and we tested K
= 2,3 and 4. In figure 3 is presented the true-positive
rate varying in ∆ intervals. K = 2 present the highest
true-positive rate and low changing among the inter-
vals. K = 3 provides an average result but worse than
K = 1. K = 4 has the worst rates. For the following
graphs and results, we assume K = 2.
1200900600300
0
0.1
0.2
0.3
0.4
0.5
0.6
0.7
0.8
0.9
1
∆ interval
True−positive rate
True−positive comparison varying K
K = 4
K = 2
K = 3
Figure 3: Comparison of true-positive rate for differents
values of K.
In figure 4, the performance of the algorithm is
presented. The true-positive achieves high rates and
in return the false-positive rate increases as well. The
trade-off is when the true-positive rate is in approx-
imately 91% and the false-positive rate nearly 35%.
Inside the figure 4 it is presented the precision graph
varying with the ∆ interval, as we increase ∆ the preci-
sion decreases. This can be explained by the fact that
if we increase the interval, we will have more points
to analyze and cluster. Increasing the points within a
range lowers the level of detail and it is possible to as-
sume points as anomalous part of the normal set and
would be grouped as anomalous if the interval was
smaller.
0.35 0.4 0.45 0.5 0.55 0.6 0.65 0.7
0.85
0.9
0.95
1
ROC Curve
False−positive rate [%]
True−positive rate [%]
1200900600300
0.65
0.7
0.75
Precision
∆ interval
%
Figure 4: Simulated dataset type 3, with controlled range
nullifying the volume.
ANOMALY DETECTION USING FIREFLY HARMONIC CLUSTERING ALGORITHM
67

9 CONCLUSIONS
In our work we proposed a new algorithm based on
the merge of two algorithms: K-Hamornic means
(KHM) and Firefly Algorithm (FA), named Firefly
Harmonic Clustering Algorithm (FHCA). The FHCA
utilizes the strength of KHM giving weight to mem-
bers in calculating the centroids, circumventing the
initialization problem present in center based cluster-
ing algorithm and exploits the search capability of FA
in escaping local optima.
Applying the FHCA to detect abnormalities in
volume, the results achieve by the algorithm are
satisfactory presenting high true-positive rates and
medium false-positive rates. The results present a
true-positive rate above 90% and false-positive rates
of nearly 30%. For anomaly techniques applied
in real time the algorithm present a complexity of
O(N*K*D), where N = data points, K = number of
centers and D = dimension.
The next step is to combine the power of FHCA
with another technique, i.e., Principal Component
Analysis (PCA) or Support Vector Machine (SVM)
to use other objects collected from the same segment
network to group the results adding more complex-
ity to increase the precision and decrease the false-
positive rate.
ACKNOWLEDGEMENTS
This work was supported by Coordenac¸˜ao de
Aperfeic¸oamento de Pessoal de N´ıvel Superior
(CAPES) through a post-graduate master’s degree
level and Fundac¸˜ao Arauc´aria by the financial support
for the Riguel Project.
REFERENCES
Chandola, V., Banerjee, A., and Kumar, V. (2009).
Anomaly detection: A survey. ACM Computing Sur-
veys., 41(3).
Fawcett, T. (2005). An introduction to ROC analysis. Pat-
tern Recognition Letters, 27:861–874.
G¨ung¨or, Z. and
¨
Unler, A. (2007). K-harmonic means data
clustering with simulated annealing heuristic. Applied
Mathematics and Computation, 184(2):199–209.
Jain, A., Murty, M., and Flynn, P. (1999). Data clustering:
A review. ACM Computing Survey, 31(3):264–323.
Lima, M., Zarpel˜ao, B., Sampaio, L., Rodrigues, J., Abr˜ao,
T., and Proenc¸a Jr., M. (2010). Anomaly detection
using baseline and k-means clustering. In Software,
Telecommunications and Computer Networks (Soft-
COM), 2010 International Conference on, pages 305
–309.
MacQueen, J. B. (1967). Some methods for classification
and analysis of multivariate observations. In Pro-
ceedings of 5th Berkeley Symposium on Mathematical
Statistics and Probability, pages 281–297.
Patcha, A. and Park, J.-M. (2007). An overview of anomaly
detection techniques: Existing solutions and latest
technological trends. Computer Networks: The In-
ternational Journal of Computer and Telecommunica-
tions Networking, 51:3448–3470.
Pham, D. T., Otri, S., Afify, A. A., Mahmuddin, M., and
Al-Jabbouli, H. (2007). Data clustering using the bees
algorithm. In Proc 40th CIRP Int. Manufacturing Sys-
tems Seminar, Liverpool.
Proenc¸a, M. L., Coppelmans, C., Botolli, M., and
de Souza Mendes, L. (2006). Security and reliability
in information systems and networks: Baseline to help
with network management., pages 149–157. Springer.
Selim, S. Z. and Ismail, M. A. (1984). K–means type algo-
rithms: A generalized convergence theorem and char-
acterization of local optimality. IEEE Transactions on
Pattern Analysis and Machine Intelligence, 6:81–86.
Sequeira, K. and Zaki, M. (2002). Admit: anomaly-
based data mining for intrusions. In Proceedings
of the eighth ACM SIGKDD international conference
on Knowledge discovery and data mining, KDD ’02,
pages 386–395, New York, NY, USA. ACM.
Yang, F., Sun, T., and Zhang, C. (2009). An efficient hybrid
data clustering method based on k-harmonic means
and particle swarm optimization. Expert Syst. Appl.,
36(6):9847–9852.
Yang, X.-S. (2008). Nature-Inspired Metaheuristic Algo-
rithms. Luniver Press.
Yang, X.-S. (2009). Firefly algorithms for multimodal opti-
mization. In Stochastic Algorithms: Foundations and
Applications, SAGA 2009, Lecture Notes in Computer
Sciences, volume 5792, pages 169–178.
Zarpel˜ao, B. B., de Souza Mendes, L., Jr., M. L. P., and
Rodrigues, J. J. P. C. (2009). Parameterized anomaly
detection system with automatic configuration. In
GLOBECOM, pages 1–6. IEEE.
Zhang, B., Hsu, M., and Dayal, U. (1999). K-harmonic
means - a data clustering algorithm. Technical Report
HPL-1999-124, Hewlett-Packard Laboratories.
Zhang, W., Yang, Q., and Geng, Y. (2009). A survey of
anomaly detection methods in networks. In Computer
Network and Multimedia Technology, 2009. CNMT
2009. International Symposium on, pages 1 –3.
DCNET 2011 - International Conference on Data Communication Networking
68
